US Dollar, EUR/USD Talking Points:
- The US Dollar continued to pullback after this morning’s PPI report, which printed well-above expectations at 2.2% v/s 1.6% YoY, also with a revision to last month, up to 2.0% from a prior read of 1.6%.
- The US Dollar set a fresh three-week low after that report was released, furthering the theme of USD-weakness even despite strong data, such as we saw on NFP Friday. I discussed this in yesterday’s webinar, where data isn’t always a direct driver of prices, as the median between the two are market participants, and sentiment matters.
- Tomorrow brings the release of US CPI for the month of September and this can similarly keep USD on the move, along with several other related markets like EUR/USD, Gold and SPX. The big question is whether it brings back the bullish USD trend or whether the pullback continues after 11 consecutive weekly gains.
- I’ll be discussing these themes in-depth in the weekly webinar on Tuesday at 1PM ET. It’s free for all to register: Click here to register.
The US Dollar has continued to pullback and this morning saw the currency trade at a fresh three-week low following the release of PPI data for the month of September. That data point for Producer Prices is often looked at as a precursor to Consumer Prices or the CPI index, and the fact that inflation is surprising to the upside again is probably somewhat disconcerting to stock market bulls, as this may force the Fed to further address inflation via more rate hikes.
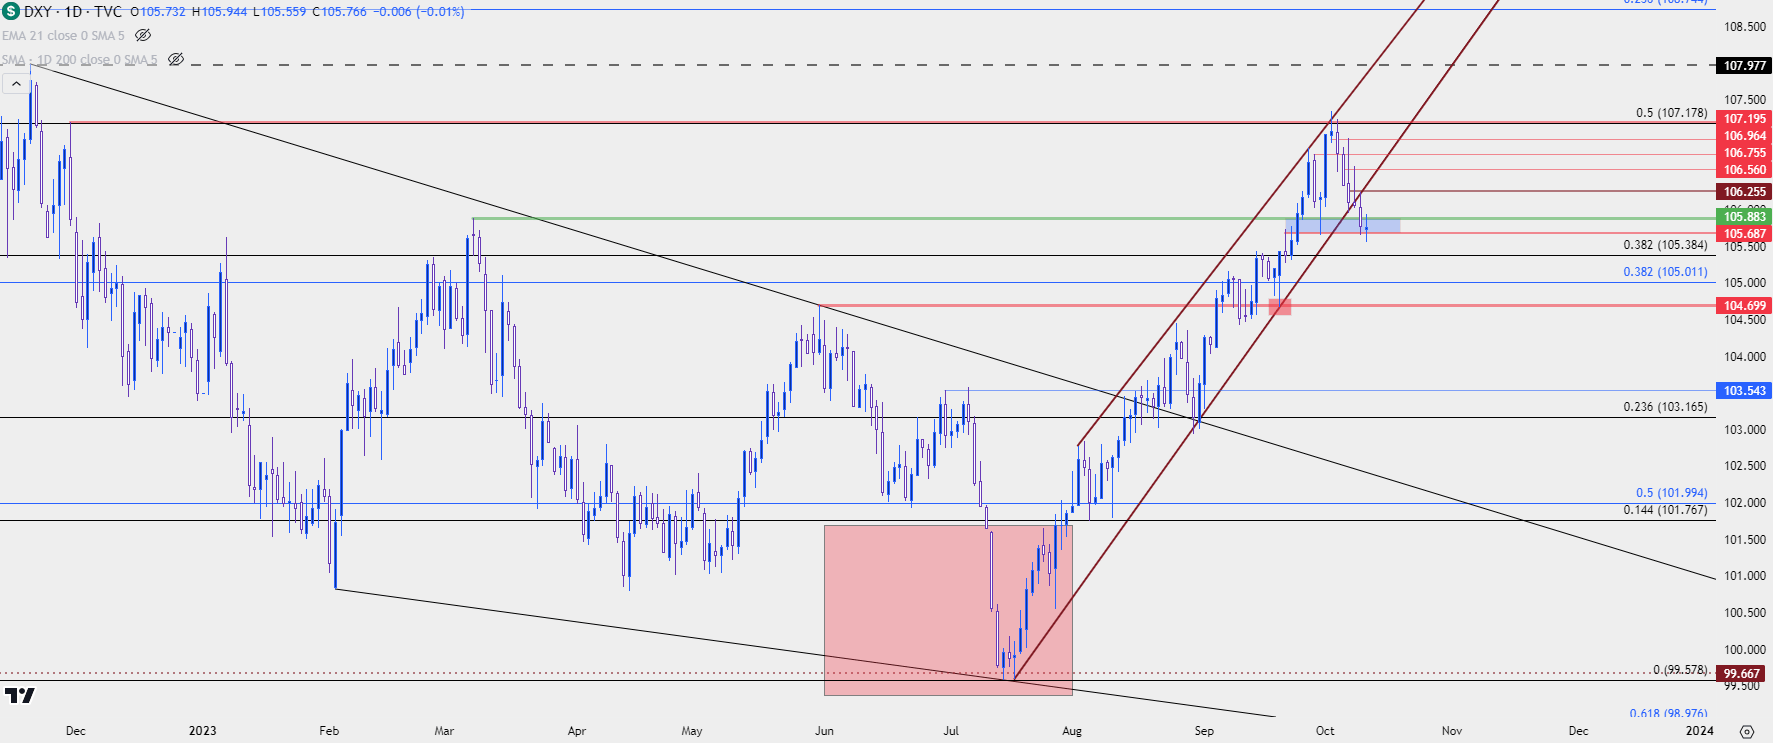
If looking at price action, however, that would not be evident, as the reaction to this morning’s PPI data was similar to the reaction to last Friday’s NFP report, which was USD weakness even on the back of a strong data print. This may have more to do with the technical picture of the currency, as the USD had posted 11 consecutive weeks of gain until finally showing a bearish candle last week. That bearish candle printed as a gravestone doji, which puts a bearish tint on an otherwise indecisive matter of the doji, and so far this week bears have continued that push.
The question now is whether they get more downside run after tomorrow’s CPI report, or whether that data print provides a catalyst for Dollar-bulls to get back in the driver’s seat. On the below chart, we’re looking at the pullback in that bullish trend. DXY set a fresh yearly high just last Tuesday, and since then, it’s been mostly to the favor of bears as prices have posted five consecutive daily declines.
Price is testing a zone of support right now at 105.69-105.88, which I had highlighted in yesterday’s webinar. Below that, support potential remains at 105.38, 105.01 and then 104.70, which had set the swing low on FOMC-day in late-September.
US Dollar - DXY Daily Price Chart (indicative only, not available on Forex.com platforms)
 Chart prepared by James Stanley; data derived from Tradingview
EUR/USD
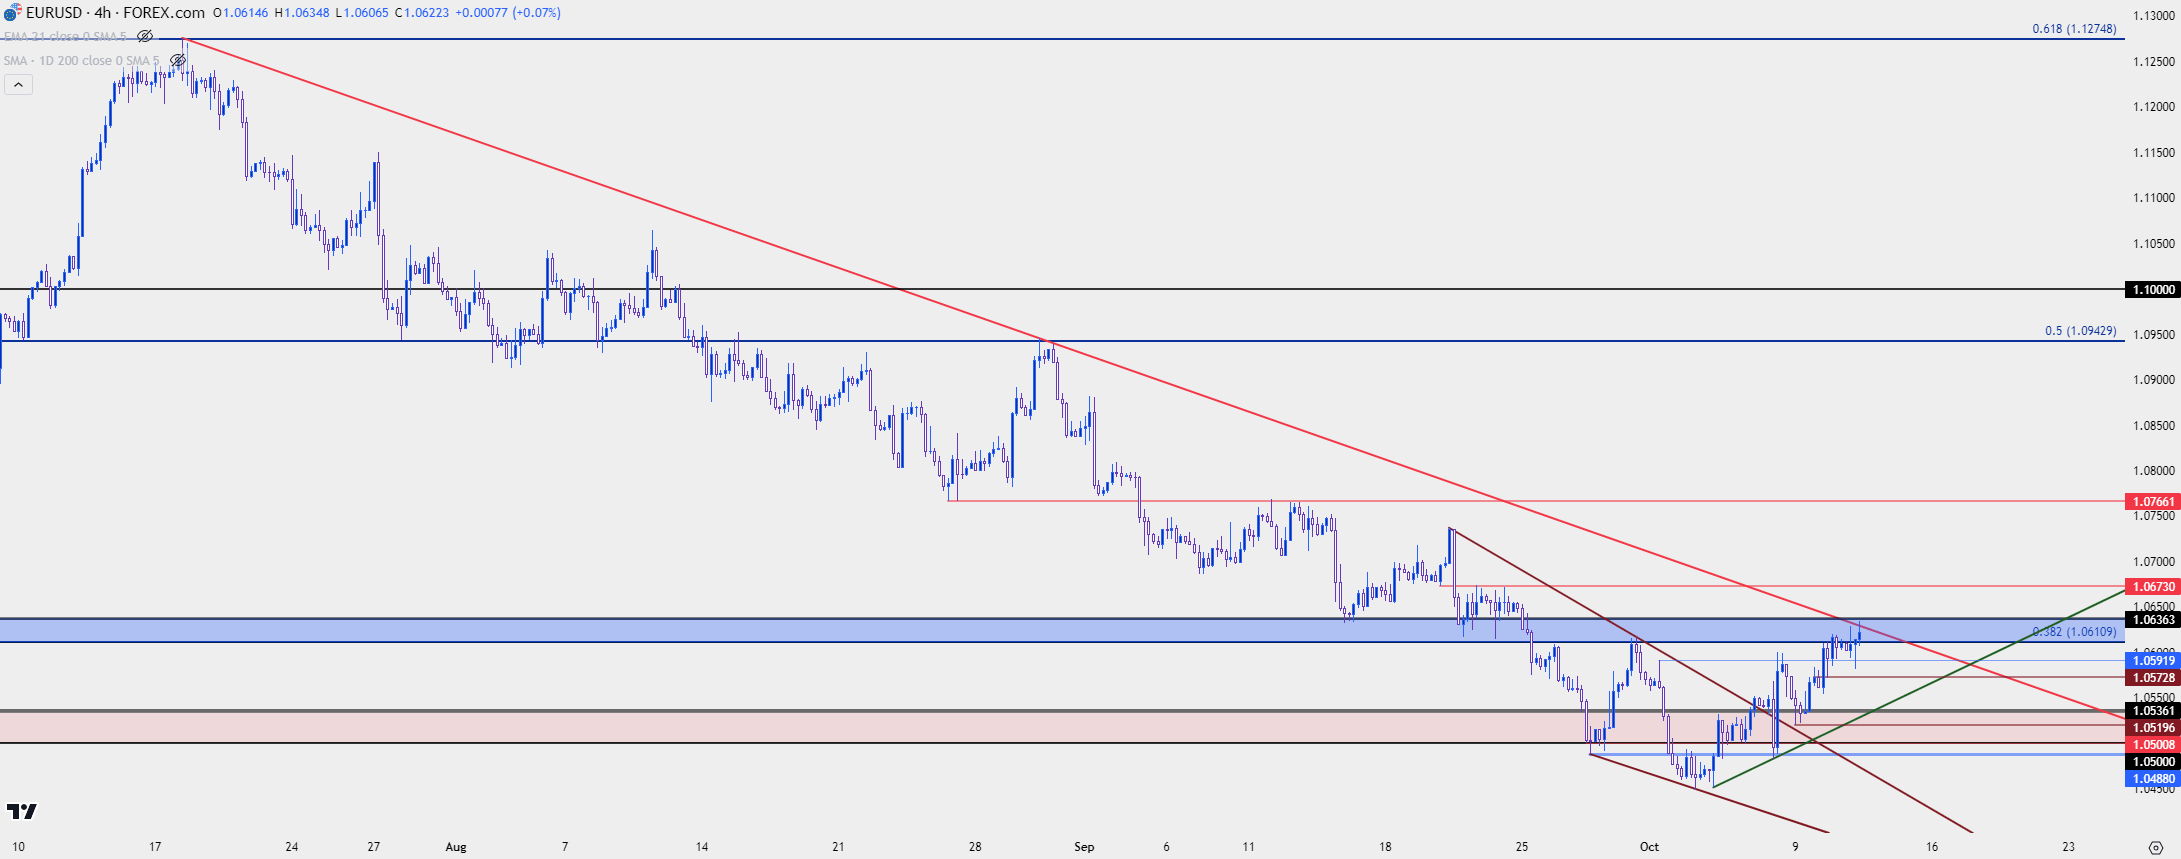
As the USD has pulled back from heavily overbought conditions, EUR/USD has put in a bounce after showing oversold conditions over the past couple of weeks. I had highlighted this setup last week, along with the fact that the last oversold RSI reading in EUR/USD’s daily chart took place a year prior, just before the pair had started to rally which held into 2023 trade.
Of interest for support is the fact that the 1.0500 area proved a stubborn spot for bears, and this becomes issue again if sellers can force a re-test in the near-term. But, at this stage the pullback in the pair is continuing to build and price is now re-testing a bearish trendline as taken from the July highs. There’s also the 1.0636 level sitting overhead and the 1.0673 prior swing above that.
If EUR/USD bears can continue to push, the next major waypoint is around the 1.0750 psychological level, plotted at a prior swing low-turned-high at 1.0766.
EUR/USD Four-Hour Price Chart
 Chart prepared by James Stanley, EUR/USD on Tradingview
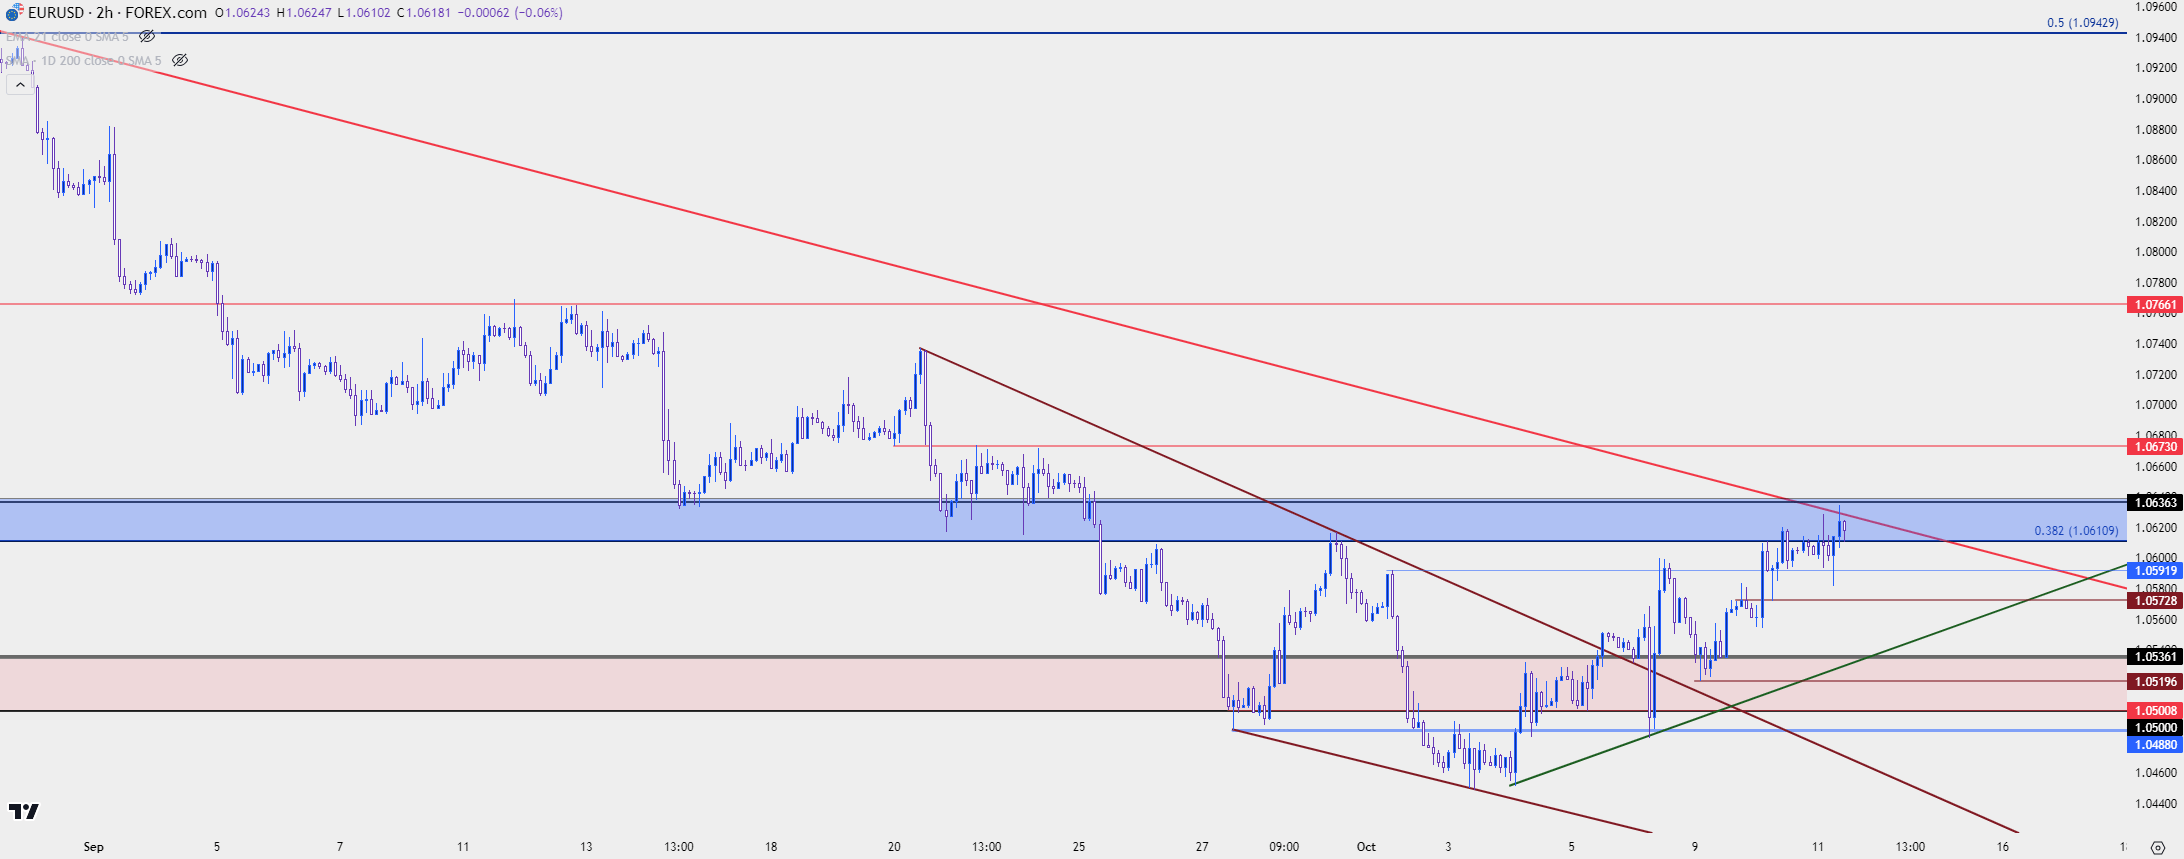
On the two-hour chart below, I’m taking a closer look at that trendline inflection, as there remains a sequencing of higher-highs and higher-lows. At this point, the 1.0572 level appears key for bulls to hold in order to retain the bullish short-term theme. Given the frequency of tests at 1.0636, there may be some stops on short positions sitting above that level which, if triggered, could add some demand to the picture which could extend the bullish move.
Again, the big question is whether or where sellers may decide to jump in and re-take control and at this stage, given the continued higher-highs and lows there’s little evidence of bears re-taking control yet.
EUR/USD Two-Hour Price Chart
 Chart prepared by James Stanley, EUR/USD on Tradingview
GBP/USD Recovery Rally
While EUR/USD was in a consistent streak of losses to go with the bullish theme in the US Dollar, GBP/USD posted an even larger decline, dropping by as much as -8.4% from the July high down to last week’s low, compared to a move of +7.79% in the US Dollar or -7.34% in EUR/USD. So, if we are seeing a theme of USD-strength on the way back, GBP/USD may make for a more compelling backdrop to work with that scenario than EUR/USD.
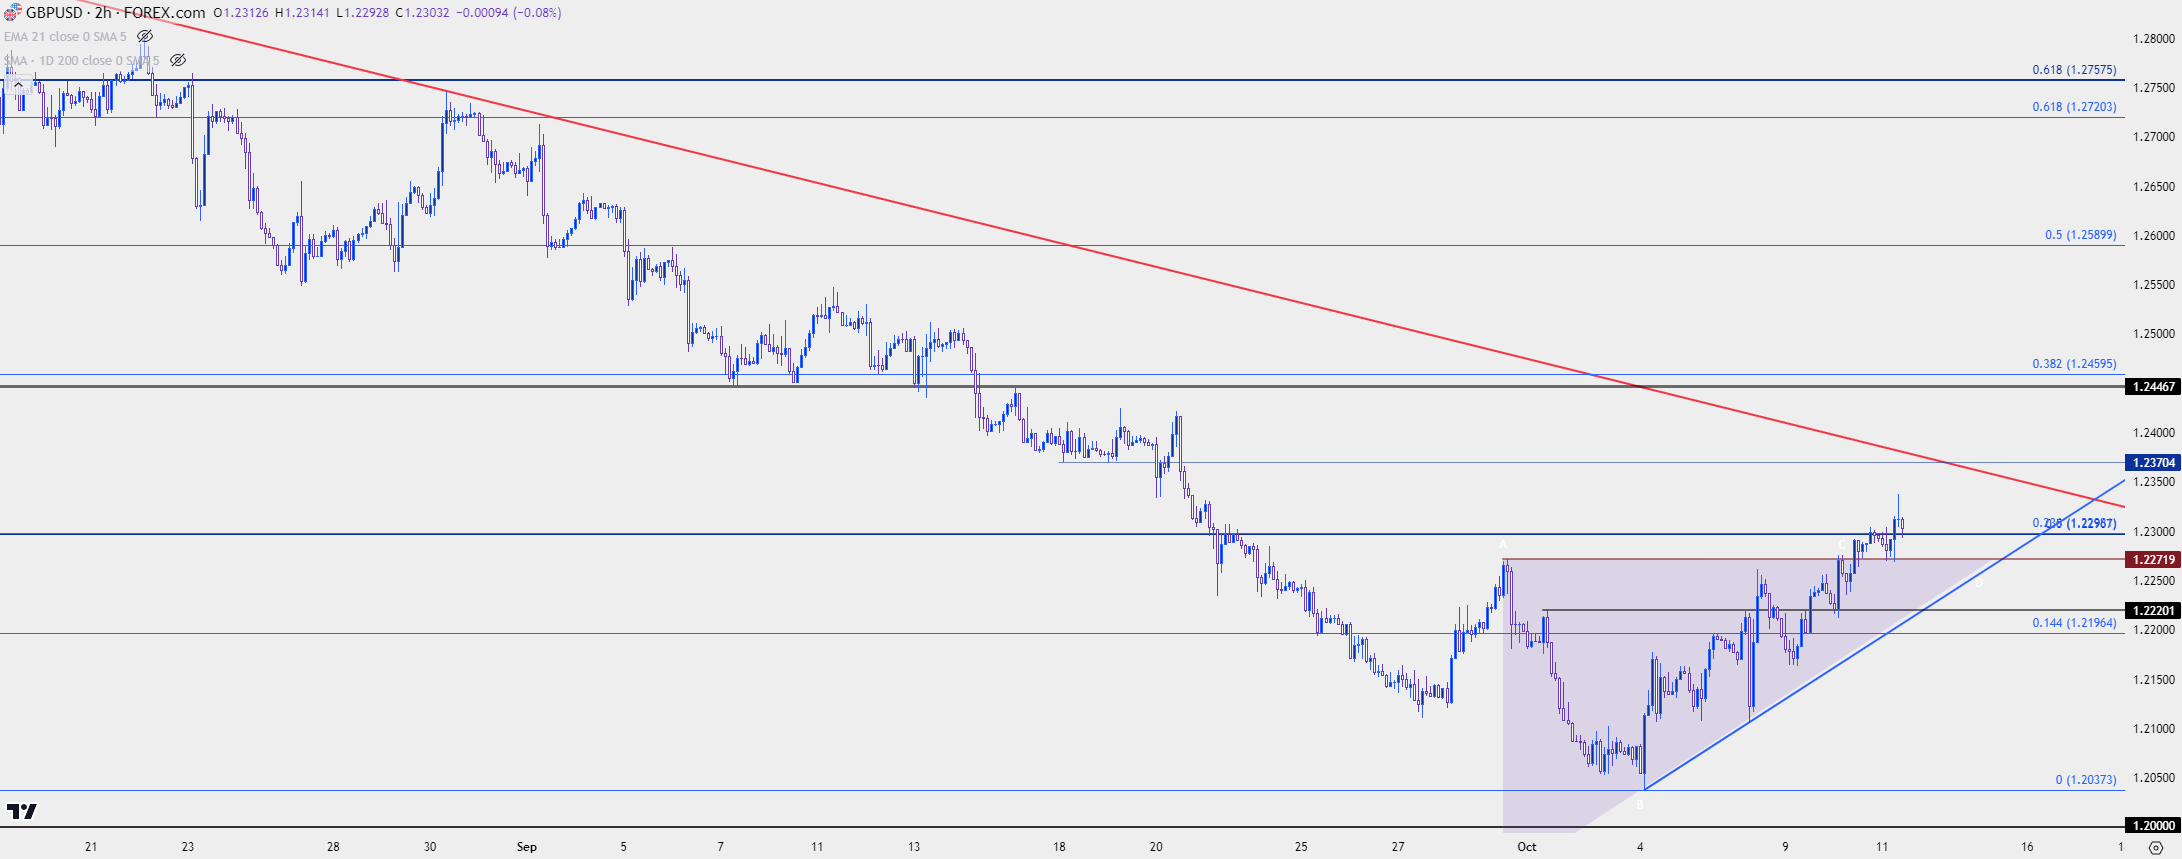
GBP/USD came very close to re-testing the 1.2000 last week before a bounce began to develop. That was tenuous at first, allowing for an ascending triangle to build. We’ve since seen breakout from that formation and prices have set a fresh three-week high.
Short-term price action is showing strength with continued higher-highs and higher-lows, and there’s a trendline sitting overhead along with a prior support swing at 1.2370.
Support is about 100 pips below that level, at the resistance-turned-support swing at 1.2272. If bulls fail to hold that then the breakout attempt will begin to look like a failure, with next support showing around 1.2220.
GBP/USD Two-Hour Price Chart

Chart prepared by James Stanley, GBP/USD on Tradingview
--- written by James Stanley, Senior Strategist


