
US Dollar Talking Points:
- The US Dollar has continued to gain with quite a bit going on last week. The Fed took a tone of data dependency and the ECB sounded more dovish, which has allowed EUR/USD to pullback below the 1.1000 level.
- At this point the breakouts last month in EUR/USD and USD appear to have failed. But, EUR/USD holding supports at 1.0943 could keep the door open for bulls, and if they fail to defend that level, there’s another level of note at 1.0845. In the DXY, bulls have broken above the 101.80-102 zone and that now becomes support potential for short-term bullish trend scenarios.
- This is an archived webinar that we host every Tuesday at 1PM ET. If you’d like to register, it’s free to do so from the following link: Click here to register.
The US Dollar is continuing to show strength after last month’s fast reversal from fresh yearly lows.
As I stated at the beginning of this webinar, this week is where we see how the drivers from last week are absorbed. Similar to the mid-July breakdown in USD and breakout in EUR/USD, the big question is whether bulls show up at higher-low supports to continue the topside move. So far in EUR/USD, that’s been a negative response as price has continued to show short-term bearish pressure.
This raises the question as to whether a larger reversal might be afoot. From the drivers last week, the takeaway was a more-dovish ECB and a data dependent FOMC that’s now looking at above-expectation durable goods and GDP prints. Thursday was especially key as this led to a strong move in a number of markets after that series of drivers availed itself. I talked about that in an article last Thursday that discusses the specific timing of those drivers and the related market impact.
At this stage expectations are low for any additional hikes out of the Fed this year, which was showing at 28.5% during the webinar (screenshot below). Later this week we see Services PMI and Non-farm Payrolls, which can provide more context to the problem.
US FOMC Rate Hike Expectations to December 2023 (per CME Fedwatch)
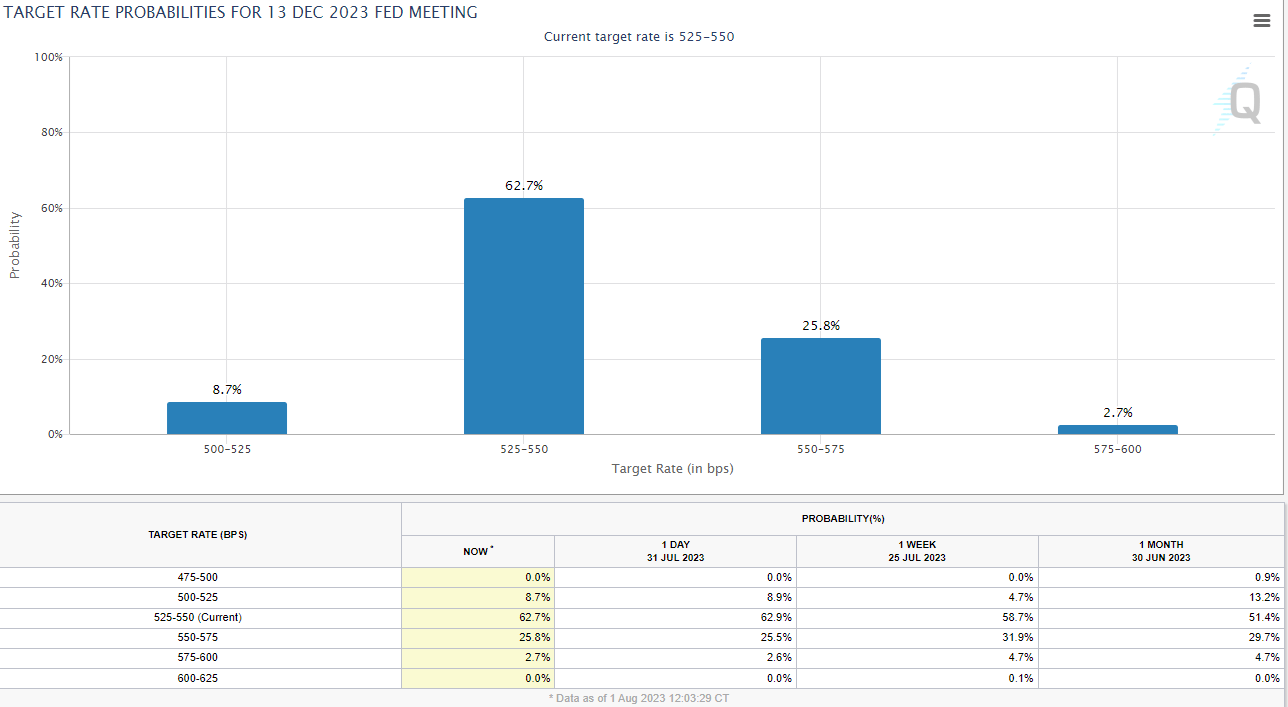 Chart prepared by James Stanley; data derived from CME Fedwatch
Longer-Term Rates
While expectations for another hike from the Fed this year are at a mere 28.5%, longer-term rates have been pushing higher since that Thursday morning outlay. With stronger-than-expected GDP and durable goods, a big push to yields developed after the data was released that pushed 10 year rates back above 4%.
US 10 Year Yields Daily Chart (Indicative)
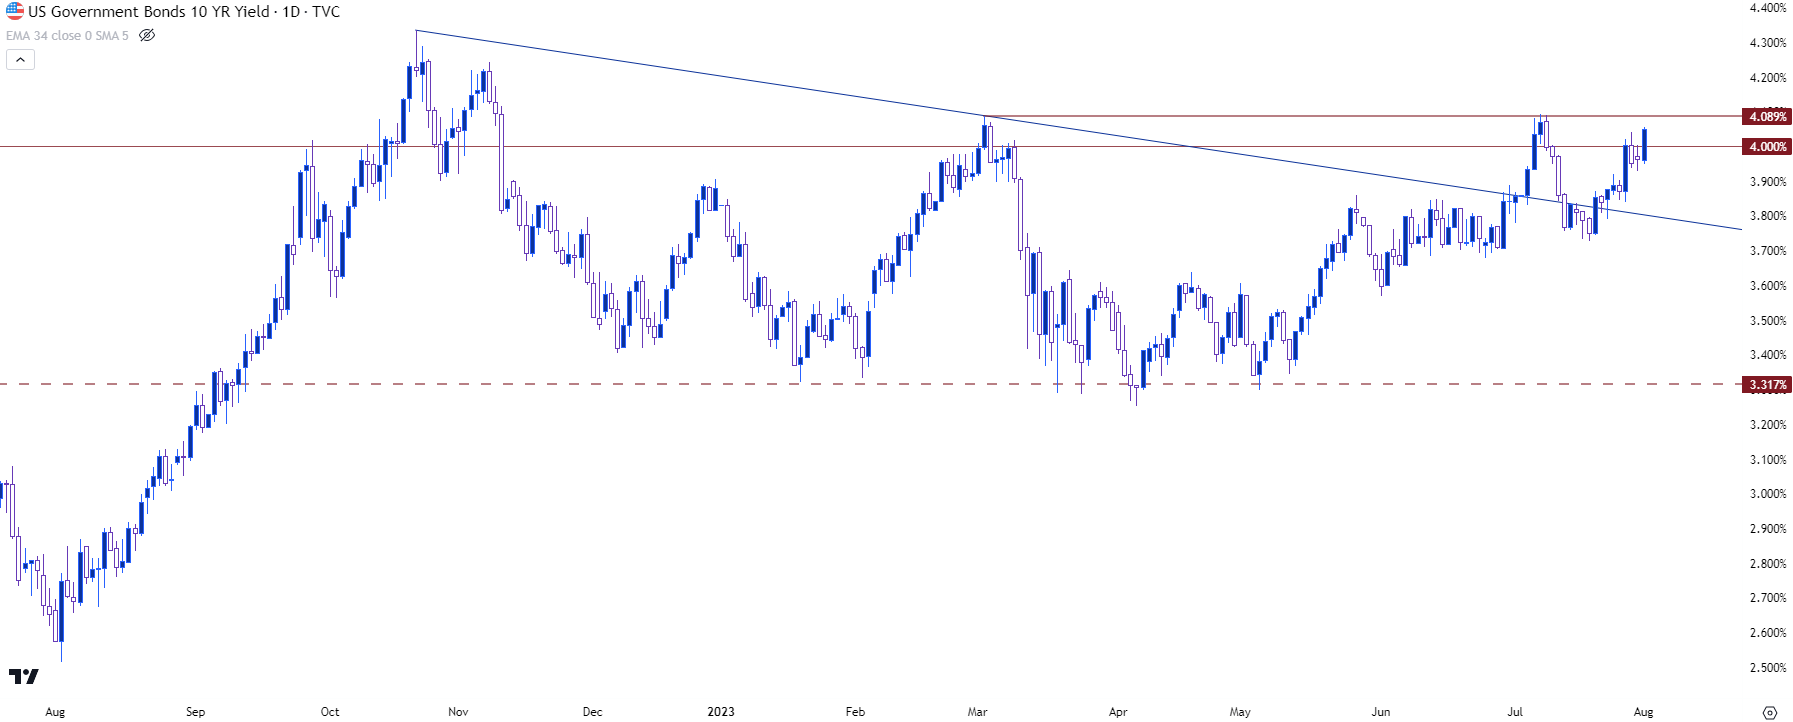 Chart prepared by James Stanley; data derived from Tradingview
US Dollar
As looked at last week, the prior breakdown in the US Dollar that printed after the CPI release in mid-July had pulled back. And price was holding at a key spot when we looked at in last Tuesday’s webinar, which kept the door open for bearish strategies.
That scenario even seemed to play out after the Fed last Wednesday, but that was quickly offset on Thursday morning when a bullish outside bar printed on the daily chart of DXY. The next morning, that advance pushed all the way up to the 102 level, which is a key spot as this was support from June and it’s a confluent Fibonacci level.
This kept the door open for bears into this week’s open, as we had a pullback to a resistance test at prior support, but so far this week bulls are still pushing, and this puts focus on the drivers set to release later this week with Services PMI and NFP. Continued strength in US data could continue to push these bullish trends, especially now that concern has shown around Europe regarding how quickly European data has responded to rate hikes from the ECB.
On a shorter-term basis, bulls holding support at the prior resistance zone of 101.80-102 keeps the door open for short-term trends. Below that, the 101.50 level remains notable and a hold of support there could keep the door open for topside scenarios.
US Dollar - DXY Daily Price Chart (indicative only, not available on Forex.com platforms)
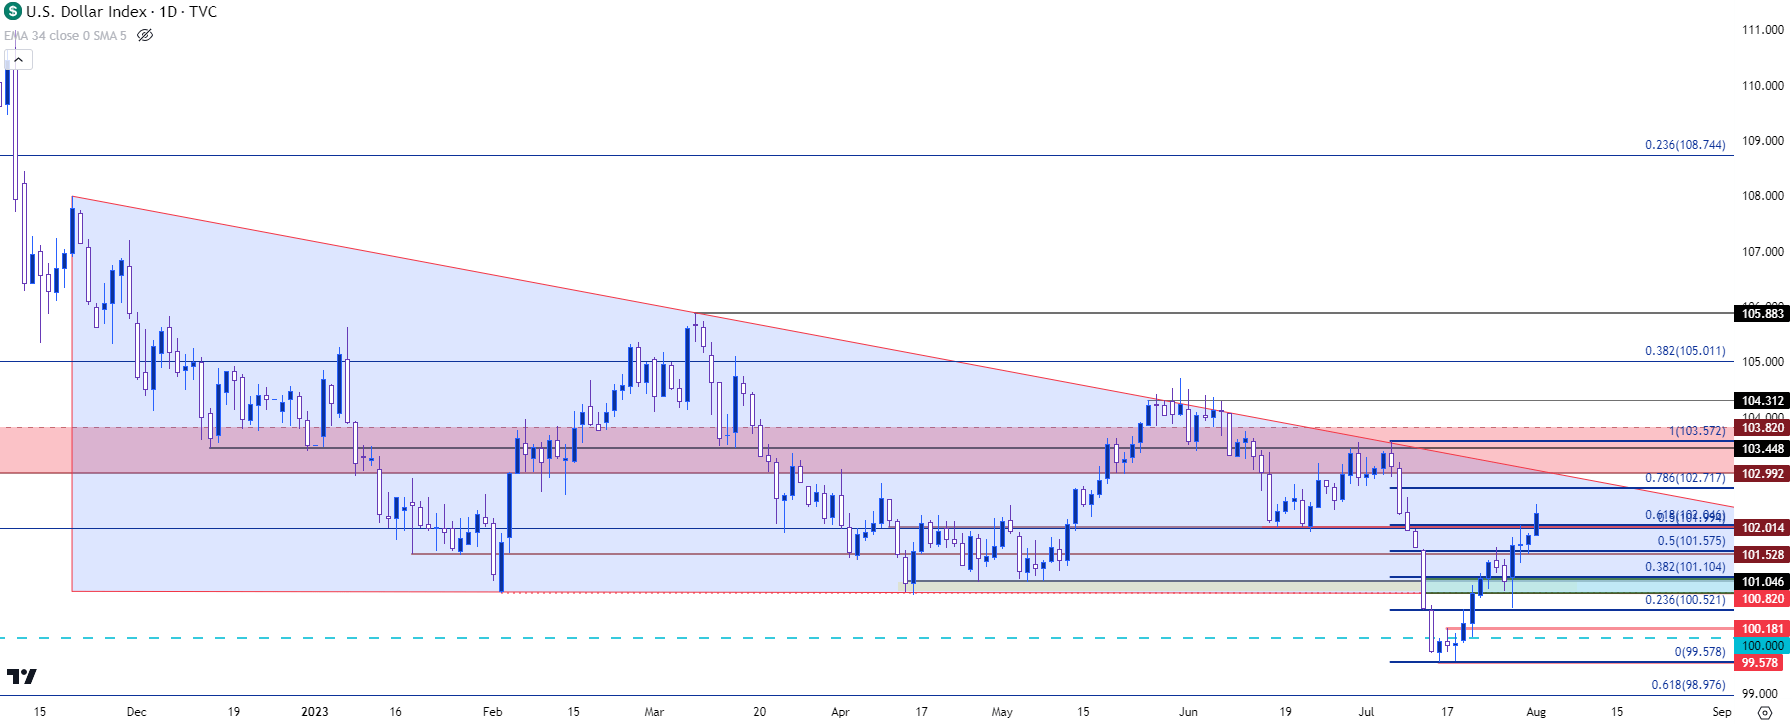 Chart prepared by James Stanley; data derived from Tradingview
EUR/USD
The July monthly bar is now closed for EUR/USD and at this point, the breakout looks like a failure, as shown below.
EUR/USD Monthly Price Chart
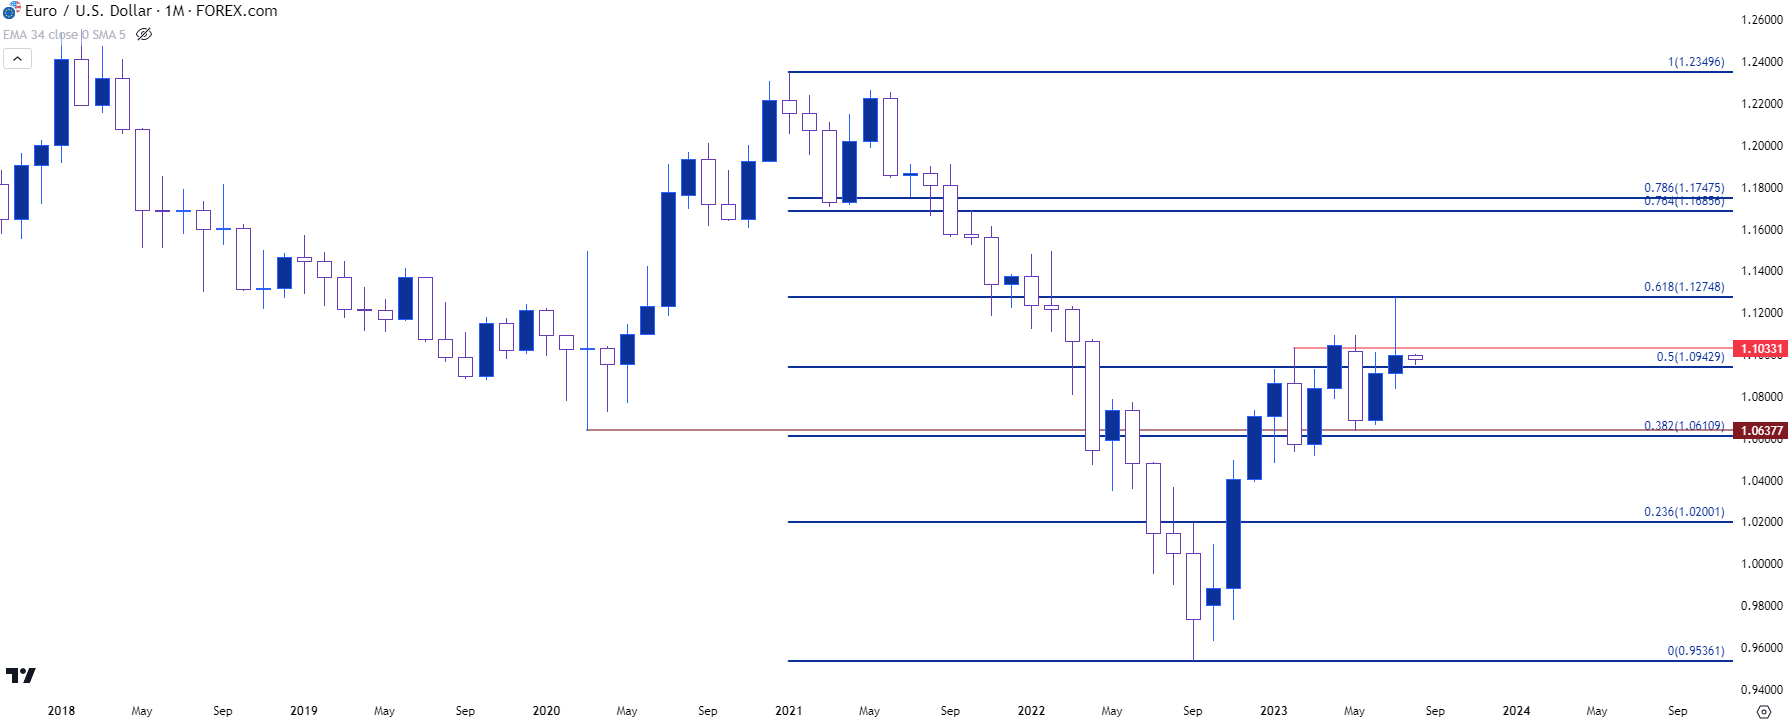 Chart prepared by James Stanley, EUR/USD on Tradingview
On a shorter-term basis, bulls aren’t dead yet as there’s been a hold at higher-low support around a spot of prior resistance. This is the 50% mark from the same Fibonacci retracement from which the 61.8% marker caught the high two weeks ago. The next level of support from the daily chart is around 1.0845, and if bulls can’t defend that, the prospect of bearish longer-term reversal will start to take on more attraction.
The next major spot of support below that is around the 38.2% marker of the same study, which is confluent with the March 2020 swing low at 1.0636.
EUR/USD Weekly Chart
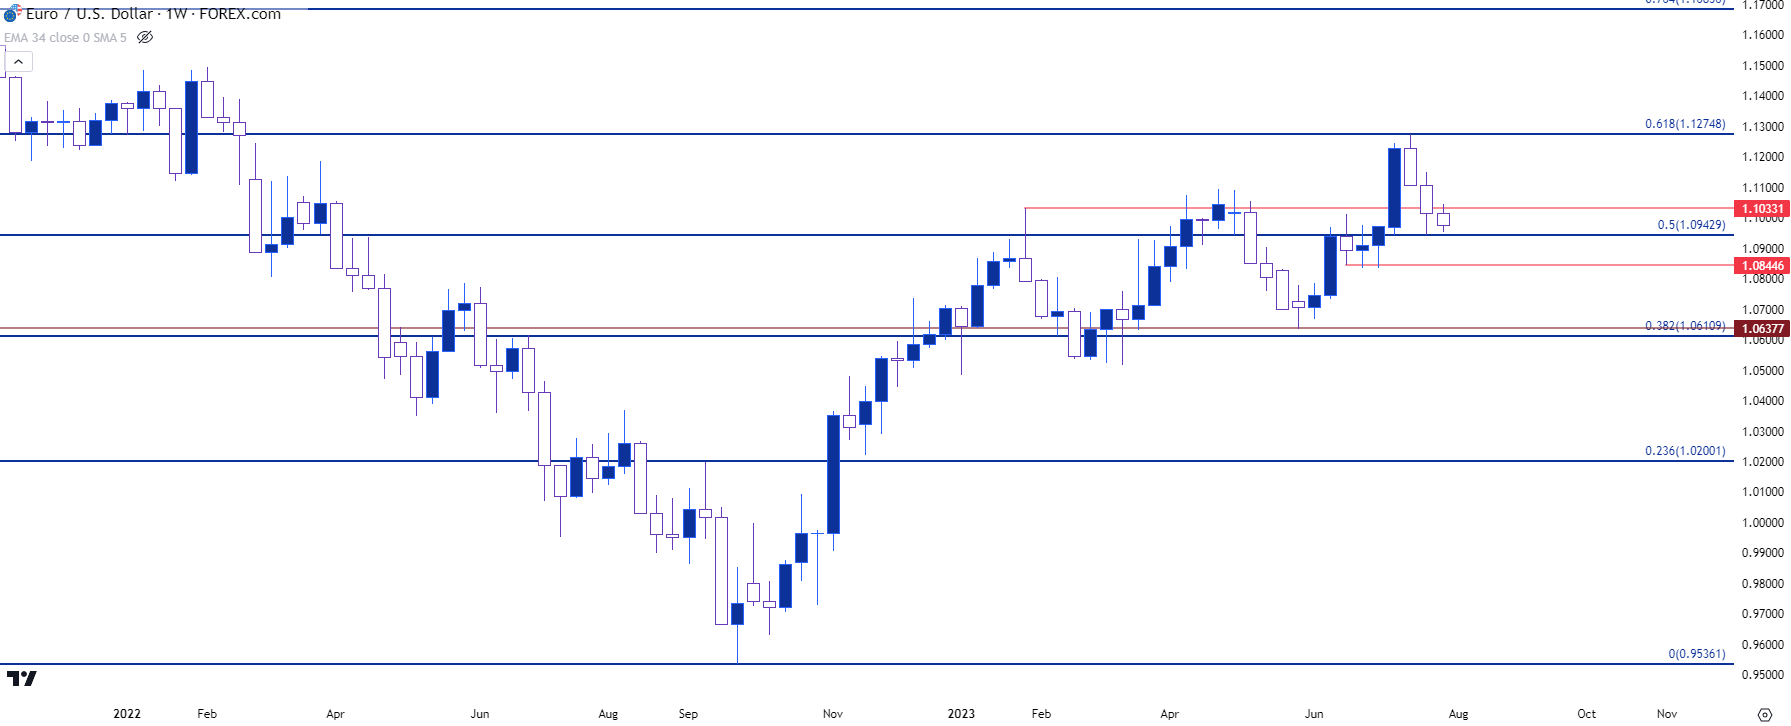 Chart prepared by James Stanley, EUR/USD on Tradingview
USD/JPY
There was also a Bank of Japan rate decision last week, and USD/JPY was extremely messy around that event. First there was a leak ahead of the rate decision that the BoJ was contemplating a tweak to their yield curve control policy. This sparked a run of Yen-strength as traders were apparently expecting that to lead to a larger policy shift.
That did not happen, however, and BoJ Governor Kazuo Ueda even said that he BoJ could do more stimulus if needed at the rate decision later that night. In response, Yen trends have come roaring back and USD/JPY is now working on its third consecutive day of considerable strength.
The quandary here may soon be the same that we saw in late-June, when USD/JPY was beginning to re-test the 145 level. This is where intervention fears began to come back into the equation and this led to a strong reversal in the pair that held through the July release of US CPI data, with the pair eventually setting a low at a key level of support around 137.68. In the webinar, I shared some context for shorter-term support potential as taken from a Fibonacci retracement.
USD/JPY Daily Price Chart
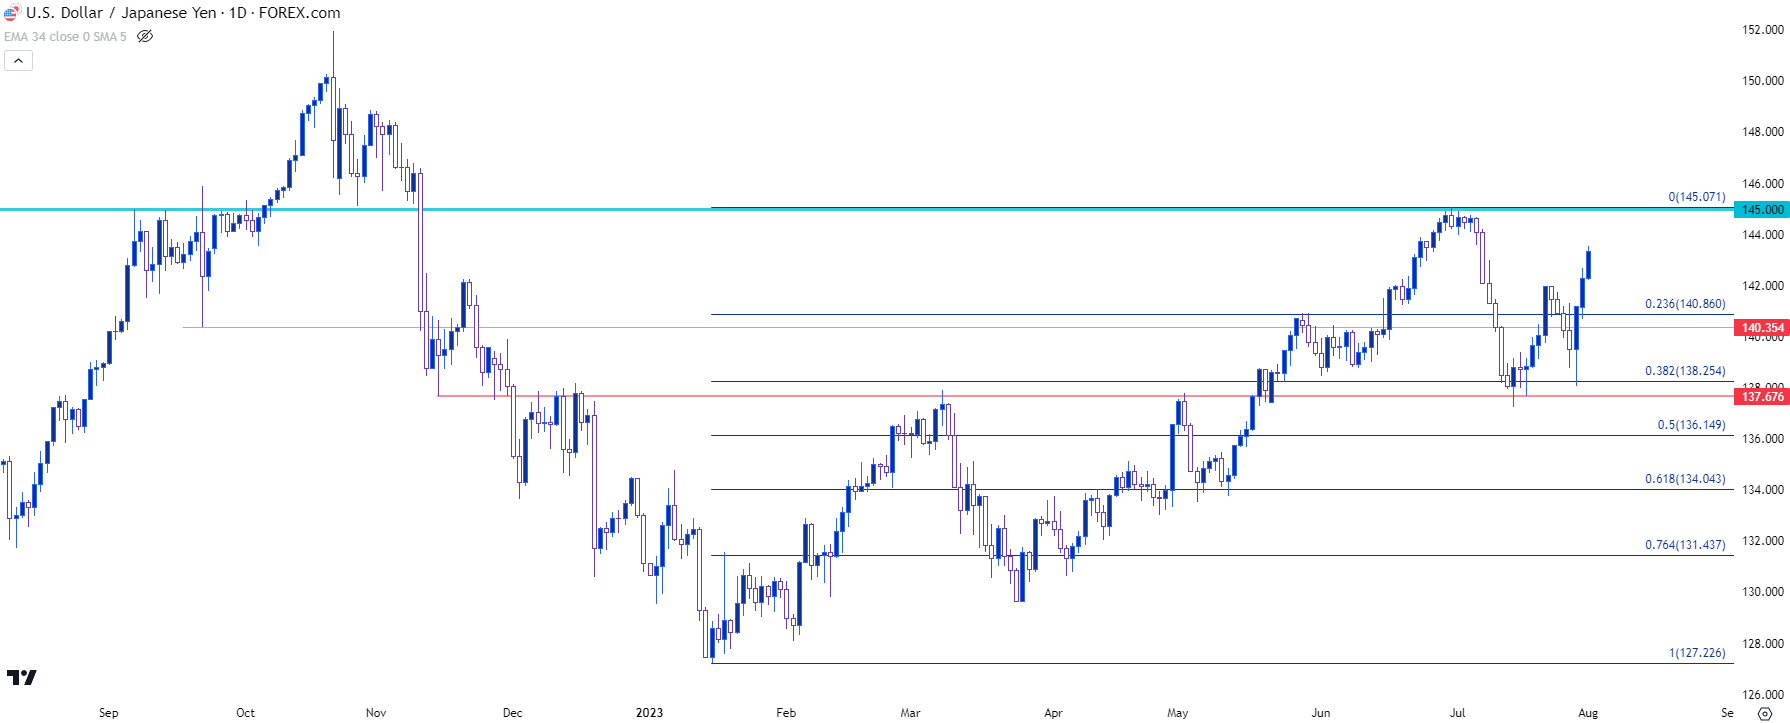 Chart prepared by James Stanley, USD/JPY on Tradingview
GBP/USD
The Bank of England hosts a rate decision this Thursday, and it’s a Super Thursday event so we’ll also get updated guidance and projections.
GBP/USD was previously one of the stronger majors and the BoE’s rate hike in June surprised, as they were expected to hike by 25 bps and instead pushed a 50 bp move. Inflation remains brisk in the UK, with the most recent CPI print showing core inflation at 6.9% and headline at 7.9%. This was a bit below expectations, however, and this led to GBP/USD weakness that still hasn’t quite recovered.
At this point, GBP/USD is testing below a longer-term trendline, and there’s another major spot of support a little lower, around 1.2667, which held two separate inflections about a year apart from each other. And, notably, there hasn’t yet been much for support off of that level. This sets for an interesting stage around that rate decision on Thursday, and for those looking to fade this recent run of USD-strength, GBP/USD may be an option given current macro context.
GBP/USD Daily Price Chart
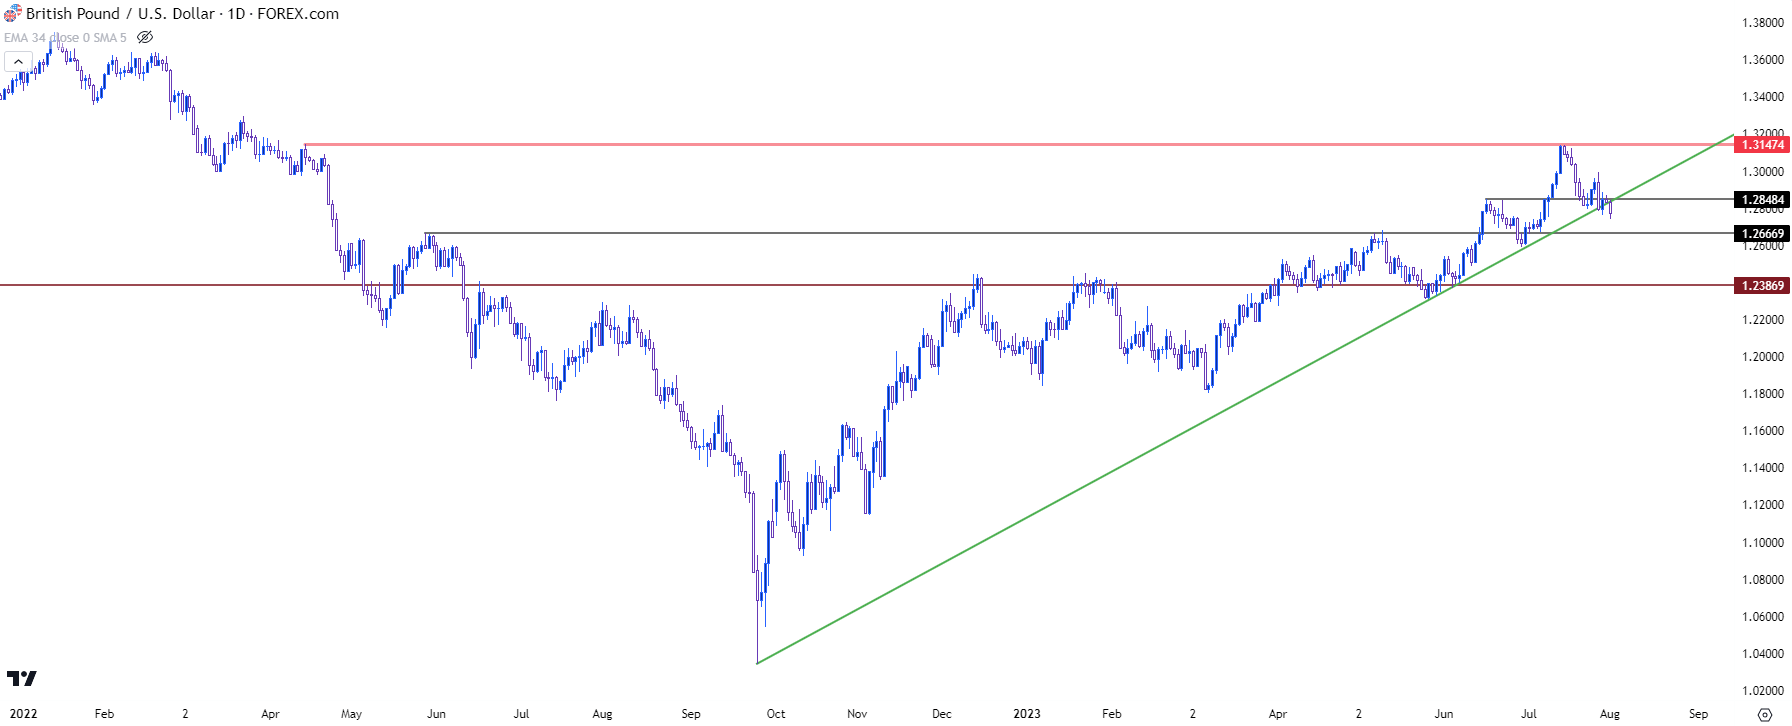 Chart prepared by James Stanley, GBP/USD on Tradingview
USD/CAD
USD/CAD is interesting as the pair remained subdued through much of last week’s fireworks. As I’ve been discussing on the pair of late, I’m tracking this as a shorter-term range inside of a longer-term range.
The shorter-term range began to breach in June, but sellers didn’t get very far, and from the weekly chart below we can see numerous tests below 1.3150 but none of which could hold. This allowed for a falling wedge to build, and buyers have recently started to force a topside break above that formation. The next spot of resistance is the Fibonacci level around 1.3338, after which the 1.3403 level comes into the picture.
USD/CAD Weekly Price Chart
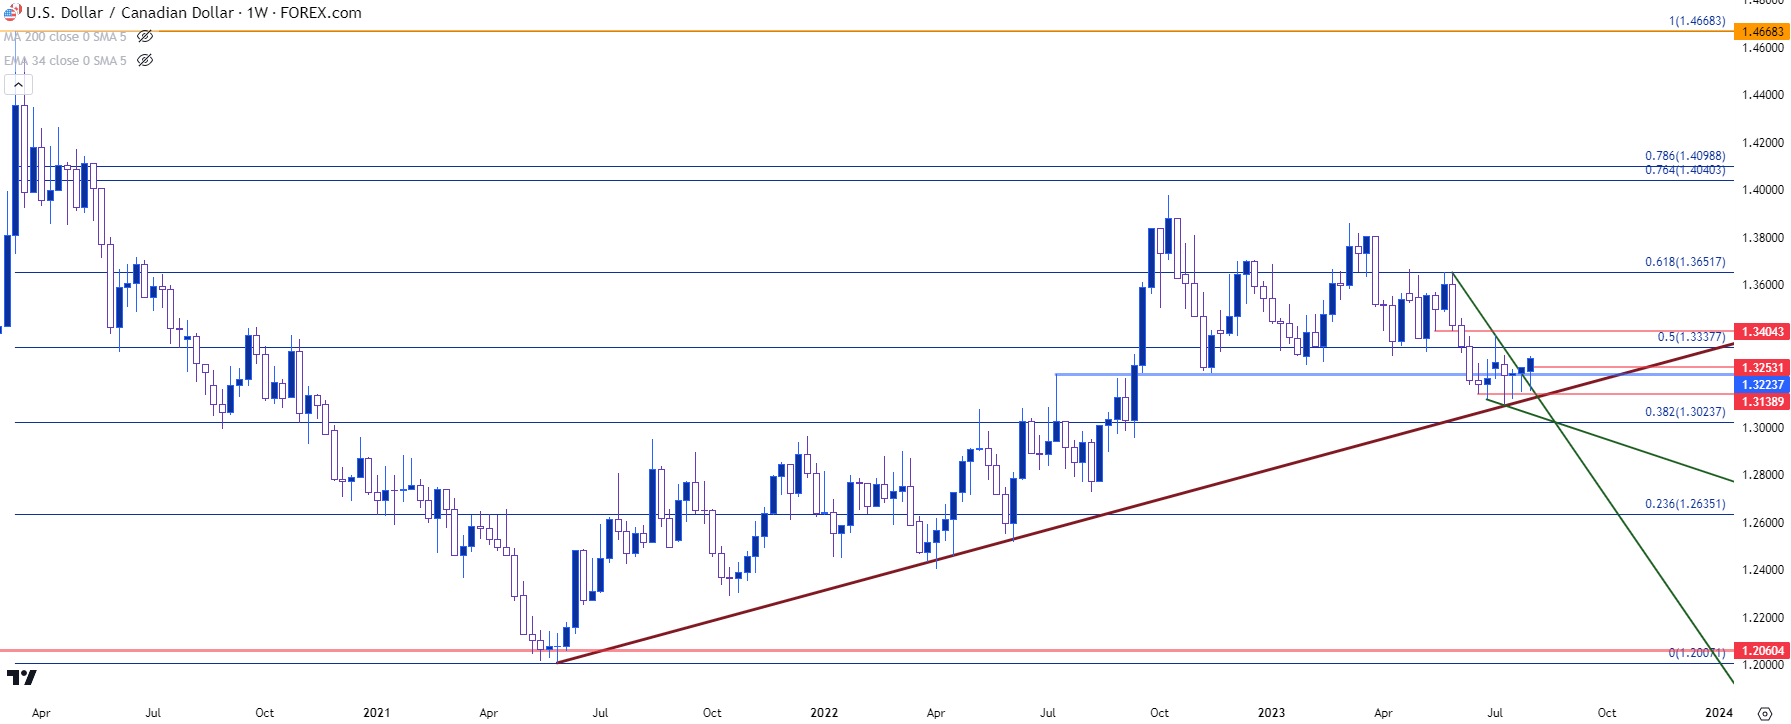 Chart prepared by James Stanley, USD/CAD on Tradingview
--- written by James Stanley, Senior Strategist


