
US Dollar Talking Points:
- The USD extended its decline last week after CPI numbers were released on Wednesday. But interestingly, bears haven’t been able to show much extension in the sell-off yet and bulls have pushed price back above the 200-day moving average.
- From the daily, there does remain bearish potential but from shorter terms, that bearish argument gets less attractive as there’s been a recent higher-high to go along with a possible higher-low.
- I’ll be discussing these themes in-depth in the weekly webinar. It’s free for all to register: Click here to register.
The US Dollar was smashed last Wednesday after the release of US CPI. Core CPI printed at a three-year-low and this quickly excited the rate cut crowd, and that really extended a story that’s been prevalent for all of May so far.
The FOMC rate decision on May 1st saw the Fed retain a somewhat dovish lean. And then two days later Non-Farm Payrolls was released to its first below-expected headline print since last November. This gave hope that the Fed’s continued dovishness would lead to rate cuts later in the year, and that theme got another shot-in-the-arm last Wednesday on the back of the CPI print.
But – 3.6% for Core CPI is still very elevated and the pattern of weakness in both employment and inflation was strong until these two pieces of data illustrated some level of progress towards the FOMC’s dovish posture.
Interestingly – after the Wednesday sell-off, USD strength has been attempting a comeback. Last Wednesday was the first day that DXY closed below its 200-day moving average since March – and it didn’t last for long as bulls jumped in to push back above the moving average a day later. And since then, there’s been a continuation of that strength.
From the four-hour chart below, we can see a higher-high that’s led into what could be a higher-low as bulls have grinded price back above the 200-dma.
US Dollar Four-Hour Price Chart
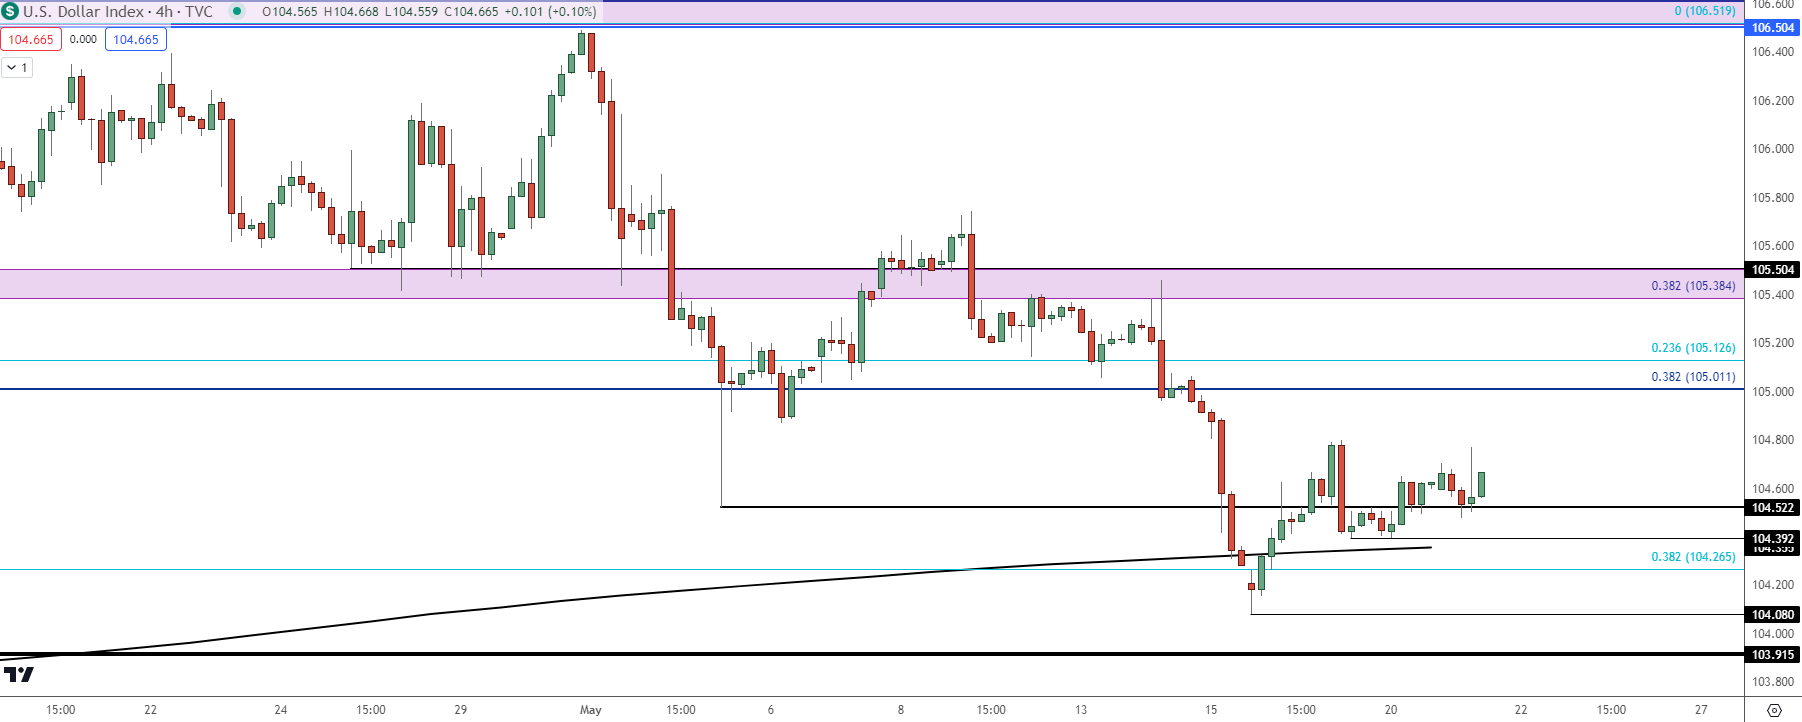 Chart prepared by James Stanley; data derived from Tradingview
US Dollar Daily
From the daily chart there could still be a bearish case argued as the lower-low from last Wednesday continued the sell-off move and, as yet, price is still treading below prior support which could substantiate a lower-high. This puts focus on the 105.01-105.13 zone, followed by the 105.38-105.51 zone.
If bulls can take those two zones out, then the near-term bullish look investigated above would align with the intermediate-term trend, which would set up a date for a re-test of the 106.50 level that had built a double top formation that completed last week on the CPI plunge in DXY.
US Dollar Daily Price Chart
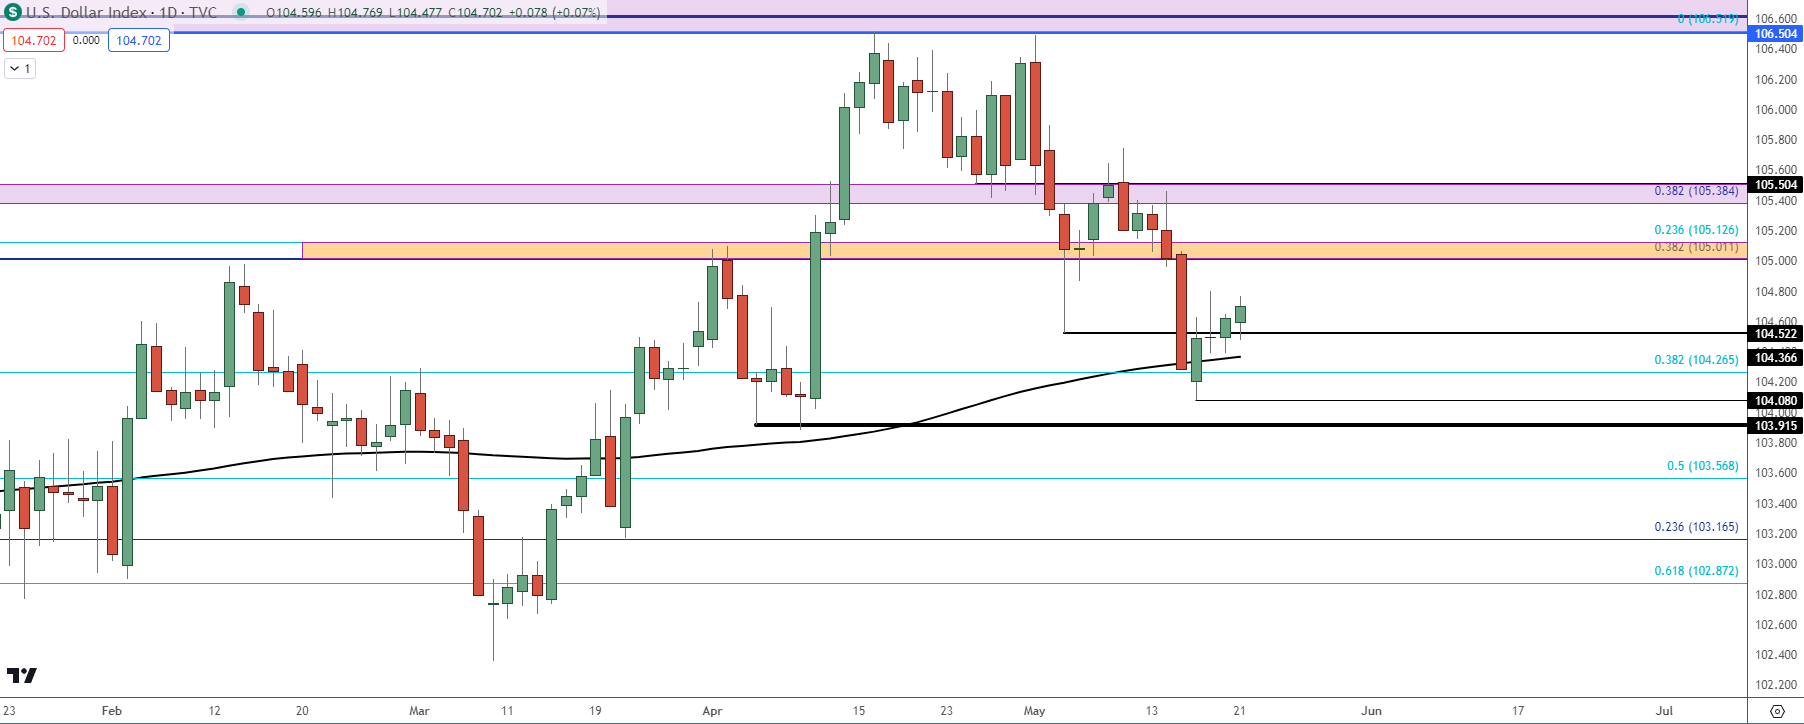 Chart prepared by James Stanley; data derived from Tradingview
EUR/USD
At this point, both EUR/USD and the US Dollar via DXY are trading above their 200-day moving averages. This is unlikely to remain the case for long and that’s simply math, considering that the US Dollar is the denominator of the EUR/USD quote.
As I had looked at last week, bulls were pushing EUR/USD above the 200-dma at the time and that led to a strong breakout a day later after the release of CPI. That pushed price right into the 1.0870-1.0877 zone and since then, the move has stalled.
It can be simple to look at such a situation as bearish given that bulls haven’t been able to extend the move; but the other side of that is that EUR/USD has been sitting perched near resistance for almost a full week since that CPI breakout, and still bears haven’t been able to re-take control. This puts focus on a few levels below current price, at 1.0835 and then 1.0807, after which the 200-dma comes back into play which currently plots around the 1.0790 level.
Sitting atop price is a Fibonacci level related to the 1.0611 level that caught the lows in April, and that price of 1.0943 is the 50% mark of the same retracement. It had also carved out highs in March so if bulls can extend the advance, that becomes the next operable area of resistance potential. And above that is the 1.1000 big figure that traded twice in the first week two weeks of the New Year and hasn’t been back in-play since.
EUR/USD Daily Price Chart
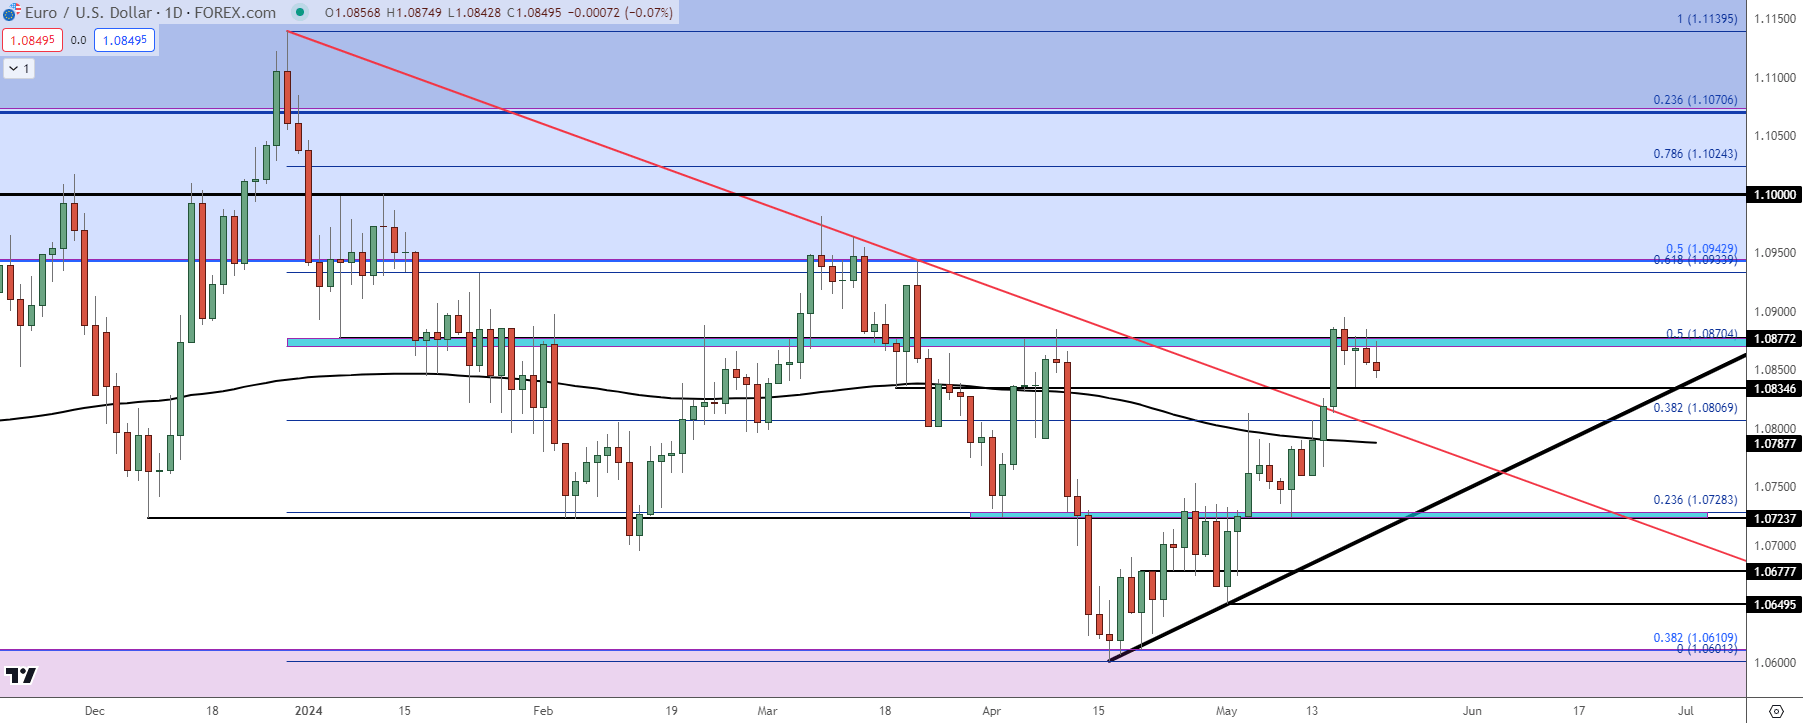 Chart prepared by James Stanley, EUR/USD on Tradingview
GBP/USD
GBP/USD remains as an attractive setup on the bearish side of the US Dollar, and there could be a greater case for bullish continuation here than what was looked at above in EUR/USD.
While EUR/USD currently postures below the high set last Wednesday, GBP/USD has had some additional bullish build. If the USD sell-off does extend, the topside of Cable could remain as interesting. At this point there’s an attempt to hold support at a prior point of Fibonacci resistance, which plots at 1.2692. Below that is another zone of interest, spanning from 1.2635-1.2644. Above current price, the 1.2750 psychological level remains if interest for follow-through strength, after which there’s some reference around the 1.2800 handle.
GBP/USD Daily Price Chart
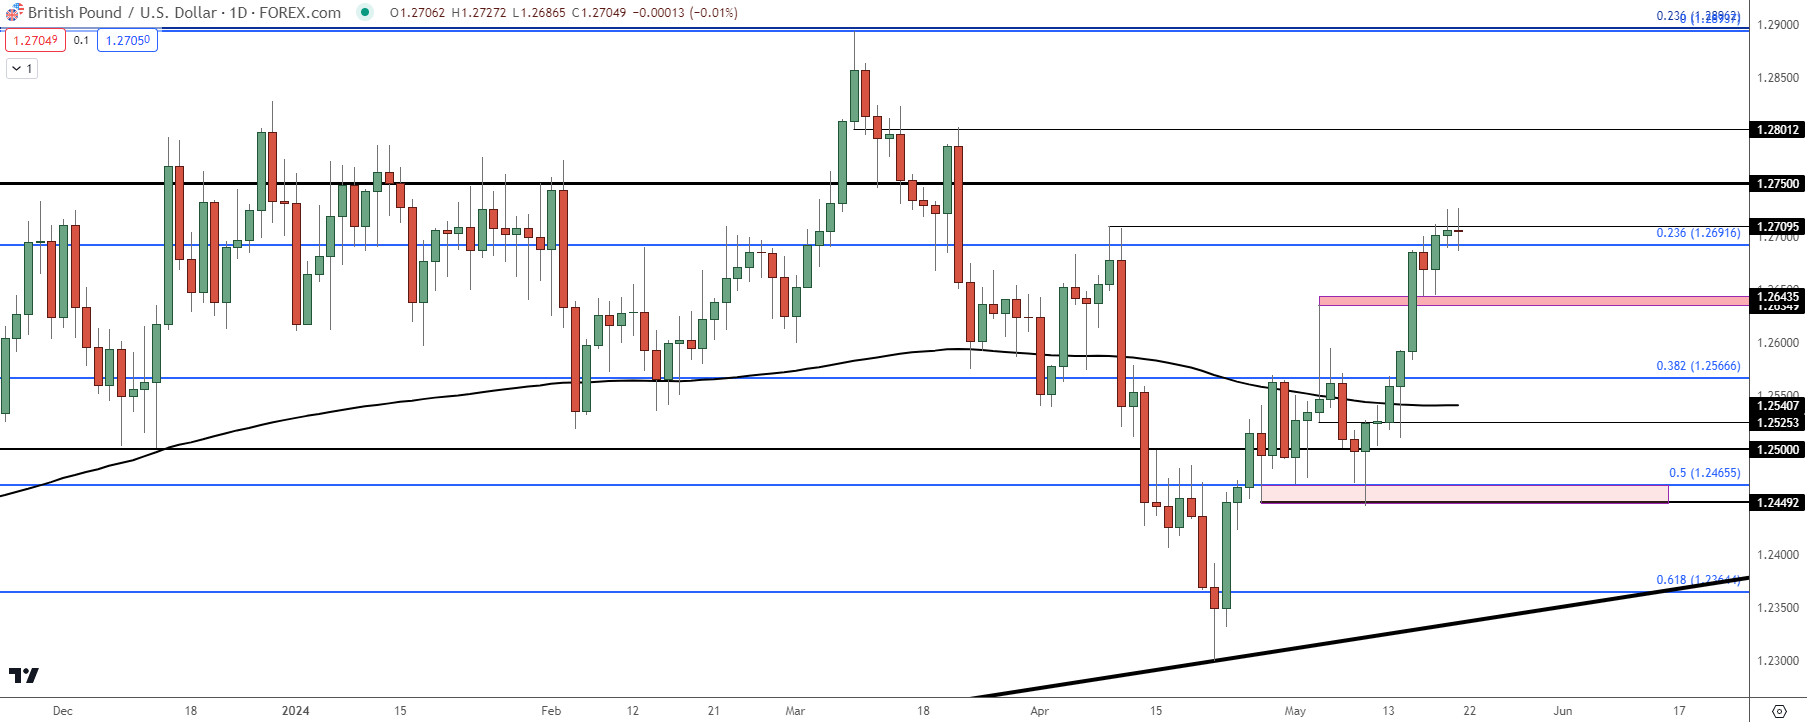 Chart prepared by James Stanley, GBP/USD on Tradingview
USD/JPY
I expect USD/JPY to continue to trade like an ‘amplified USD,’ and I went through the rationale for that in the webinar. In short, with themes of USD-weakness, carry traders could become increasingly frightened of getting caught in a pullback, which could bring on selling in the elongated bullish trend. This is similar to, albeit a more concentrated version of what led to reversals in Q4 of the past two years.
But, if USD strength can hold on, the carry on the long side of the pair remains attractive and it seems that the only item to be afraid of for bulls, at least in the near term, is another round of intervention from the Bank of Japan.
So, for scenarios of USD-strength, the positive carry on the long side and the negative carry on the short side could continue to push bullish trends. And if USD-weakness takes over, then carry traders could be compelled to take profits, leading to an even more aggressive sell-off backdrop in USD/JPY.
That math could change a bit as we near a re-test of the 160.00 handle, but with price well below as of this writing, the rollover relationship could continue to drive topside flows in the pair.
USD/JPY Daily Price Chart
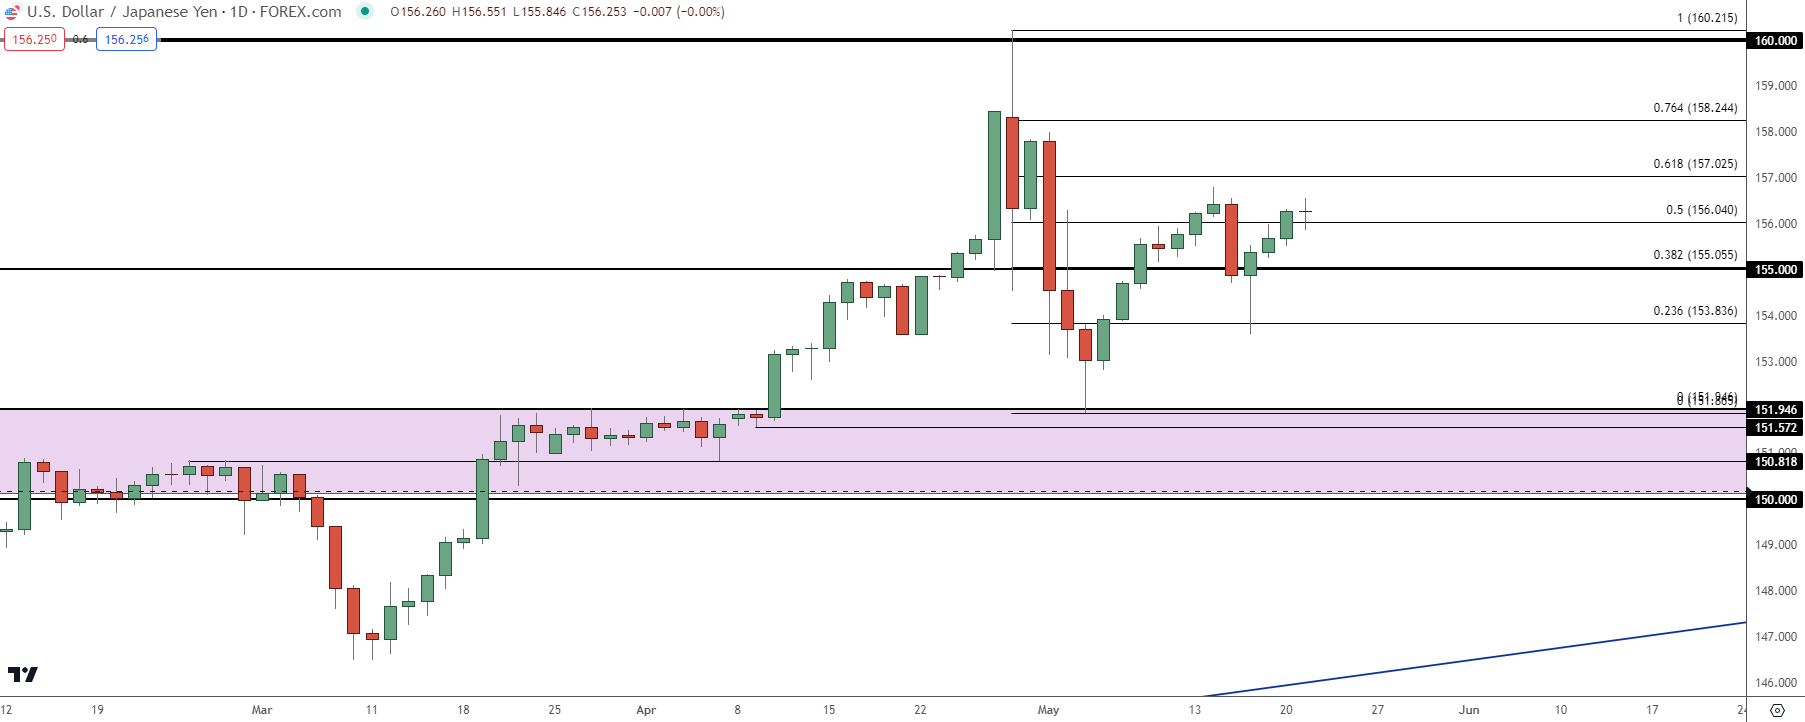 Chart prepared by James Stanley, USD/JPY on Tradingview
Gold (XAU/USD)
I led off the webinar with Gold and there’s an excellent example of price action in use as price was trying to form a breakout beyond the 2431 level. This runs for the first 10 minutes or so of the webinar included above.
Bulls have put on quite the show here over the past few weeks, and I think there’s a decent probability that they’re not done yet. It was shortly after the weekly open that bulls prodded a push up to the 2450 level, at which point a pullback developed. That didn’t last for long, however, as bulls came in around 2407 and pushed a move of more than $30.
That led to another pullback but, again, bulls defended 2407 which showed an unwillingness to even allow a 2400 re-test. That led to another jump up to the 2431 level, which was the ATH set in April.
When I started the webinar price was putting in another 2431 test, but there was also a series of upper wicks on 30-minute candles, and that led to a fast pullback to 2417. That level has since been supported and this keeps the door open for bulls to take another shot at taking over the intermediate-term trend.
Gold (XAU/USD) Hourly Price Chart
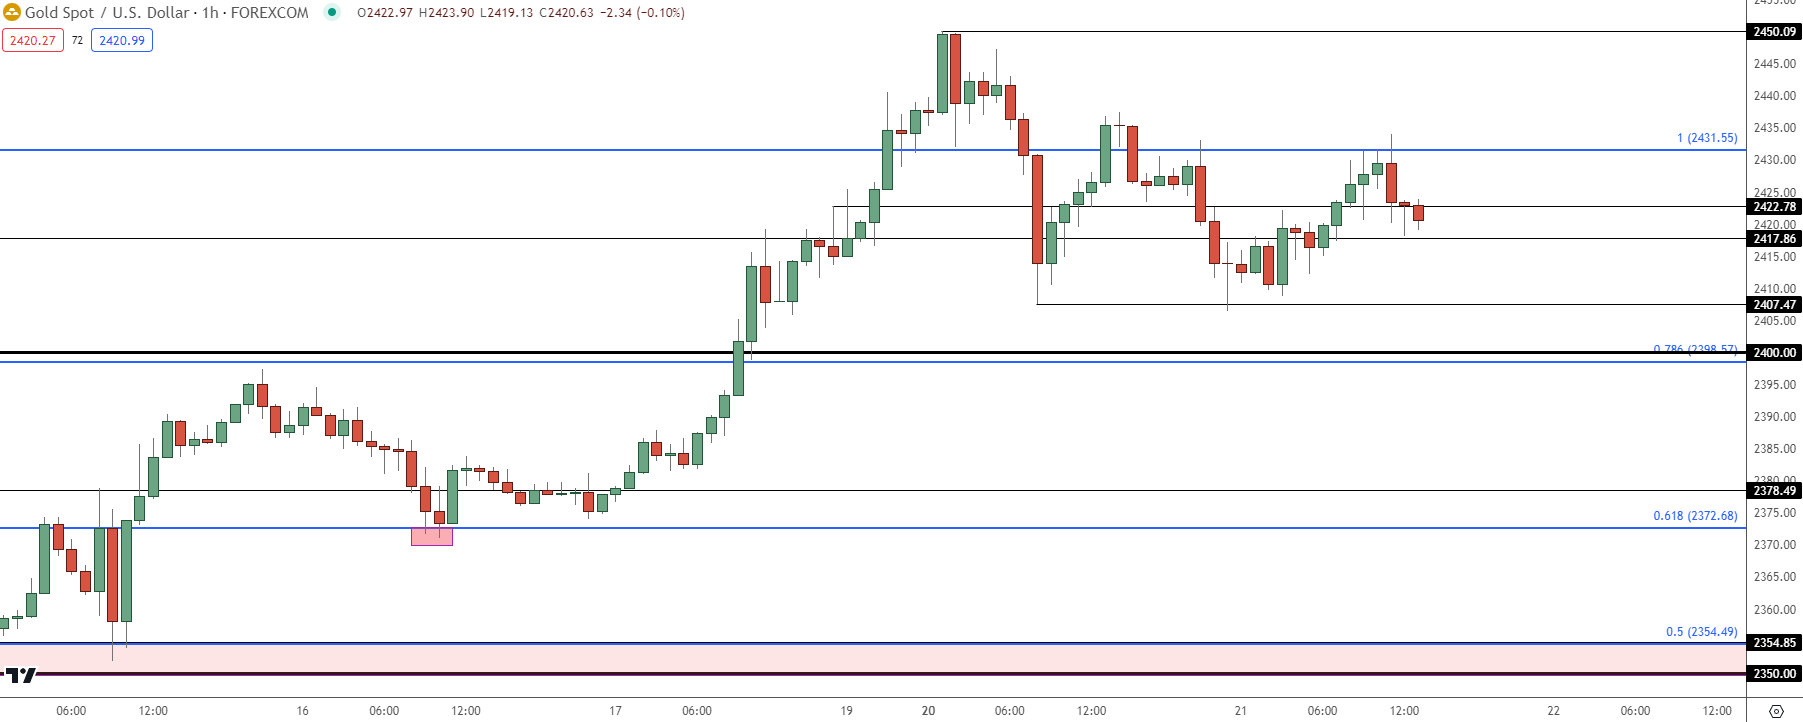 Chart prepared by James Stanley, Gold on Tradingview
--- written by James Stanley, Senior Strategist


