
U.S. Dollar, EUR/USD, USD/JPY Talking Points:
- The U.S. Dollar put in a strong move on the back of the CPI print this morning.
- EUR/USD plunged down towards 2024 support and USD/JPY broke out from the 151.95 level that’s held the highs for the past two years. The ECB rate decision tomorrow looms large for directional cues around the U.S. Dollar.
- The Trader’s Course has been released, and is available from the following link: The Trader’s Course
- I’ll be discussing these themes in-depth in the weekly webinar. It’s free for all to register: Click here to register.
The stage is set for Christine Lagarde and the European Central Bank tomorrow morning. The U.S. Dollar put in a strong run to a fresh 2024 high after the release of U.S. CPI earlier this morning, which, again, printed above expectations.
U.S. Core CPI has now spent seven consecutive months within a 0.2% band of the 4% level; and for the past four months that data point has come out above expectations. This, combined with a strong labor market as seen at last week’s NFP report, makes for a difficult backdrop for the Fed to justify rate cuts. Until this morning there was still the expectation from both the Fed and market participants that there would be three 25 bp cuts in 2024 – and that is now in question.
U.S. Core CPI Since January of 2024 – Stabilizing Near 4%
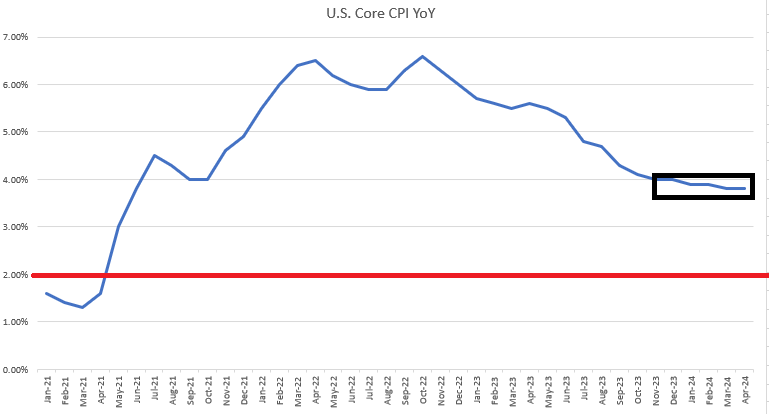
Chart prepared by James Stanley
I looked into this during yesterday’s webinar, highlighting how rate expectations remained very dovish, all factors considered. With CPI remaining strong markets have now priced-out a cut for June and the expectation into the end of the year has whittled down to two from the prior read of three.
As of this writing, the probability of three cuts or more is down to 19.8% whereas it was 55.4% yesterday. And the odds for one or more cuts in June is down to 17.9% compared to yesterday’s 57.4% probability.
FOMC Rate Probabilities into End of 2024
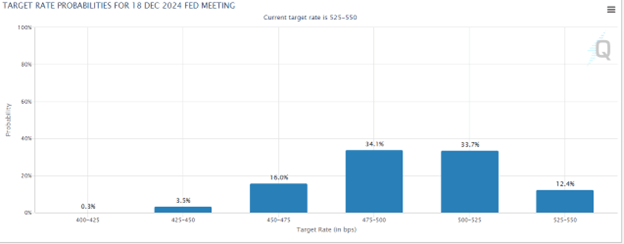
Chart prepared by James Stanley; data from CME Fedwatch
Rate Expectations Shift – Stocks Sell-Off, U.S. Dollar Breaks Out
I had published an article on Fundamental Analysis last week and in that piece, I had highlighted the important conduit of interest rates for the manifestation of economic data. This morning is a great example as another illustration of above-expectation inflation has impacted rate probabilities around the Fed – and that has, in-turn, created a variety of moves in numerous markets.
If you’d like to read more about my take on the pullback in equities, I had written the Q2 Forecast for Equity Indices, and you can download that from the link below:
U.S. Dollar
The more notable move so far today has been the breakout in the U.S. Dollar, which was finally able to trade above the 105.00 figure in DXY. That level had held two different resistance inflections over the past two months and interestingly, the first showed just after the CPI print in February. But it was just a day later that Chicago Fed President Austan Goolsbee said that market participants shouldn’t get ‘flipped out’ by the data and then the USD went into a pullback that ran all the way until the NFP report in early-March.
I had looked into this in yesterday’s webinar as the second test of that resistance had, so far, held a higher-low in the 103.98-104.21 zone. And as I shared in that session, the third test of that resistance zone could see a different result such as what’s played out so far.
The big question now is whether bulls can hold the move and given the prior resistance at 104.77-105.00, there’s a nearby zone for that to be followed. Reasonably there could remain a bullish bias even on a test below that level, as the prior higher-low is down around 104.00 and this highlights areas such as 104.70 or 104.38 that could be amenable for such a purpose.
Given the incredibly large allocation of the Euro in the DXY quote, this matter will likely see some drive from the European Central Bank rate decision tomorrow morning. So far, the ECB has refrained from going extremely-dovish and if they can successfully thread that needle again tomorrow, this could further support the pullback thesis. The bigger question is how market participants will react, and I’ll look into that deeper in the EUR/USD section below.
U.S. Dollar Daily Price Chart
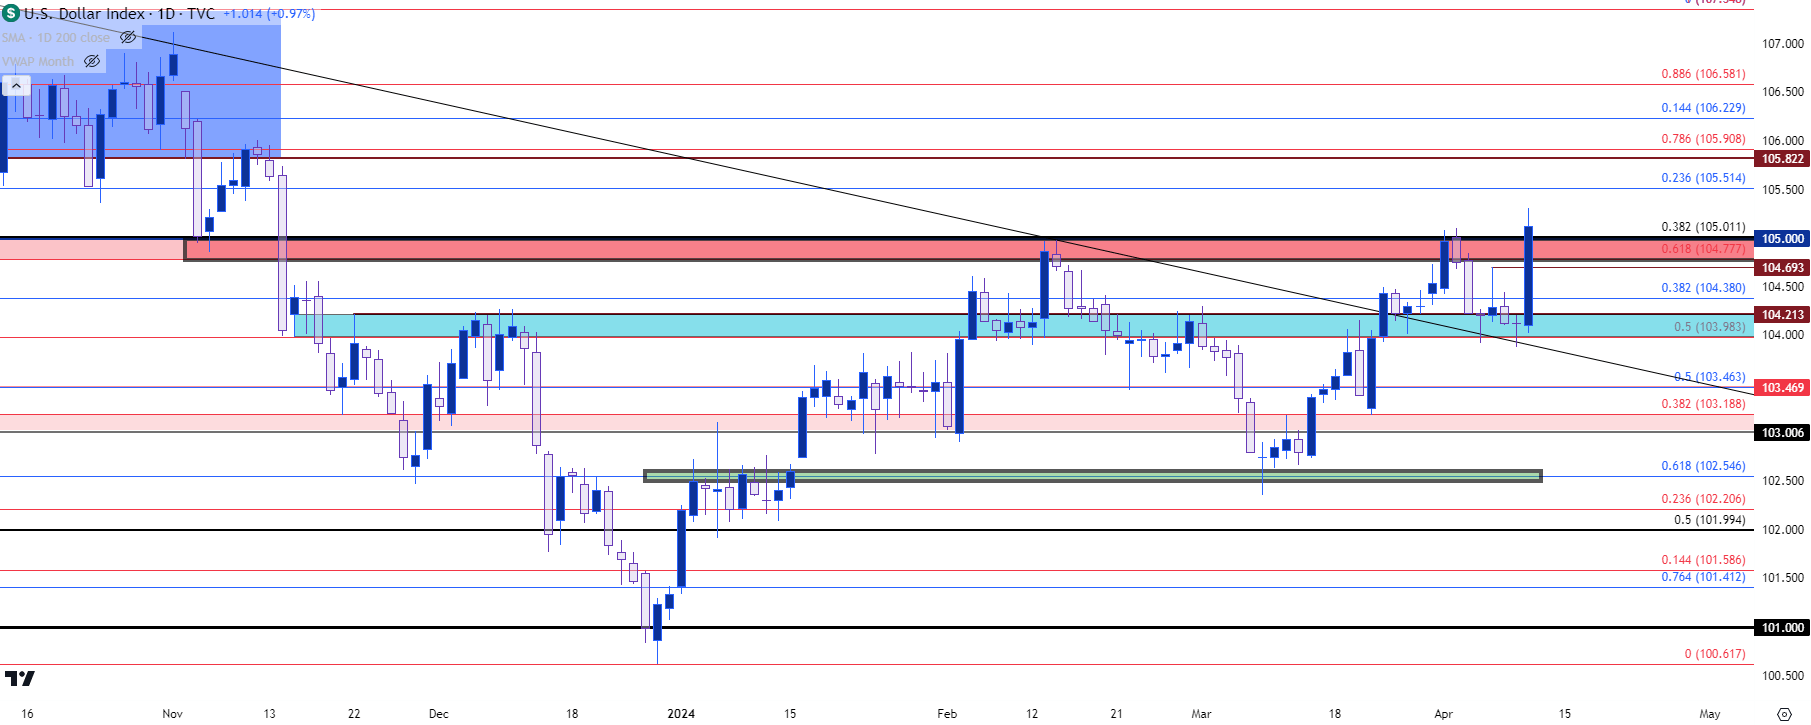 Chart prepared by James Stanley; data derived from Tradingview
USD Longer-Term
Taking a step back to the weekly chart and the current support zone can be seen as important to the bigger picture. The lows over the past three weeks have all held support around a trendline projection taken from the 2022 and November 2023 swing highs.
For reference, there’s also a long-term Fibonacci level plotted at 106.61 which helped to set resistance in the Dollar last year from September into November, around the time the Fed started to get very dovish.
That same trendline came into play yesterday as DXY printed a doji on the daily chart.
U.S. Dollar Weekly Price Chart
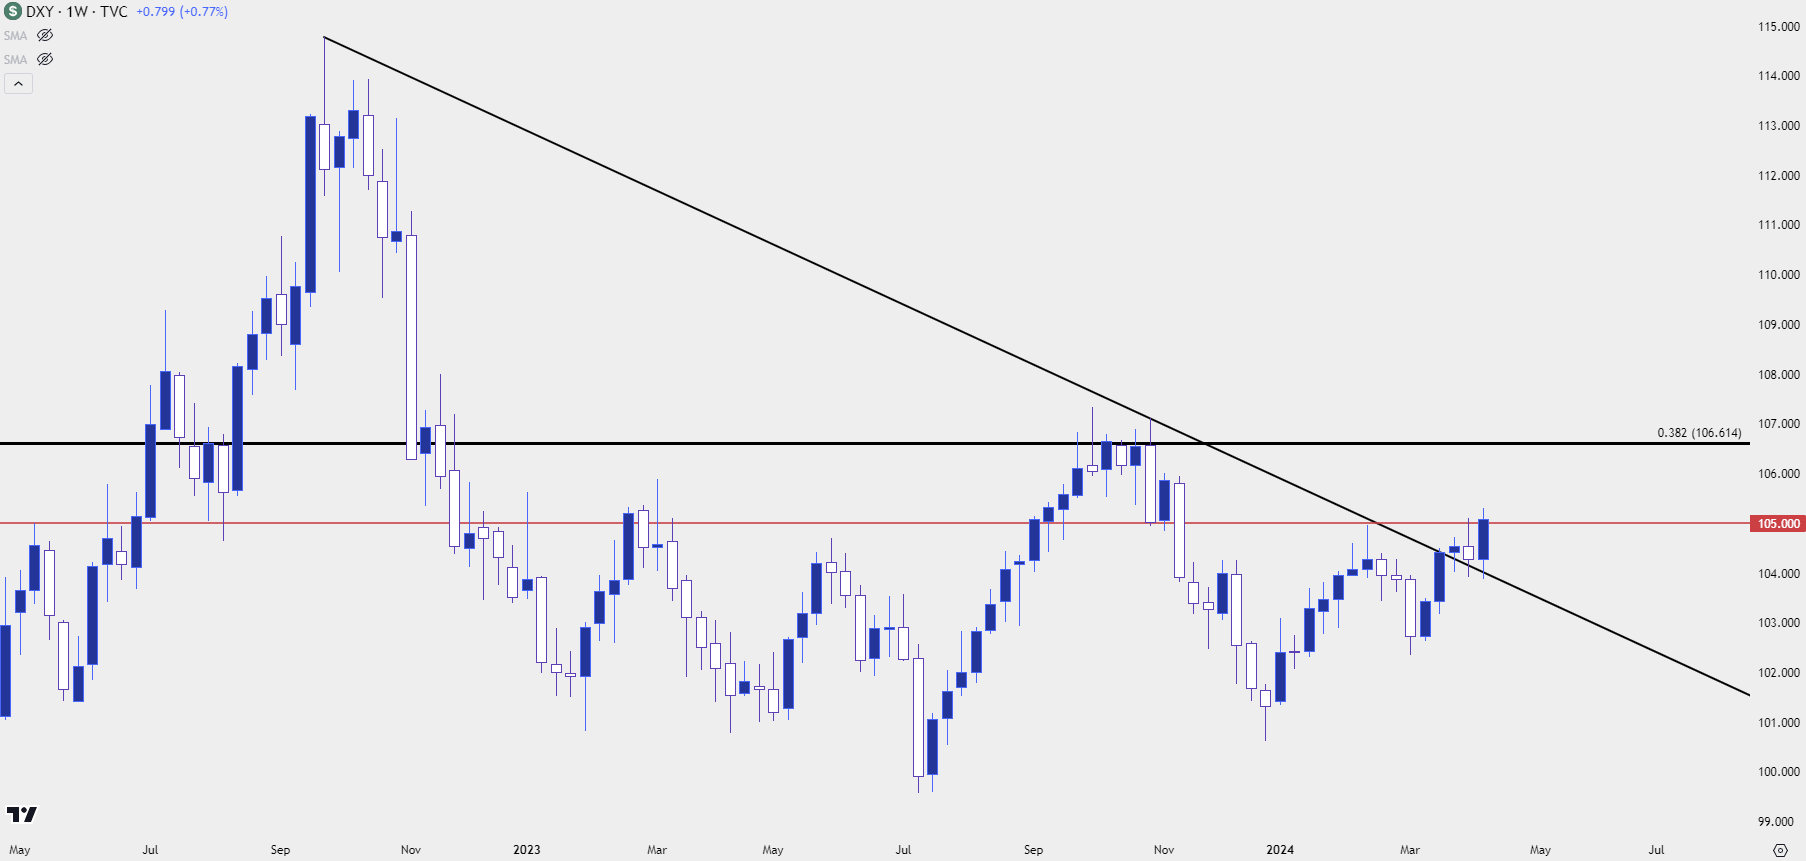 Chart prepared by James Stanley; data derived from Tradingview
USD/JPY
USD/JPY put in a breakout to a fresh 34-year high on the back of this morning’s CPI print, leaving the 151.95 level in the rear view as bulls drove the bid.
I had written about this in the aftermath of the BoJ rate hike last month, saying “Given how long that resistance has held, then there’s probably some stops sitting above 152.00. Stops on short positions are buy-to-cover order logic, which means an influx of demand could hit the market upon that print of fresh highs. That could lead to a continuation in the move, and this is one of the reasons that a well-defended resistance level yielding to breakout can often push into a sharp topside move.”
And, so far, that seems to be what’s happened. The big question now is what’s next and whether the Finance Ministry will order an intervention to defend the same 152.00 level. As I had noted in webinars previously, I think there’s a growing probability that they’ll cast their line in the sand a bit higher, around 155.00 or perhaps even 160.00, as interventions aren’t ideal as it involves burning finite FX reserves. Given that the BoJ is looking at rate hikes and the Fed is looking for cuts, there could also be the growing hope that monetary policy will take care of the heavy lifting for the BoJ in due course.
From a technical perspective, the picture remains clearer: There’s an ascending triangle that’s built over the past few years and that horizontal resistance has now been broken through. The big question at this point is whether bulls can defend the move and retain control. And related to that, how or when will Japanese policymakers respond.
USD/JPY Weekly Chart
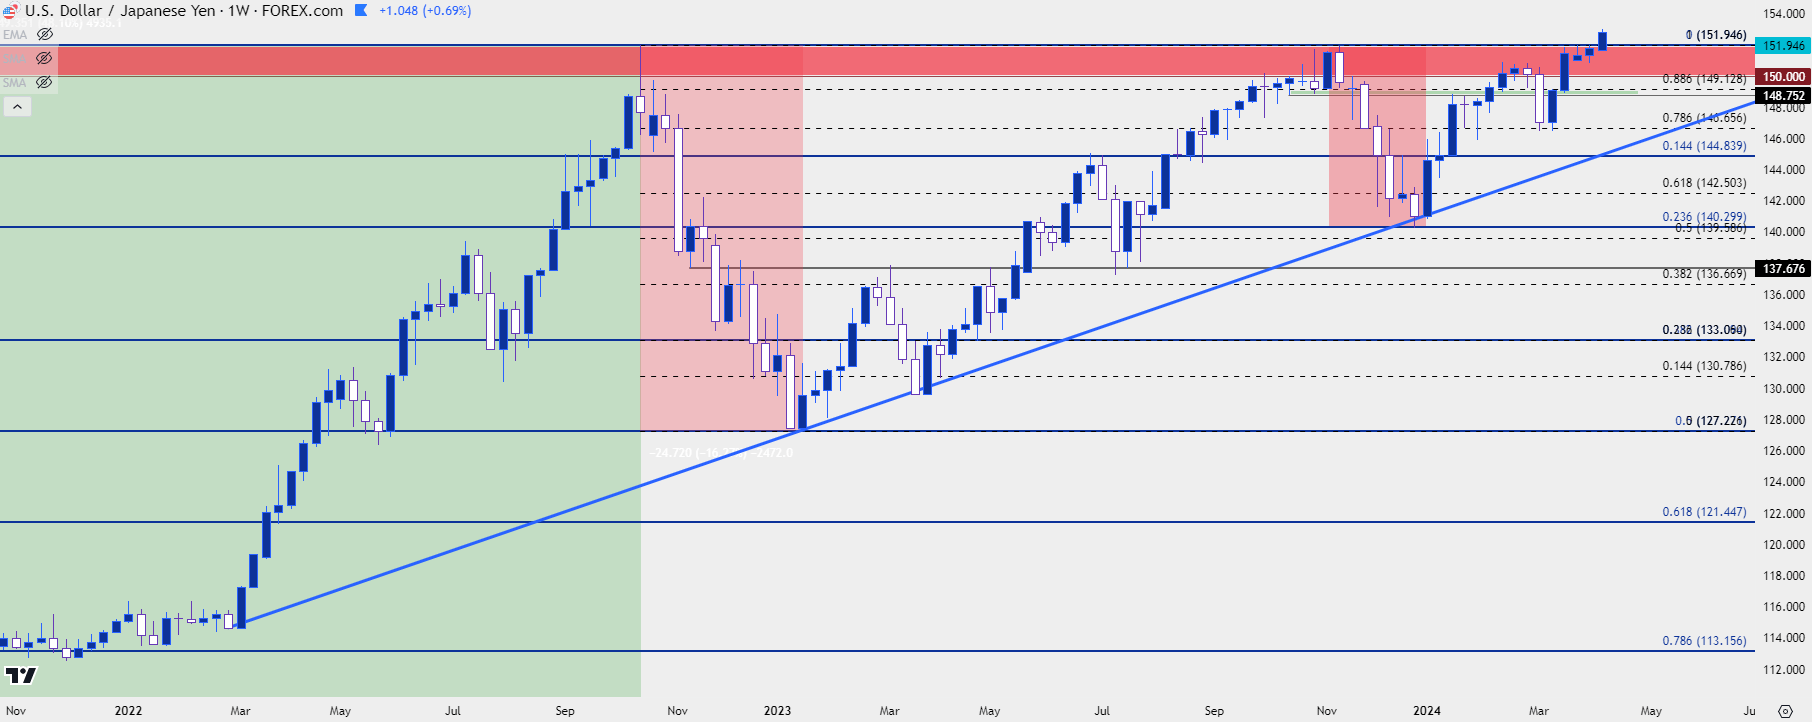 Chart prepared by James Stanley, USD/JPY on Tradingview
EUR/USD
As of this writing EUR/USD is down by 1% today, which makes for the largest sell-off so far in 2024 trade. The big item here is deviation between Europe and the U.S. and given the ranges that have held in EUR/USD and DXY over the past fifteen months, any growth in that deviation could further substantiate trends.
The big question, however, is whether the ECB will finally start to take on a more dovish tone. Of recent it’s seemed as though they wanted to wait for the Fed to cut and when considering the repercussions of exchange rate dynamics, that makes sense.
If the ECB gets more dovish ahead of the Fed and if the Euro falls against the USD, there could be a similar backdrop that was seen in the second-half of 2022, when European inflation was pushing higher and the ECB had little choice but to hike rates. And now with growth in a more vulnerable position in the Eurozone those rate hikes could be an even more daunting prospect.
It really seems as though its in both parties’ best interest for the EUR/USD rate to remain as somewhat stable; so that Europe isn’t exporting their inflation to the U.S. and the U.S. is not exporting their inflation to Europe.
At this point EUR/USD has pushed down to and found support in the 1.0750-1.0766 zone. There are a couple of other spots just below, with 1.0725 and 1.0694 coming in at different points this year to help establish support.
EUR/USD Daily Price Chart
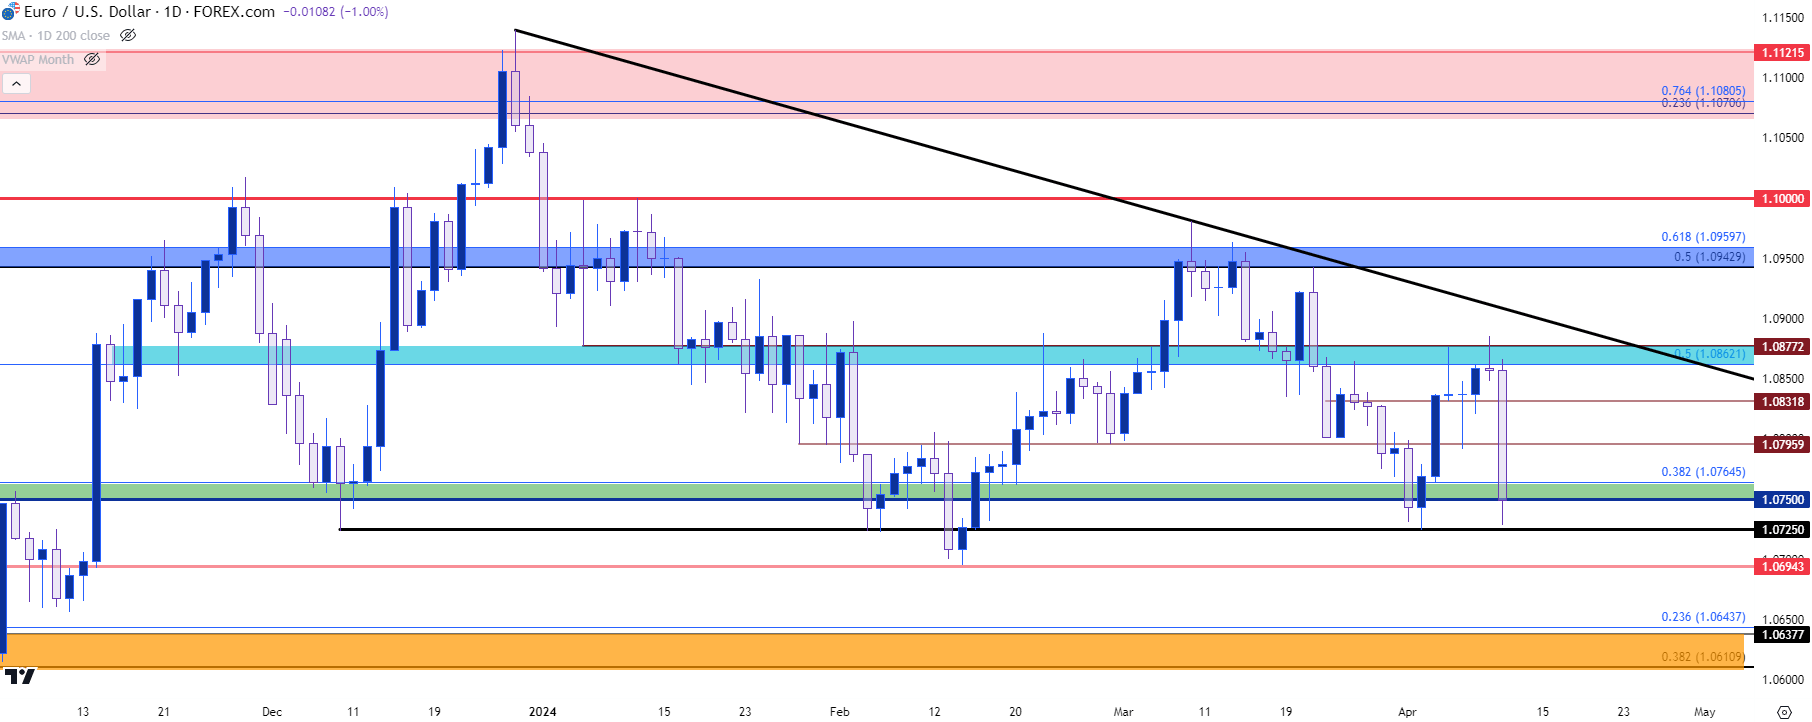 Chart prepared by James Stanley, EUR/USD on Tradingview
--- written by James Stanley, Senior Strategist


