US Dollar Talking Points:
- The US Dollar has continued it’s sell-off into this week, setting a fresh yearly low along the way.
- DXY has pushed into oversold territory on the weekly chart for the first time since January of 2018. That prior episode marked a swing-low that hasn’t been taken-out in the six years since, but turns of that nature are often difficult to time.
- This is an archived webinar and you’re welcome to join the next: Click here for registration information.
US Dollar Sell-Off Goes Oversold
The US Dollar continues to struggle as the Q3 trend of weakness has continued. There was another shot-in-the-arm from the Powell speech on Friday and this week started with a fresh yearly low being established in the USD. I looked into this in yesterday’s article and in the webinar, I was able to get more in-depth on the matter.
The push of weakness has been so great in USD that weekly bars have pushed into oversold territory via RSI for the first time since January of 2018. While the main constituent of DXY is also surrounded by the possibility of rate cuts with the Euro, there’s been continued selling of the USD, and I’m of the mind that the move is resultant from continued unwind in the USD/JPY carry trade. This also helps to explain how the USD could possibly become even more oversold and looking at prior episodes of similar backdrops highlights how reversals from such conditions often take time.
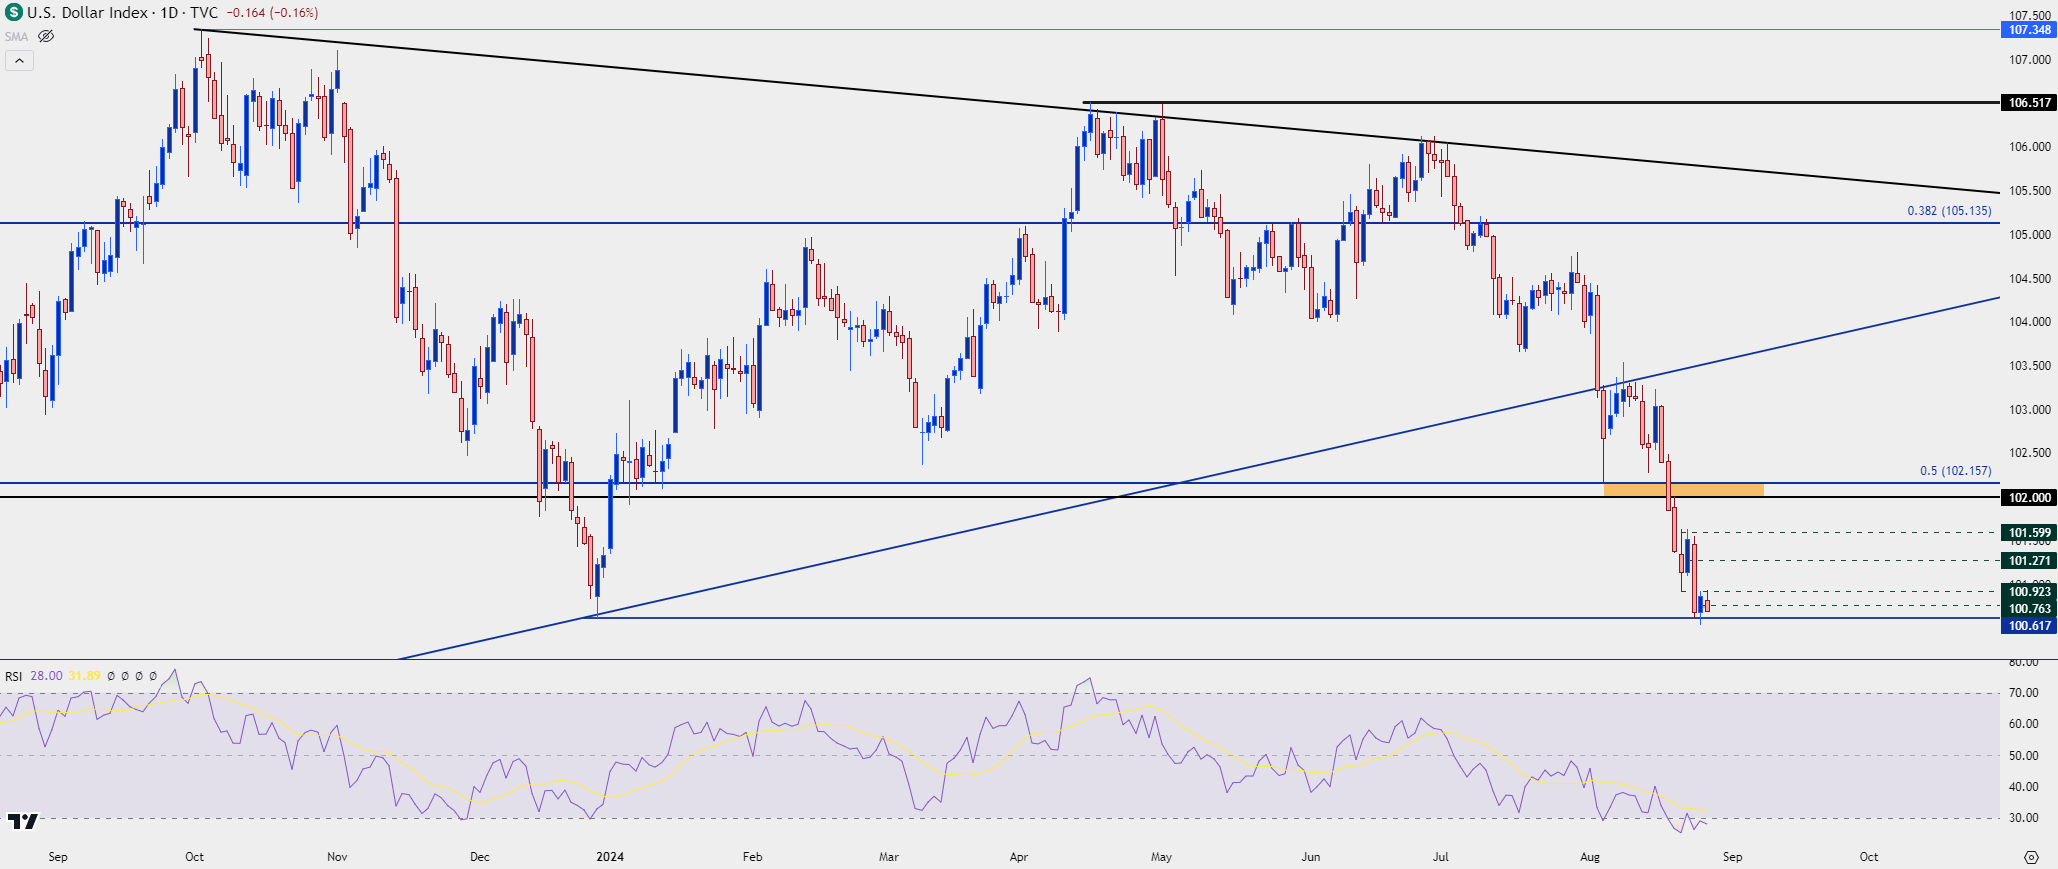
In the webinar, I was able to go down to a short-term chart to show what I’d be looking for in order to establish a re-test of the 102-102.16 area of prior support which is now potential resistance.
US Dollar Weekly Price Chart
 Chart prepared by James Stanley; data derived from Tradingview
USD Daily
From the daily chart, the levels that I had looked at in the video yesterday remain in-play today, with 100.92 helping to hold the days highs. This sets up re-test potential at the 100.62 swing-low that was in-play late last year.
US Dollar Daily Price Chart
 Chart prepared by James Stanley; data derived from Tradingview
USD/JPY
I spent longer than I had anticipated talking about the backdrop of the USD/JPY carry trade but as I had shared, I’m of the mind that there’s still a significant number of longs still holding on in the pair. And to be sure, rollover remains tilted to the long side of the pair, with debits associated for shorts which acts as a form of incentivization/dis-incentivization in USD/JPY as shorts are in a net debit position while longs can still earn credits.
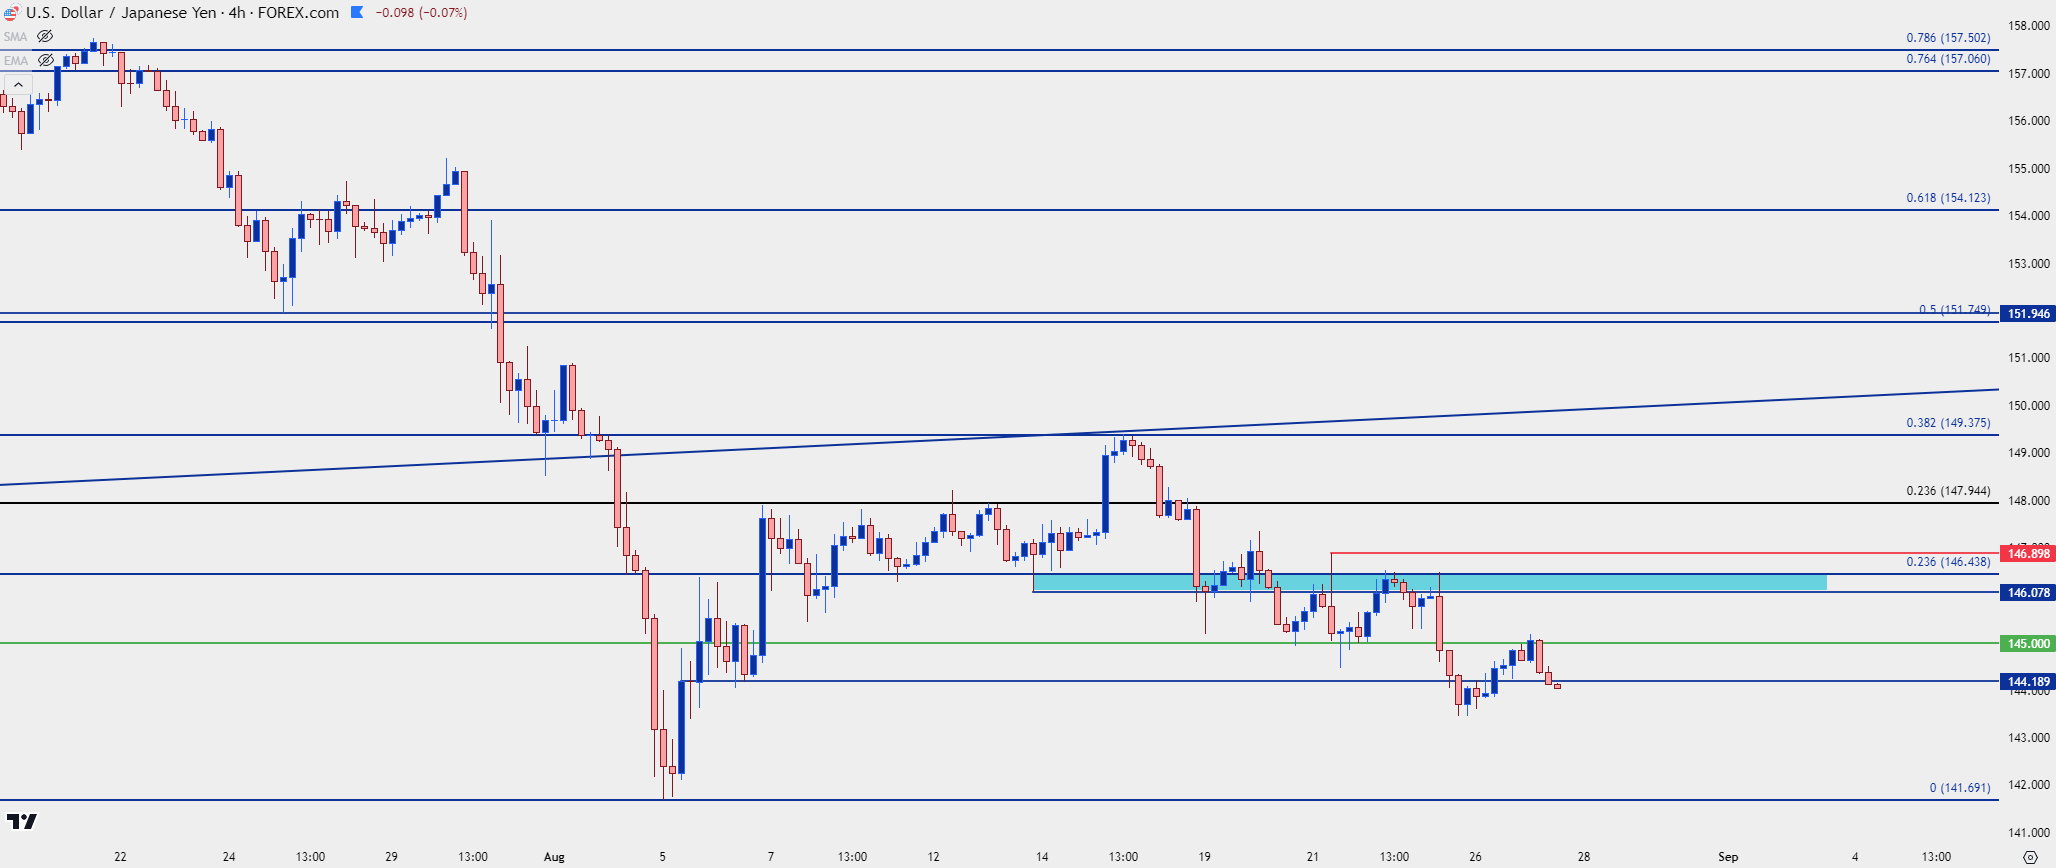
Nonetheless, rollover isn’t the only factor impacting price action and I probably said at least a few times in this session how fundamentals aren’t a direct driver of prices, as sentiment is the conduit. But if there’s growing fears of carry unwind, longs can be further incentivized to close positions such as we saw during pullback episodes in Q4 of 2022 and 2023. In both episodes, the Fed was unable to cut rates due to continued strength in US data, and that kept the rollover strong on the long side of the pair and in-turn, bulls continued to push. But now the Fed is highly expected to begin cutting rates next month and this will cause the carry to narrow between the two economies.
As looked at last week – that fundamental backdrop isn’t a direct spell for sell-offs but there remains bearish structure in-place to continue working with that theme.
USD/JPY Four-Hour Price Chart
 Chart prepared by James Stanley, USD/JPY on Tradingview
EUR/USD
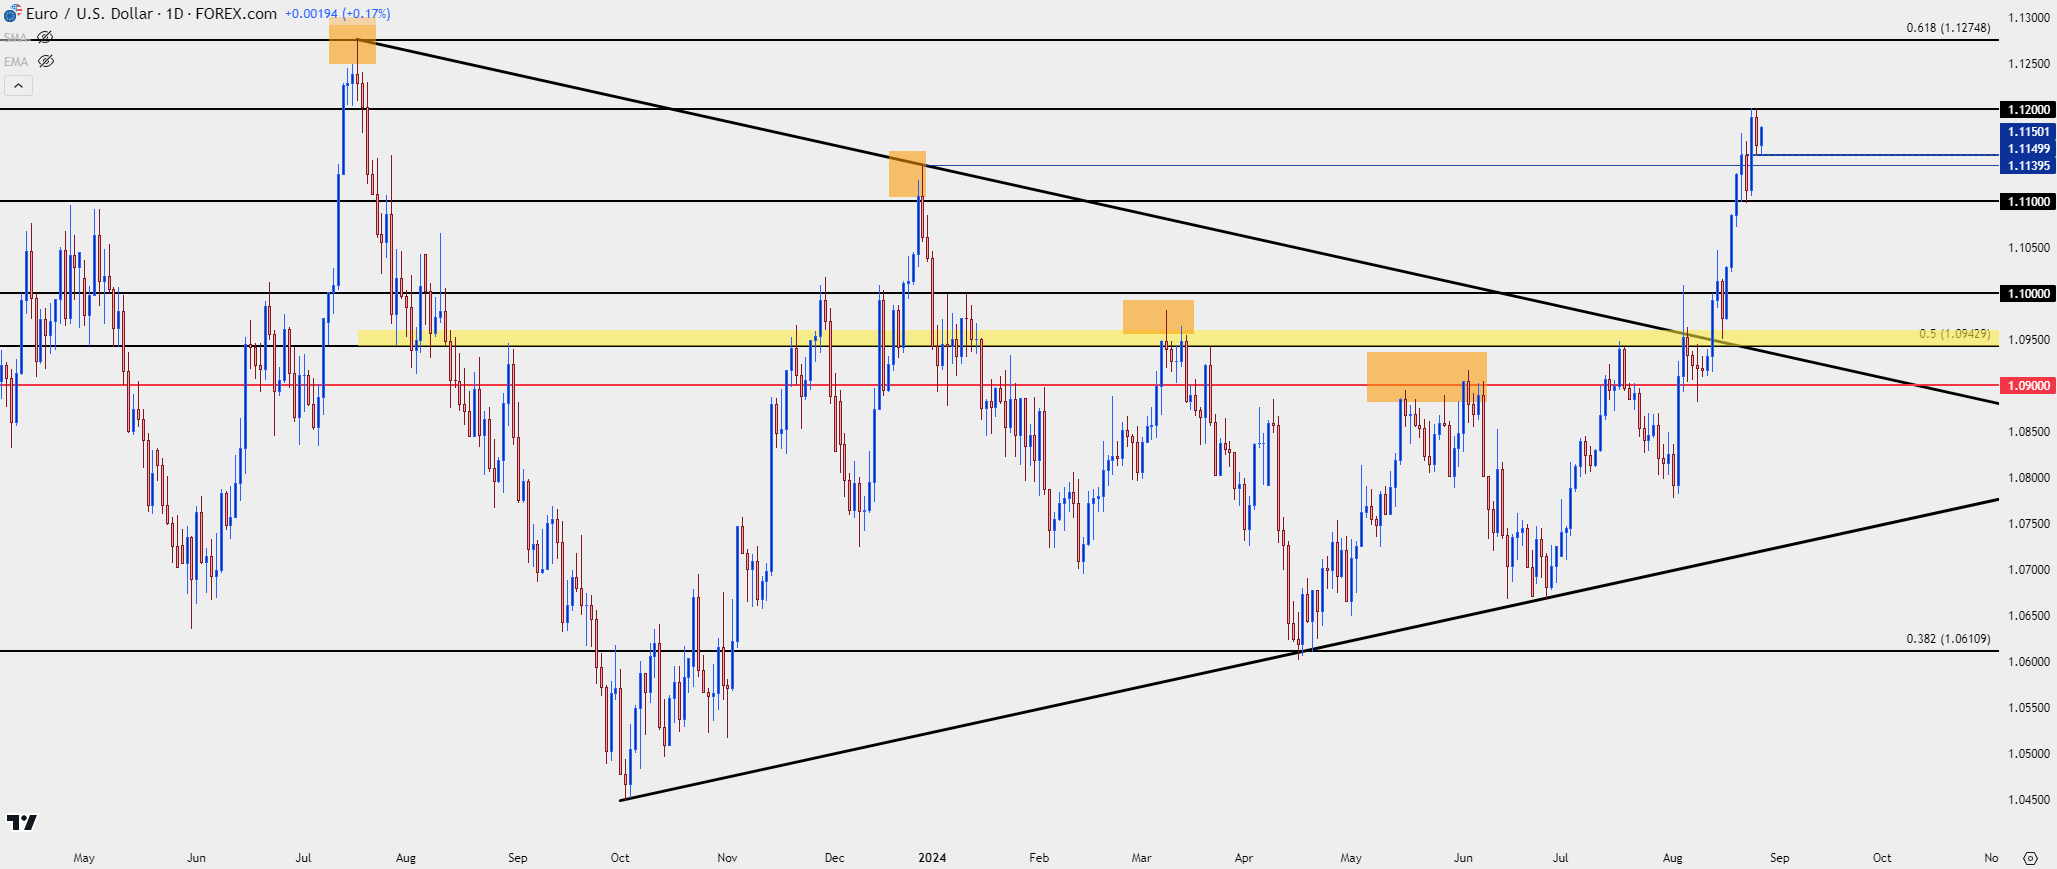
Considering fundamentals, the Euro has put in an extremely strong move against the US Dollar. The ECB is widely-expected to be cutting rates in the near-term, as well, but that hasn’t dissuaded EUR/USD bulls from pushing an already-stretched market to fresh highs.
This both speaks to my expectation that USD/JPY carry unwind is pushing USD and, in-turn, much of the FX market; as well as that statement that fundamentals aren’t a direct driver of spot rates in the currency market. This could be fodder for reversal scenarios at some point in the future, but for now, bulls have continued to push and near-term price action retains a bullish structure.
As for levels – the 1.1275 level is important as this is the 61.8% retracement of the 2021-2022 major move, and this also marked last year’s swing high. If we can see bulls budge above 1.1200, that’s the next major spot that I’ll be looking for. A clean hold there with an illustration of resistance can possibly open the door for short-term reversal themes; and depending on how that interacts with price action, there may be an opening door for a larger pullback-type of move.
EUR/USD Daily Price Chart
 Chart prepared by James Stanley, EUR/USD on Tradingview
Gold
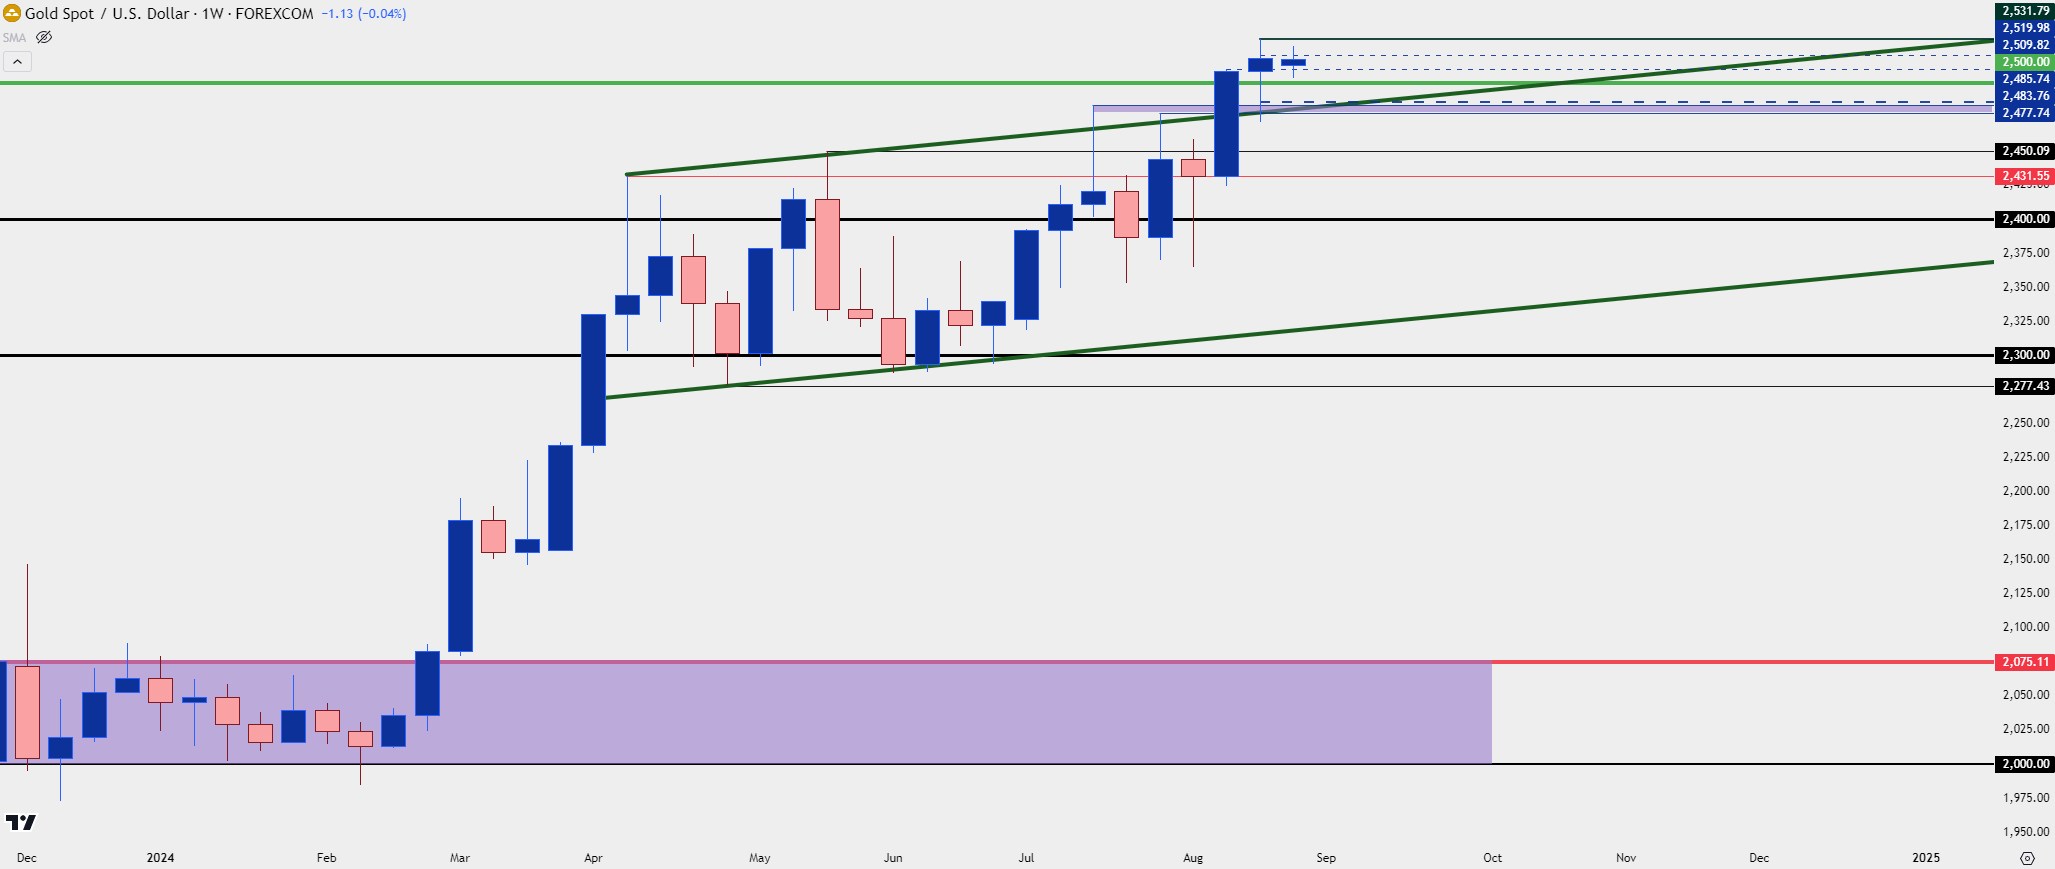
As I shared up-front on the section on Gold, I would like to see a deeper pullback. Last week finished as a spinning top and much of that strength showed after a test of the support zone I had looked at in the past webinar, spanning from 2477-2483. That catapulted bulls back-above the $2500 psychological level but of late, there’s appeared to be difficulty drawing fresh buyers in near those previously established highs. This can be indicative of a one-sided market and given the strength that’s shown in gold this year, with the Q2 range or digestion largely showing sideways churn, and the yellow metal starts to feel a bit heavy to me.
The key for larger pullback scenarios will be a push back-below $2500. Last week’s spinning top highlights indecision despite the fresh ATH and so far, this week has traded inside of the past week. If sellers can tip back-below $2500, the door opens for re-tests of support at 2477-2483, 2450 and then 2431.
Gold Weekly Price Chart
 Chart prepared by James Stanley; data derived from Tradingview
--- written by James Stanley, Senior Strategist


