
U.S. Dollar Talking Points:
- The U.S. Dollar has started to reverse from the recent advance over the past couple of days, following a re-test at the 105.00 level in DXY.
- This has helped to lift EUR/USD and GBP/USD; meanwhile USD/JPY continues to hold very near the 151.95 level that’s held the highs in 2022, 2023 and so far this year. For USD-bulls, USD/CHF has started to pullback and there’s support potential around the .9000 handle.
- The Trader’s Course has been launched and is available from the below link. The first three sections of the course are completely open and this focuses on fundamental analysis, technical analysis and price action.
The U.S. Dollar continues to pare back its recent advance after Monday’s inflection at the 105.00 level in DXY. That’s an important spot on the chart as it’s the 38.2% Fibonacci retracement of the 2021-2022 major move, but perhaps more importantly this is the spot that’s so far held the highs in the greenback twice already this year after showing as support last November.
When this resistance came into play in mid-February it was just after an above-expectation CPI print. Markets factored that higher-than-expected inflation into DXY but it was just a day later that Austan Goolsbee of the Chicago Fed commented that investors should not get ‘flipped out’ about the inflation report. This put bulls on their back foot and before long there was some less-optimistic data for bears to work with. That kept USD in sellers’ control all the way into the NFP report in early-March, with support ultimately showing at the same 102.55 level that was resistance in the first couple weeks of the year.
That led into another incline in the later portion of the month with the 105 handle once again coming into play this Monday. Since then, bulls have been on their back foot as prices have pulled back, helped along by a lower-than-expected Services PMI print earlier this morning, which was followed by another appearance from FOMC Chair, Jerome Powell. He echoed his prior sentiment, that rate cuts would begin at some point this year and that similarly helped to motivate bears to continue the push.
At this point, the USD is fast approaching the 104.21 level, which was a prior swing high and there’s the 103.98 level just below that, which is the 50% mark of the recent major move from last Q4.
U.S. Dollar Daily Price Chart
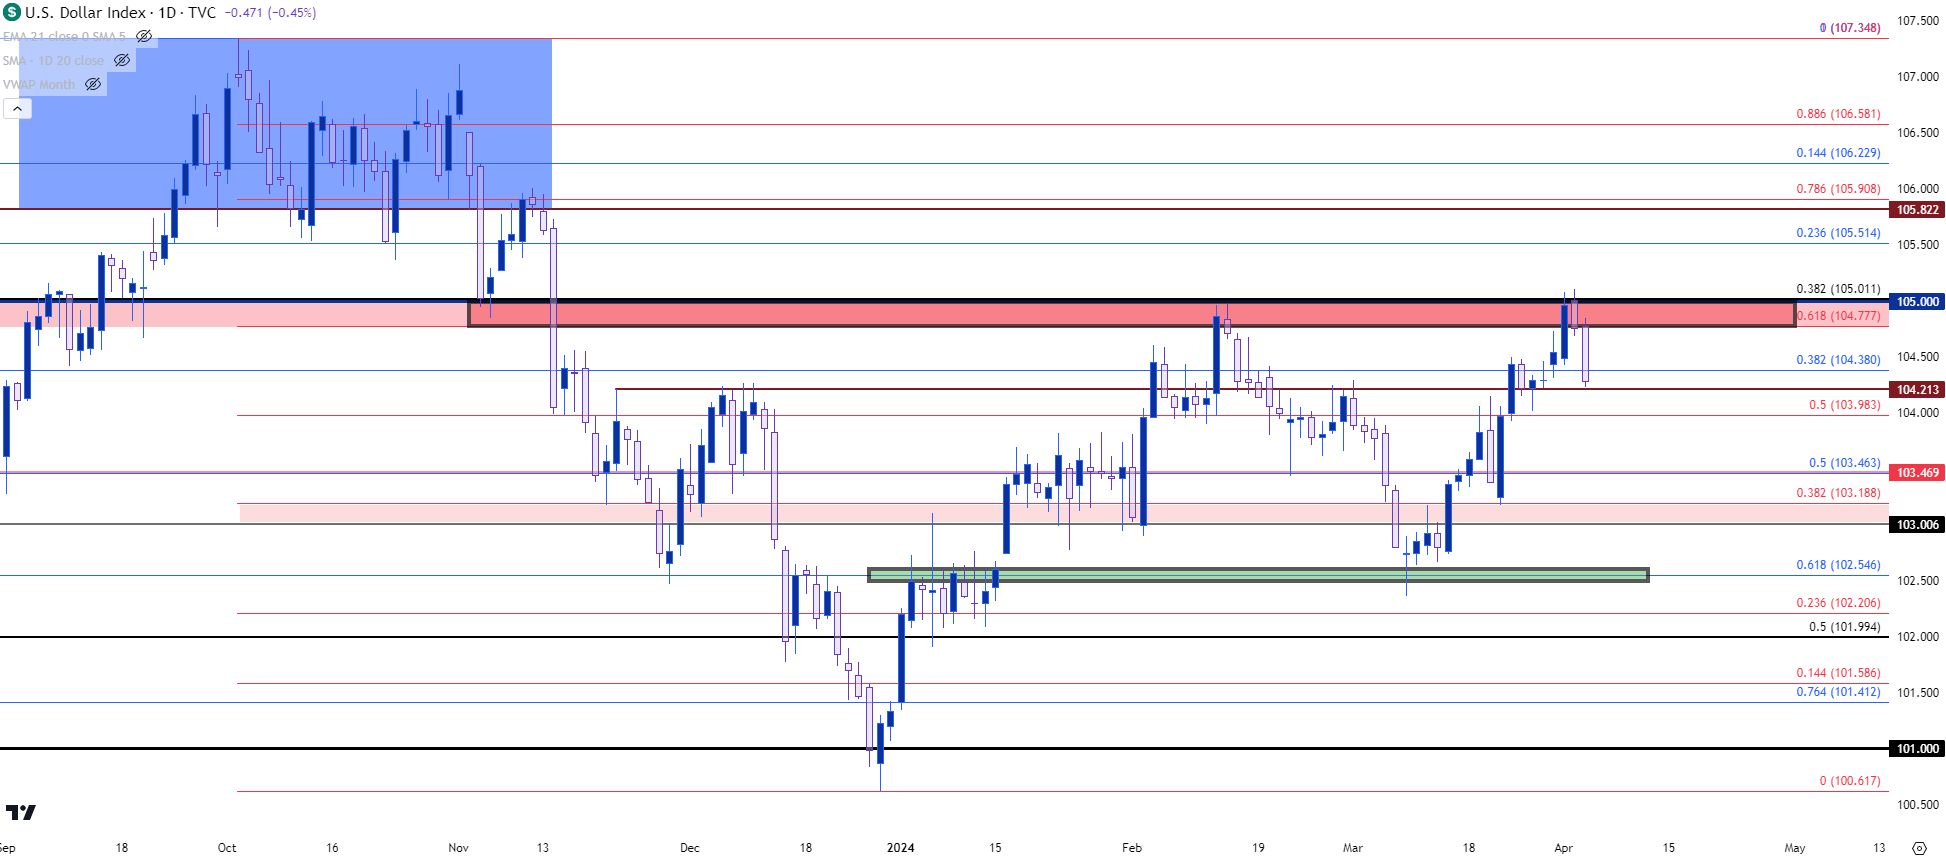
Chart prepared by James Stanley; data derived from Tradingview
Can U.S. data force a deeper pullback?
The next major item on the calendar is the Friday NFP report, and as we saw last month, that data point has the potential to turn a trend or push a breakout. At this point, the Fed still appears dovish even with CPI data remaining fairly strong. Rate cuts have been priced out to a degree, of late, and longer-dated U.S. Treasury Yields have been pushing to fresh highs.
There’s also the item of counterparts, and since we’re talking about the U.S. Dollar via DXY, it’s worth looking to the Euro which makes up 57.6% of the DXY quote, which I’ll discuss in the following section. If a higher-low can hold in the USD, and if bulls can force another re-test of the 105.00 level, the big question at that point is whether the third time will be the charm for topside breakouts in DXY at 105.
For support, there’s a prior swing high at 104.21 that’s already nearby, and below that is the 50% mark of last Q4’s sell-off. The 200-day moving average plots around 103.78 and then there’s a confluent spot at the 103.46 level.
U.S. Dollar Four-Hour Price Chart
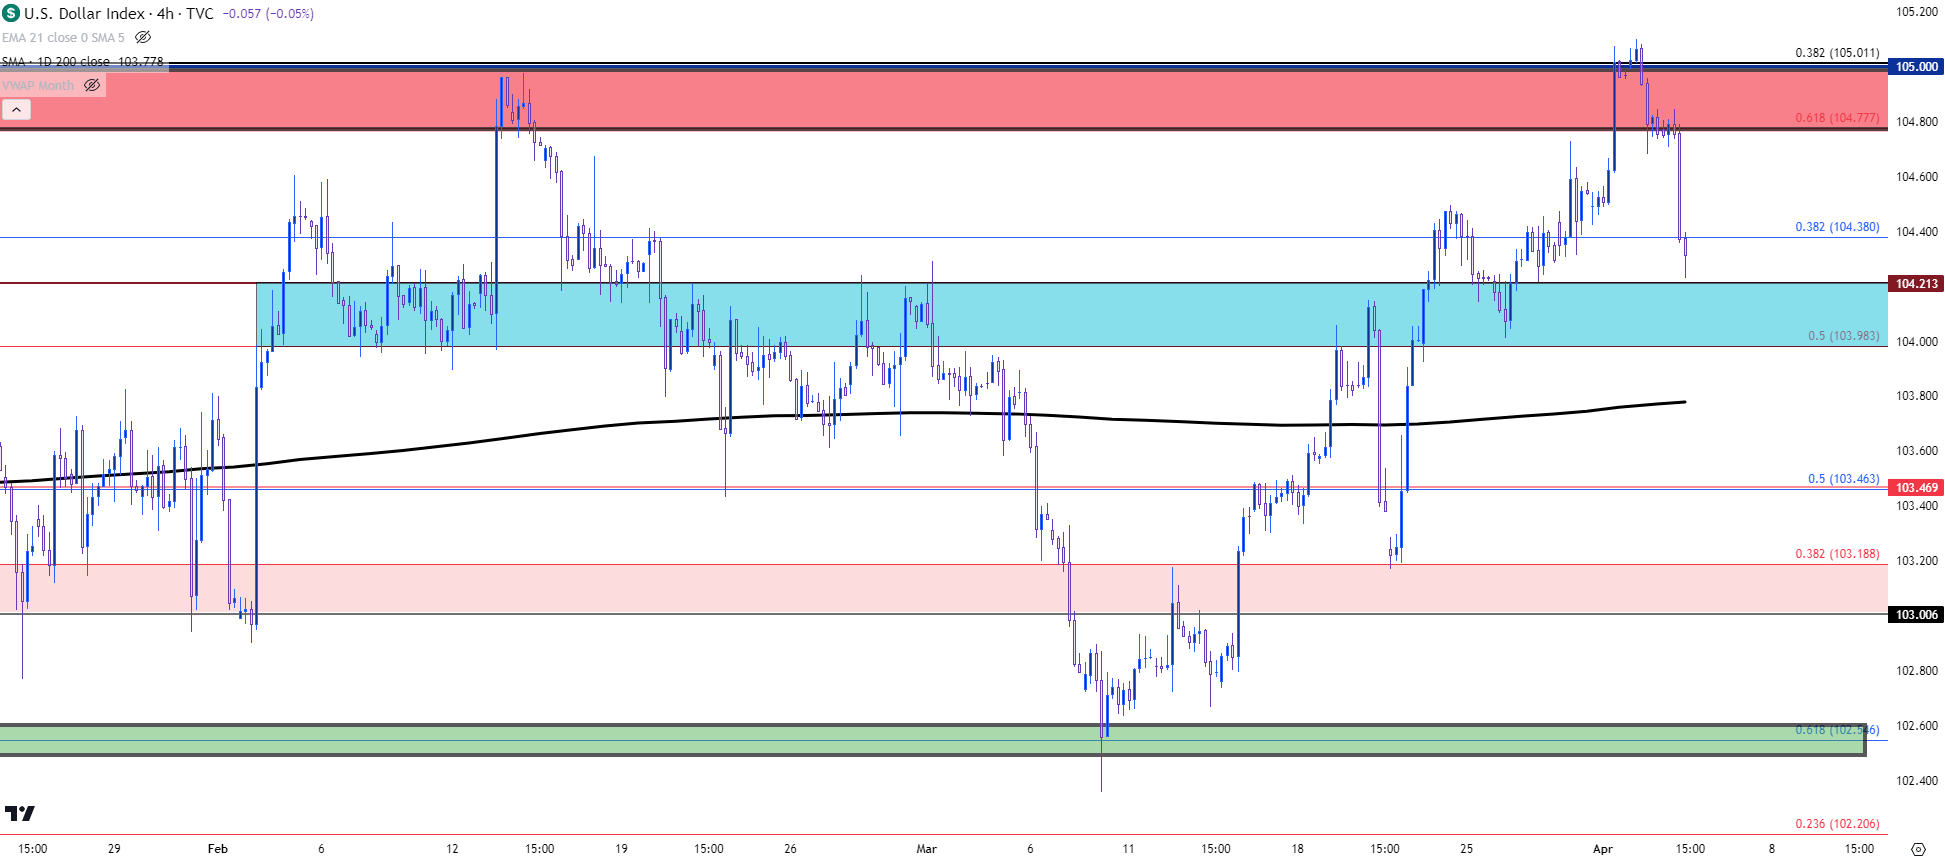 Chart prepared by James Stanley; data derived from Tradingview
EUR/USD
EUR/USD jumped after the FOMC rate decision but that strength couldn’t hold for long, as sellers came into hold resistance at 1.0943 and then started to take over control shortly after. This led to a test and eventual break-through the 200-day moving average and coming into this week bears were continuing to push until finding a low around 1.0725. Since then, however, matters have been going the other way as yesterday morning showed a breakout from a falling wedge, and that strength has very much continued so far today.
At this point, price is re-testing the 200-day moving average which is confluent with a prior swing at 1.0832. And given the pace of the breakout, there’s some support structure for bulls that can be defended to retain control, plotting around the 1.0796-1.0800 area of the pair.
EUR/USD Four-Hour Price Chart
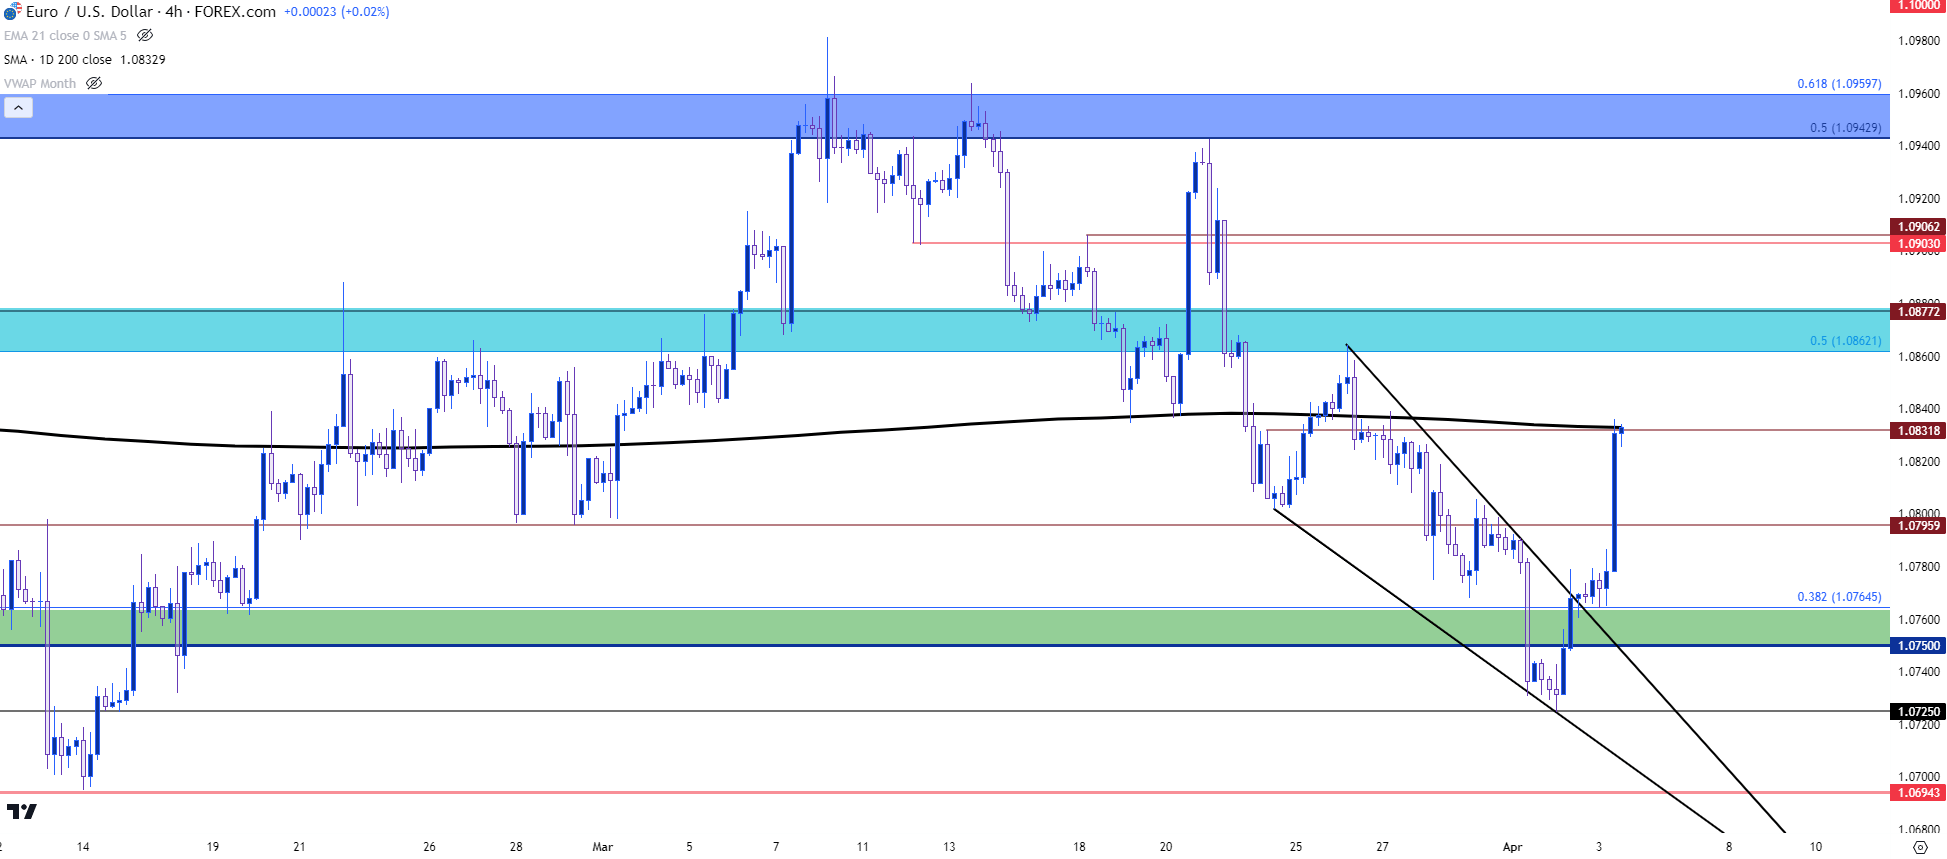 Chart prepared by James Stanley, EUR/USD on Tradingview
USD/JPY
Despite the U.S. Dollar’s relative weakness over the past two days, USD/JPY remains pinned very close to the same 151.95 level that’s evoked reversals in each of the past two years. The BoJ hiked rates last month for the first time since 2007; and the Fed remains fairly dovish even in spite of strong U.S. economic data; a cocktail that would normally give bears some motivation to push. But that hasn’t happened of late as the carry remains tilted to the long side of the USD/JPY pair and despite the Fed’ dovish pleas, rate cuts have been getting priced-out and Treasury yields have been pushing higher.
If there is a legitimate breakdown in the U.S. Dollar, however, perhaps spurned by a weaker-than-expected NFP report on Friday, that may change things. After all, it was a broader USD sell-off in Q4 of 2022 and 2023 that helped to evoke reversals in USD/JPY. At this point, bulls holding carry trades don’t appear so worried as they hold exposure so near that long-term high.
There is another side of this, however, and given the lack of bearish activity it’s something to be considered, and that’s bullish breakout potential in the event of a strong NFP read. I had previously written my thoughts on the matter, discussing how there’s likely a number of stops for short positions lodged above current resistance. If those stops get triggered, that could lead to a fast slingshot-like move as fresh demand comes into the market (stops on shorts are ‘buy to cover’ orders). And given the BoJ’s prior proclivity to intervene on Fridays, that backdrop could be an item of consideration as move towards the next jobs report.
USD/JPY Daily Price Chart
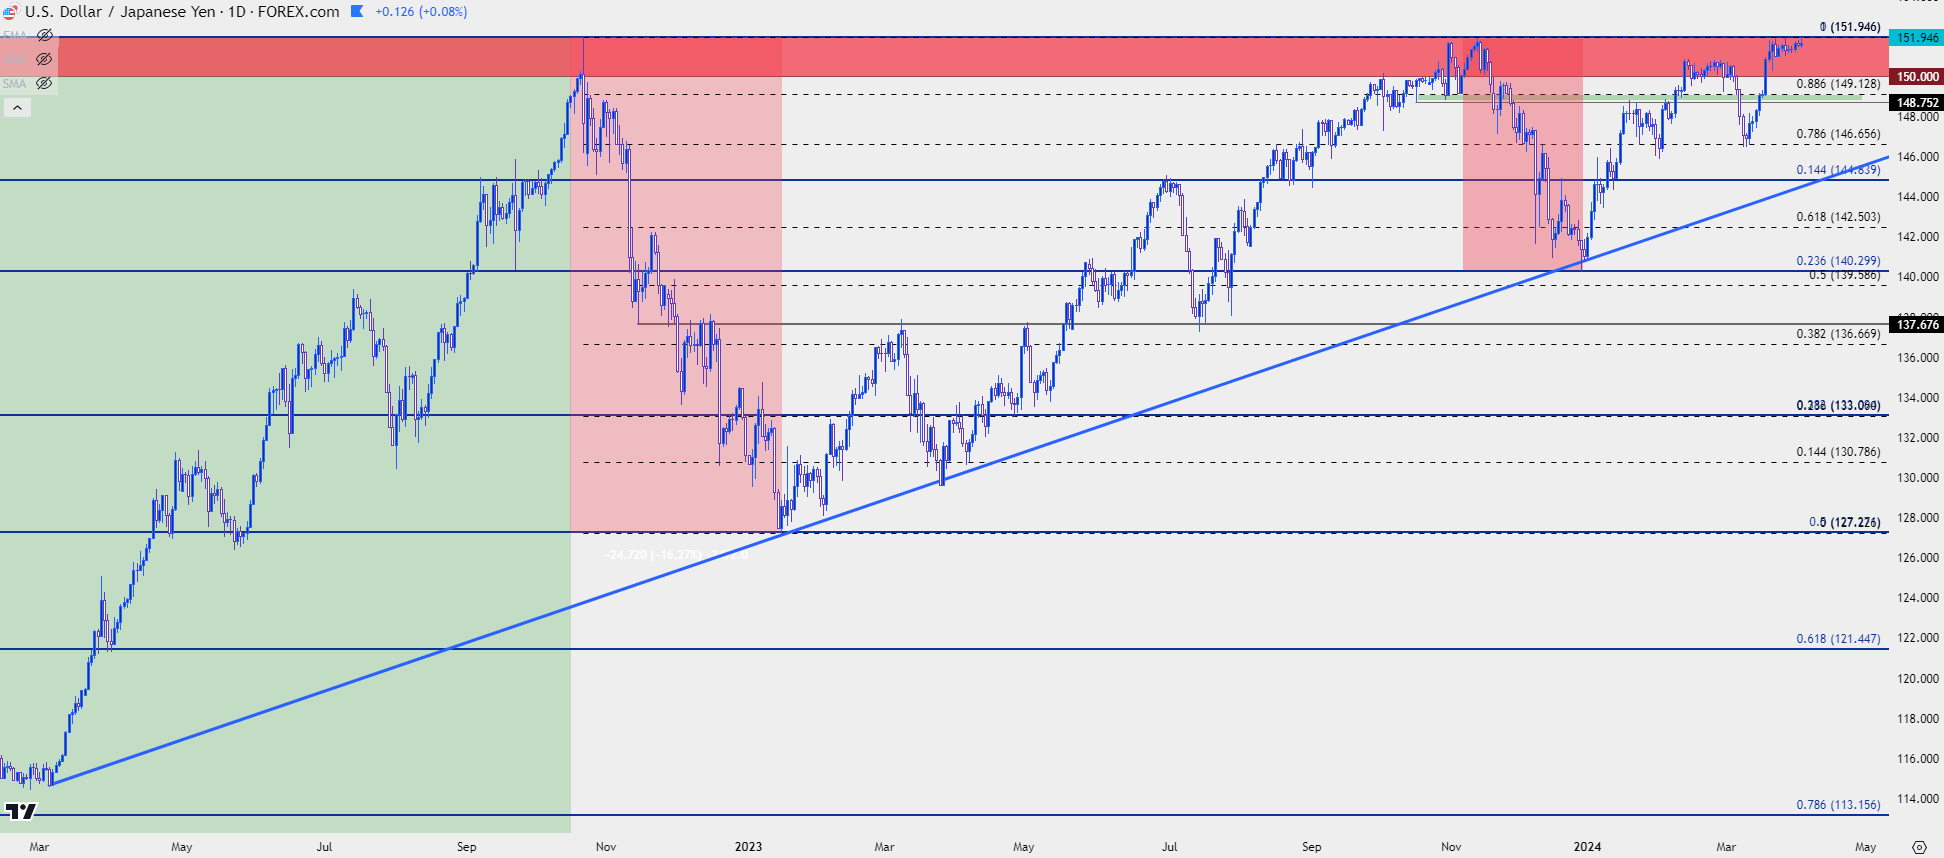 Chart prepared by James Stanley, USD/JPY on Tradingview
USD/CHF
USD/CHF may be one of the more attractive setups for USD-strength given that the Swiss National Bank has already started to cut rates. It’s already been a strong year for USD/CHF and we’ve just completed the first quarter, and the daily chart continues to highlight bullish structure that can keep the pair as a market of interest for USD-bulls.
The trend so far has been fairly clean, with a month-long test at the 200-dma, at which point a bull flag formation built. Buyers pushed a breakout just ahead of the FOMC and there was strong extension in the move later that week as the SNB cut rates. More recently, the pair climbed above the .9000 handle and that prior spot of resistance helped to set support last Thursday which led to another fresh high.
At this point, there’s a few different spots of interest for support: There’s a Fibonacci level at .9026 and then the psychological level at .9000. There’s a prior swing low at .8970 and then prior resistance comes into play at the .8866-.8888 area. Notably, that resistance hasn’t yet shown much for support since the SNB-fueled breakout in the pair.
USD/CHF Daily Price Chart
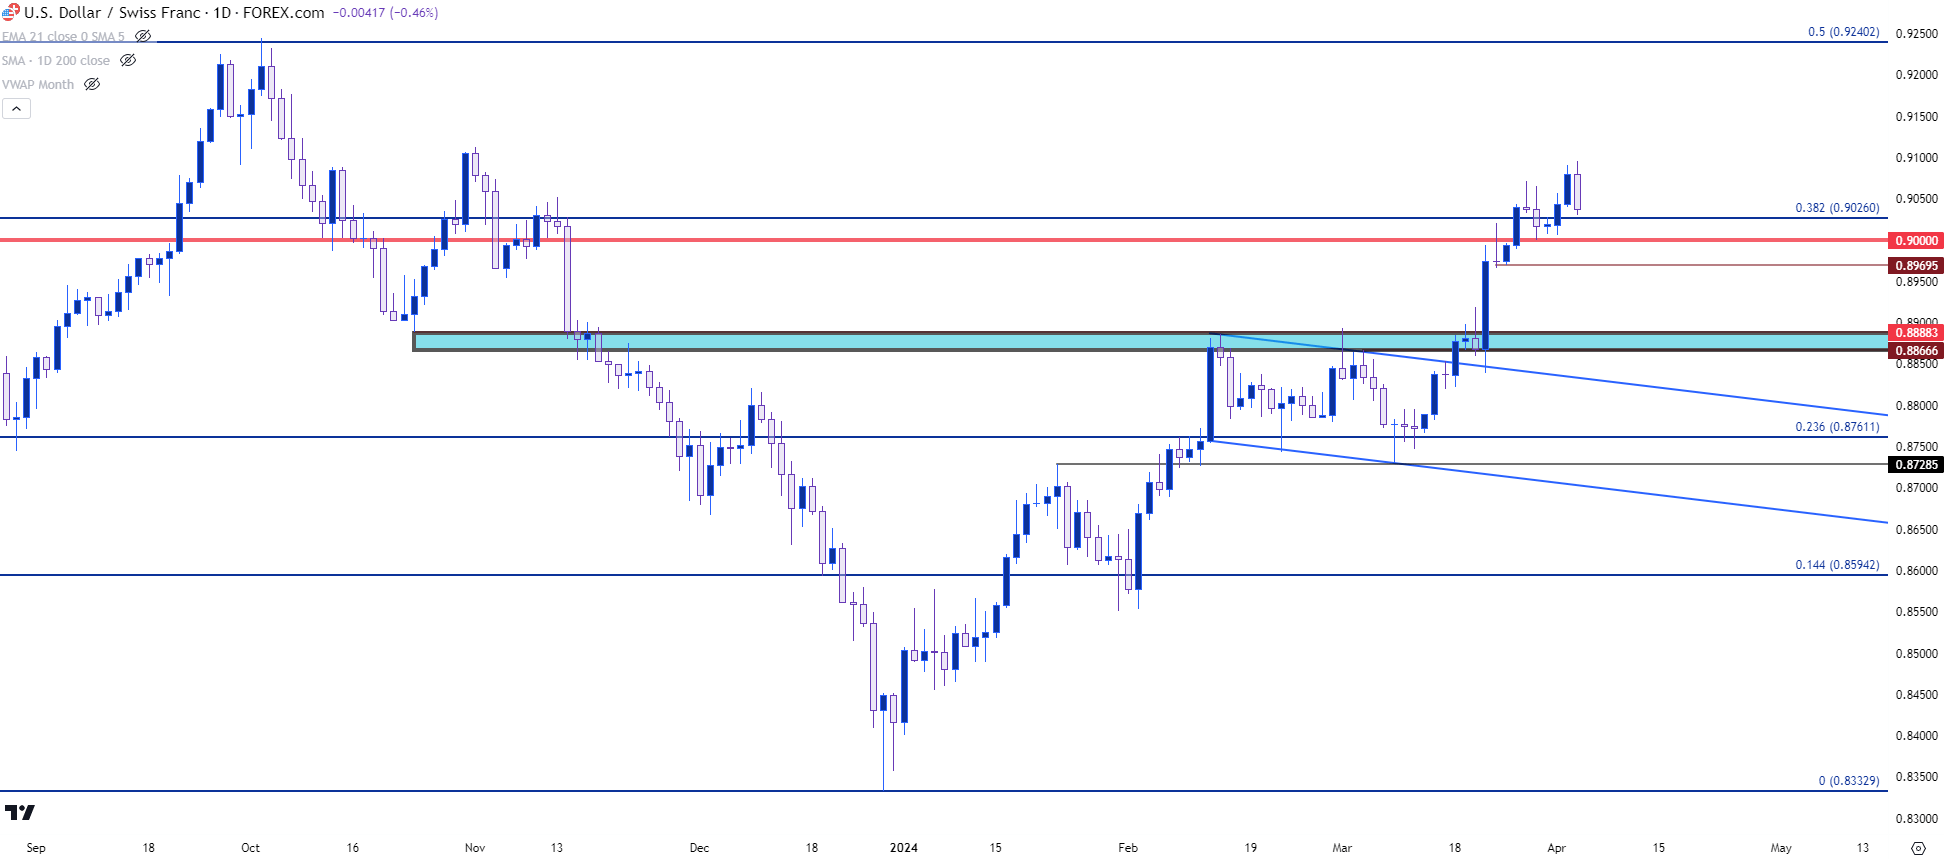 Chart prepared by James Stanley, USD/CHF on Tradingview
XAU/USD (Gold)
Gold has set another fresh all-time-high today, helped along by the Powell comments from a little earlier today. With yesterday’s low showing right at prior resistance of $2,065, bulls have continued to show control of gold prices and there’s not yet an indication that this is ready to change. The next area of possible resistance is the $2300 psychological level sitting overhead and there’s a few different spots of possible support for bullish continuation scenarios, such as the prior swing high at $2,288 or the prior swing low at $2,281.
The next spot of support below that is the same $2,265 level that helped to hold the lows yesterday, and if bears can evoke a test below that price then there may be a rising attraction towards deeper pullback potential. That move has been so incredibly strong lately that bears will likely want to be careful, but if we do see a stronger-than-expected NFP reading that leads into USD-strength, there may be that counter-trend scenario to work with.
XAU/USD (Gold) Four-Hour Price Chart
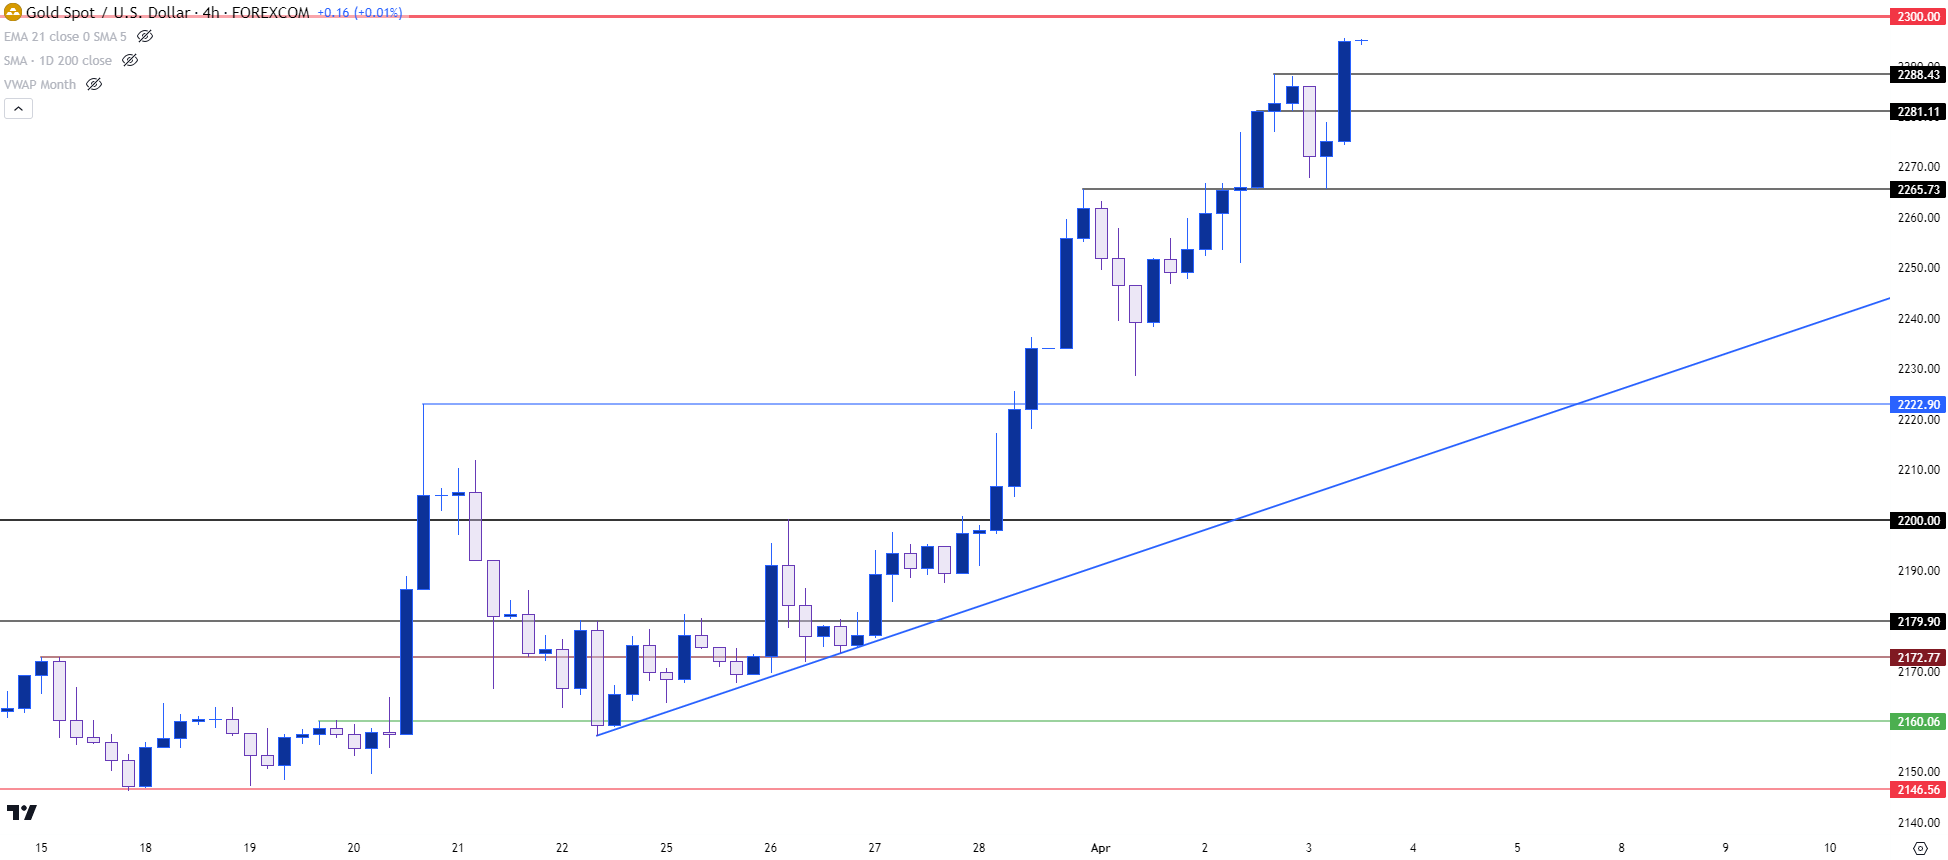 Chart prepared by James Stanley, Gold on Tradingview
--- written by James Stanley, Senior Strategist


