
US Dollar Talking Points:
- It’s been an indecisive week for the US Dollar as DXY is working on a spinning top formation on the weekly chart.
- Given the launch from the week before, the fact that the move couldn’t pare back further illustrates continued strength. The US Dollar was flashing overbought conditions on the daily chart on Monday and Tuesday but the pullback in the second-half of the week helped to ease those conditions.
- Next week is big: The Fed goes into blackout ahead of the next rate decision, and the Friday release of Core PCE could have a large impact on the market given how strong the USD has run since the last CPI report.
US Dollar bulls have held the line so far this week, and the support in EUR/USD at the 1.0611 level has probably helped a bit.
But, perhaps even bigger than the data-driven moves have been the FOMC sentiment that’s been seen of late. We heard from two of the heavier hitters at the Fed this week with Powell’s remarks on Wednesday and Austan Goolsbee’s comments on Friday. In both cases, there were questions around rate cuts which is a far cry from the stance they seemed to hold just a month prior.
At the March FOMC meeting, Chair Powell and the Fed retained their expectation for three cuts in 2024. But another stronger-than-expected CPI print along with a strong NFP release earlier in April have brought those expectations to question, and since then, there’s been a run-higher in U.S. Treasury yields as we’ve seen 2024 rate cut probabilities getting priced-out.
Just a couple of weeks ago the wide expectation was for three cuts in 2024, but, as you can see from the below, expectations have pushed back towards one or two cuts for the rest of this year. The prospect of a cut in June has been largely priced-out, and the Fed’s next meeting, set to be announced on May 1st, will bring with it the question of just how dovish the Fed remains to be.
Fed Expectations into the End of 2024
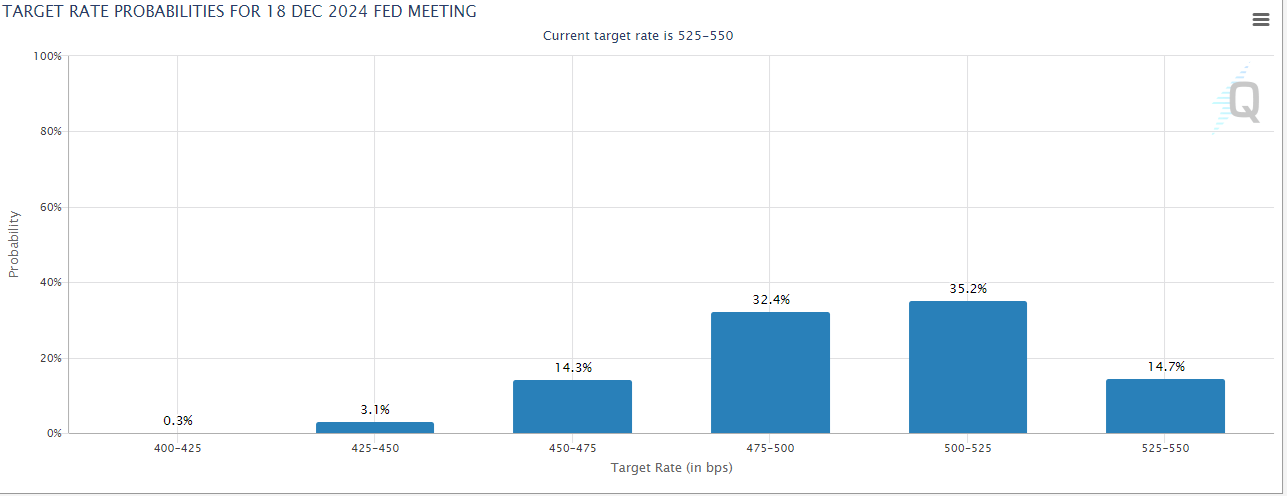 Chart prepared by James Stanley, data from CME Fedwatch
With that said – there is one more key data print set to be released before we get to that meeting, and that’s next Friday’s release of Core PCE data. This is often called the Fed’s ‘preferred inflation gauge,’ and as I’ve been writing about, that data point has shown more progress than what’s been seen in Core CPI. It was also one of the push points for the Fed’s dovish argument as it was a fast move-lower in Core PCE last year that brought upon fear. On the below chart, I’ve plotted both Core CPI and Core PCE and notice how CPI has been stalled near the 4% handle for seven months now, while Core PCE was moving down considerably faster until last month’s print at 2.8%.
Core CPI v/s Core PCE since January, 2021
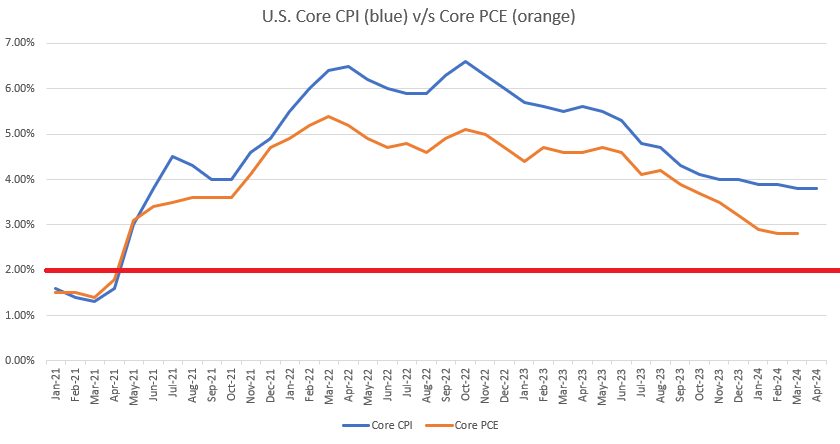
Chart prepared by James Stanley
The U.S. Dollar
The Fed still doesn’t sound like they want to hike even with inflation and employment both remaining strong. But it does sound as though they may need to re-think their strategy on rate cuts, and that’s what we’ve heard from Fed-speakers of late. The Friday PCE print will likely be a big driver but, also of consideration, is the expectation for rate cuts in Europe.
The Euro is 57.6% of the DXY quote and this is one of the reasons that the bullish breakout in the USD charged higher after the ECB rate decision two weeks ago. It appears the ECB may need to cut rates before the Fed, and that’s shifted expectations to a degree.
In EUR/USD, however, price remains in a range that’s been in-play for more than 15 months already. The support that caught the lows on Monday and Tuesday is a well-worn area; and that goes along with the resistance that was seen in DXY at 106.50, which is the bottom of a gap that developed after the November FOMC rate decision.
That resistance inflection also came along with an overbought RSI read on the daily chart, which isn’t all too common in the USD. The past two separate instances of that both marked highs that have yet to be taken-out.
US Dollar Daily Price Chart
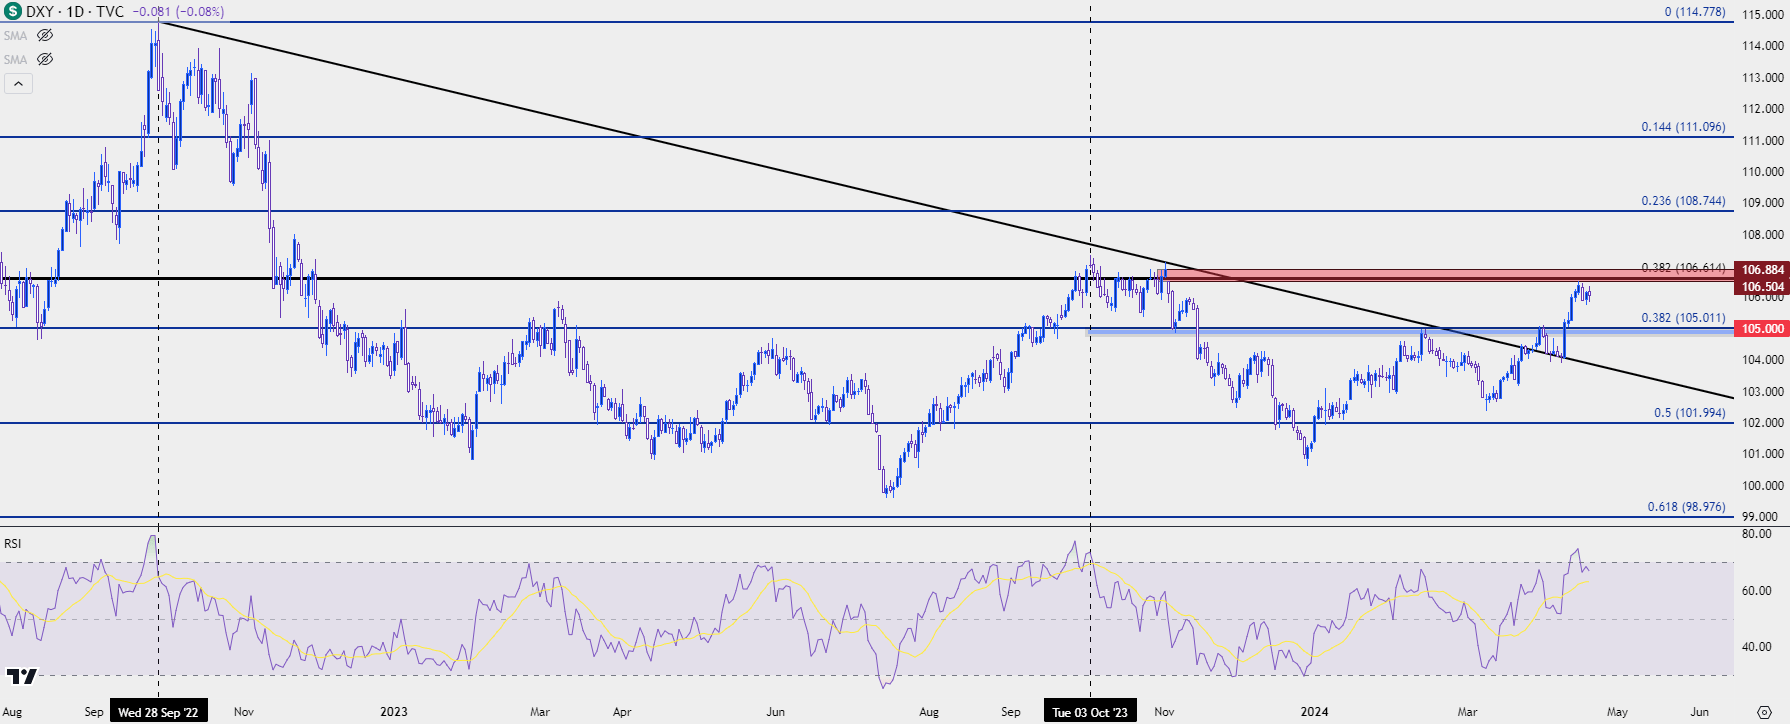 Chart prepared by James Stanley; data derived from Tradingview
USD Shorter-Term
As with any fresh breakout, the big question is the prospect of continuation.
At this point the pullback in the USD bullish move has been rather mild, and there is scope for additional support a little lower on the chart. The 104.77-105.00 area in DXY is key, as this was resistance twice in early-2024 trade until the CPI-fueled breakout two weeks ago. Above that there’s another spot of interest, spanning from Fibonacci levels at 105.38 up to 105.51.
Support in either of those areas keeps the door open for a continuation of higher-highs and higher-lows; and a key part of that dynamic will likely be EUR/USD which I’ll look at next.
US Dollar Four-Hour Price Chart
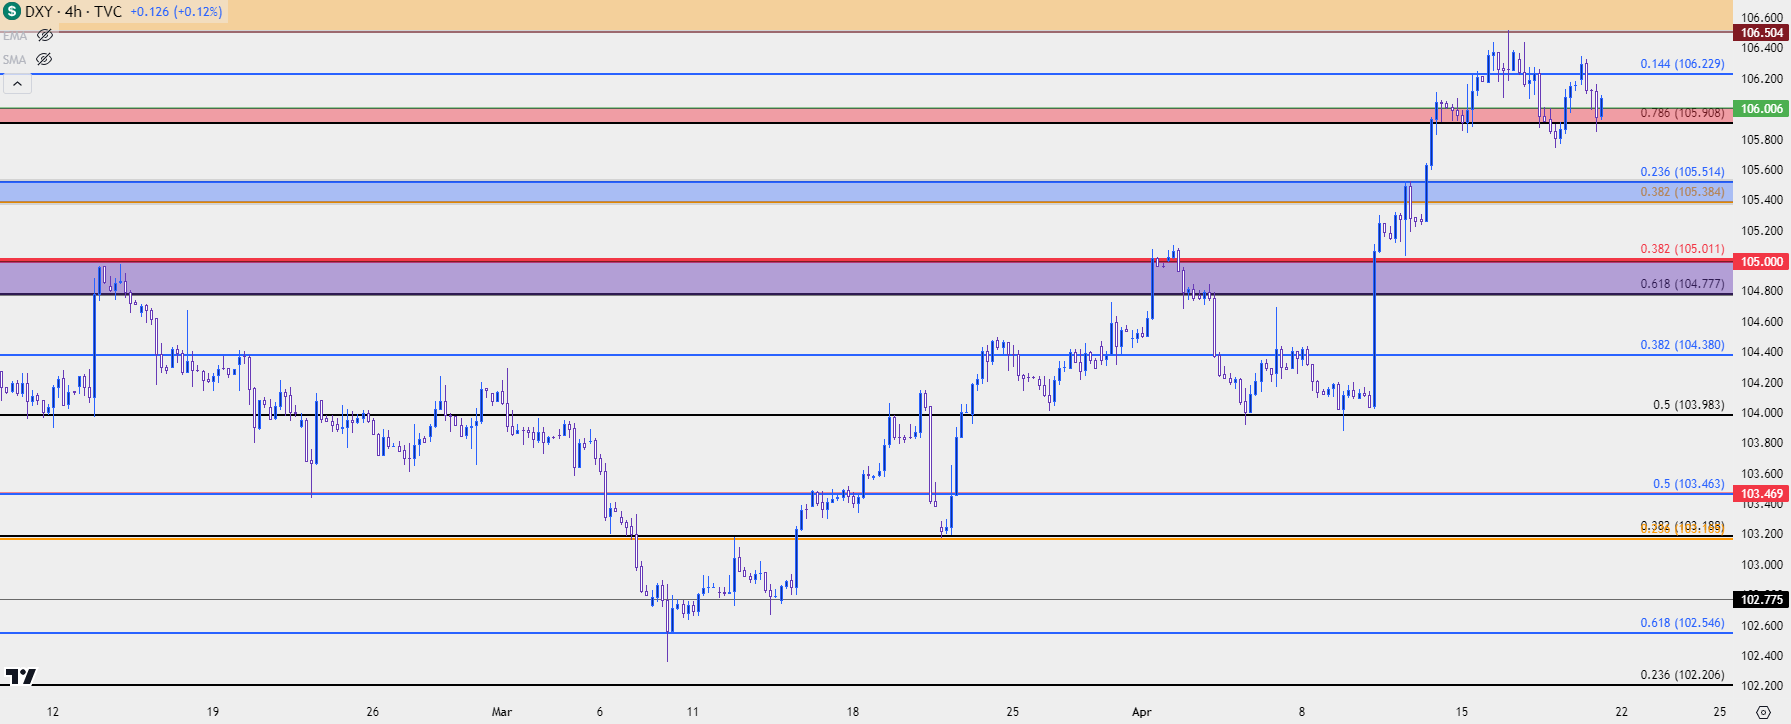 Chart prepared by James Stanley; data derived from Tradingview
EUR/USD
While there were strong trends in EUR/USD from 2021 through the first nine months of 2022; and then for the next three months as prices were snapping back, the pair has largely been range-bound since the 2023 open.
EUR/USD Weekly Price Chart
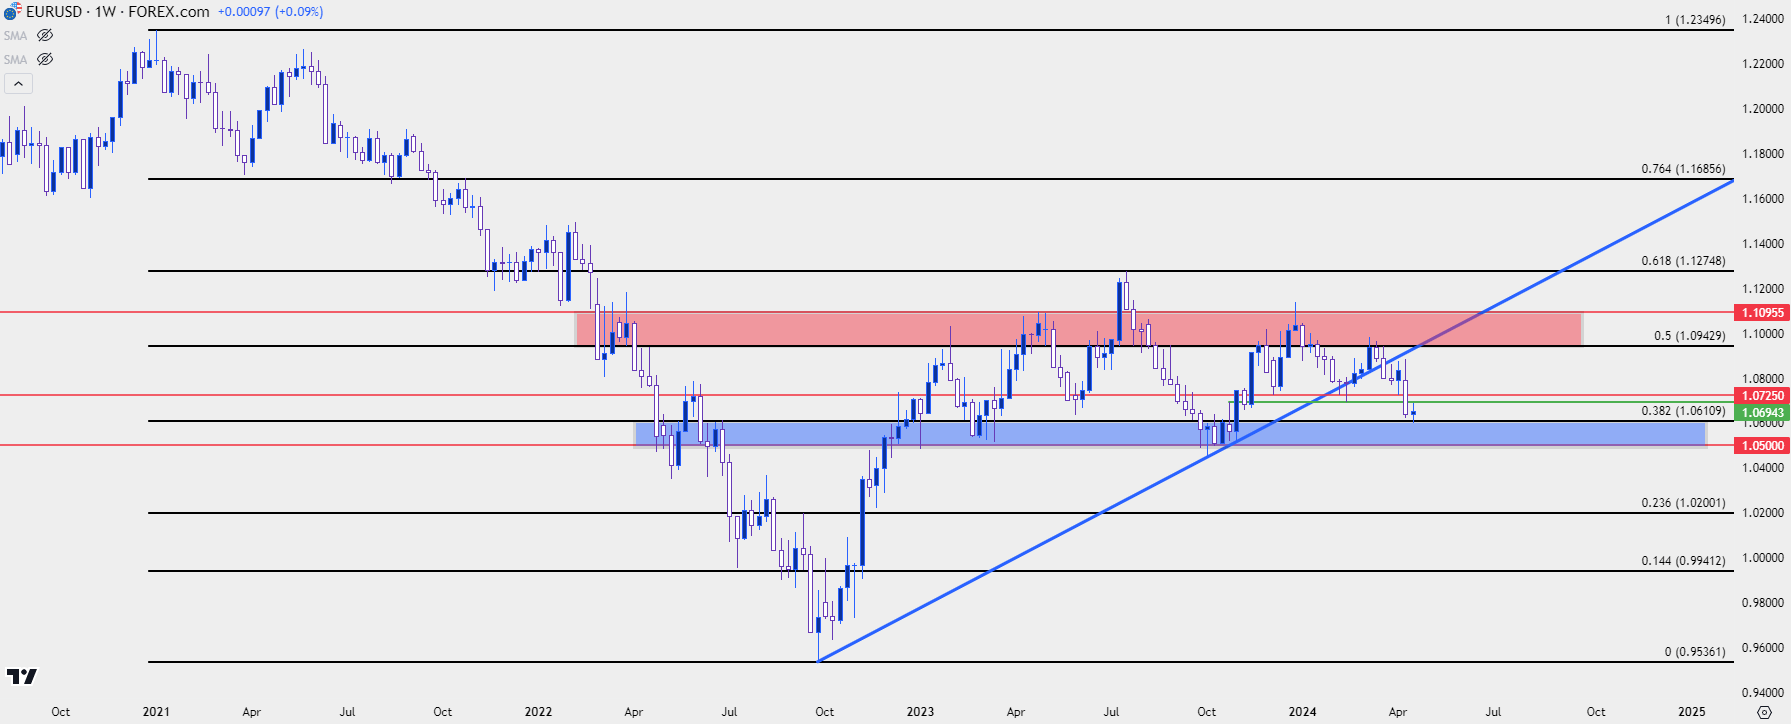 Chart prepared by James Stanley, EUR/USD on Tradingview
Messaging from the Central Banks has certainly played a role, as both the ECB and FOMC had been non-committal with both highlighting the possibility of cuts on the horizon. The deviation in data of late, however, has brought that into question and that has helped to push EUR/USD down to range support.
The 1.0611 level remains key as that was tested multiple times this week. That’s the 38.2% Fibonacci retracement of the same major move that caught the high last year at the 61.8% mark, and resistance in March at the 50% level.
Range support spans down to 1.0500, which was tested twice last year, and that remains a key spot for the week ahead regarding both the US Dollar and EUR/USD.
EUR/USD Daily Price Chart
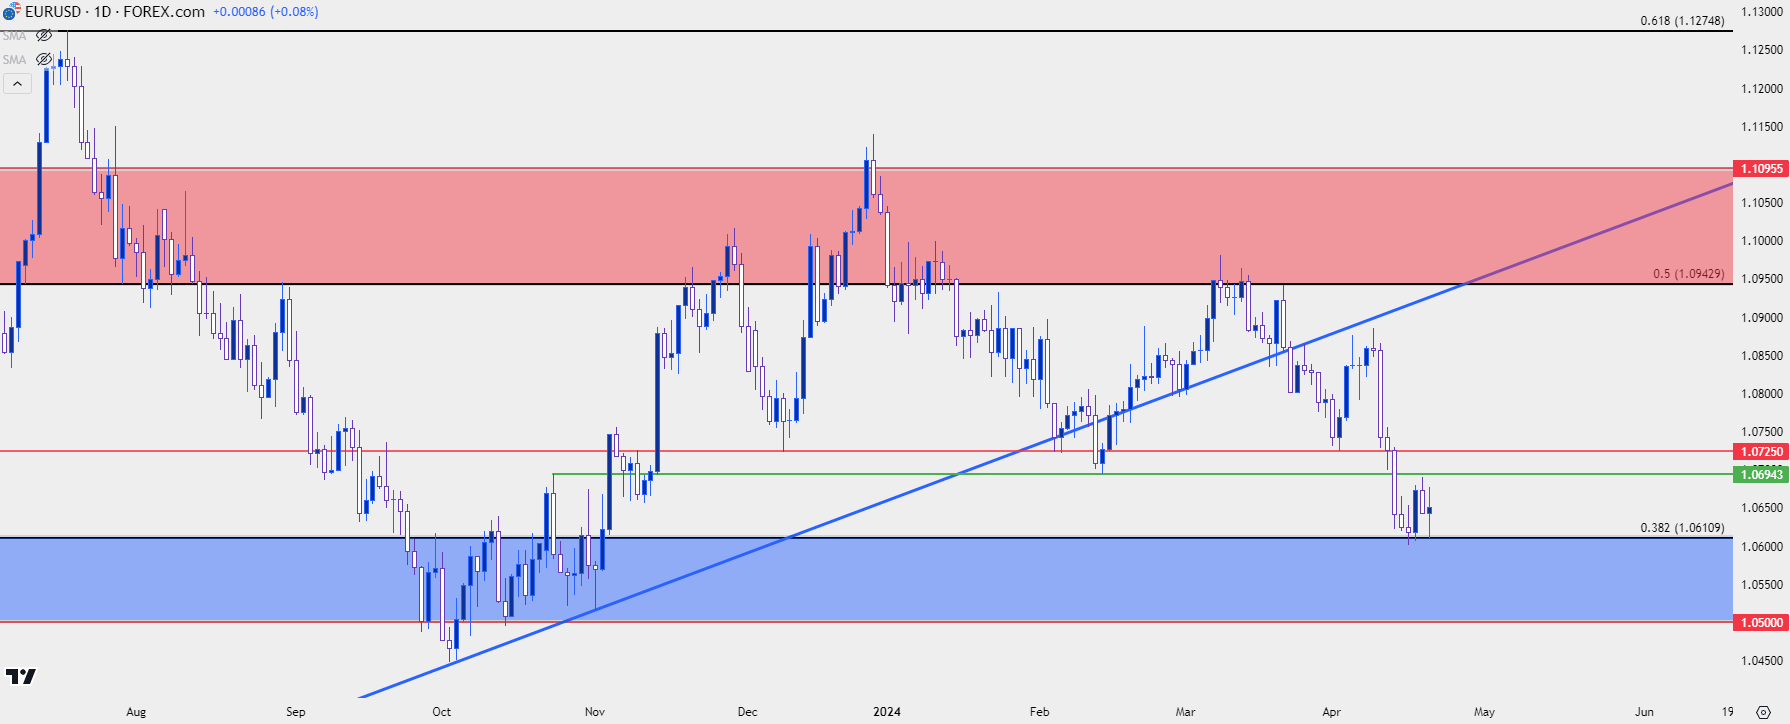 Chart prepared by James Stanley, EUR/USD on Tradingview
USD/JPY: Will the BoJ Jump?
USD/JPY pushed a breakout on the heels of the CPI print, and it didn’t take long for the pair to fly up to its next major psychological level at 155.00, which has since produced some stall.
I looked into this ahead of the breakout, after the BoJ rate hike last month which was the first such move since 2007. I said, “Given how long that resistance has held, then there’s probably some stops sitting above 152.00. Stops on short positions are buy-to-cover order logic, which means an influx of demand could hit the market upon that print of fresh highs. That could lead to a continuation in the move, and this is one of the reasons that a well-defended resistance level yielding to breakout can often push into a sharp topside move.”
With the 155.00 level coming in soon after the break and the move stalling, there’s an apparent fear of intervention; and we heard some commentary on that theme in the past week. But – the BoJ did not intervene yet and this means that we may see bulls push up to the next big figure, which has some historical relevance at the 160.00 handle. That was the last lower-high in 1990 before the pair went on a massive sell-off, hitting the 80-level just five years later.
USD/JPY Monthly Price Chart
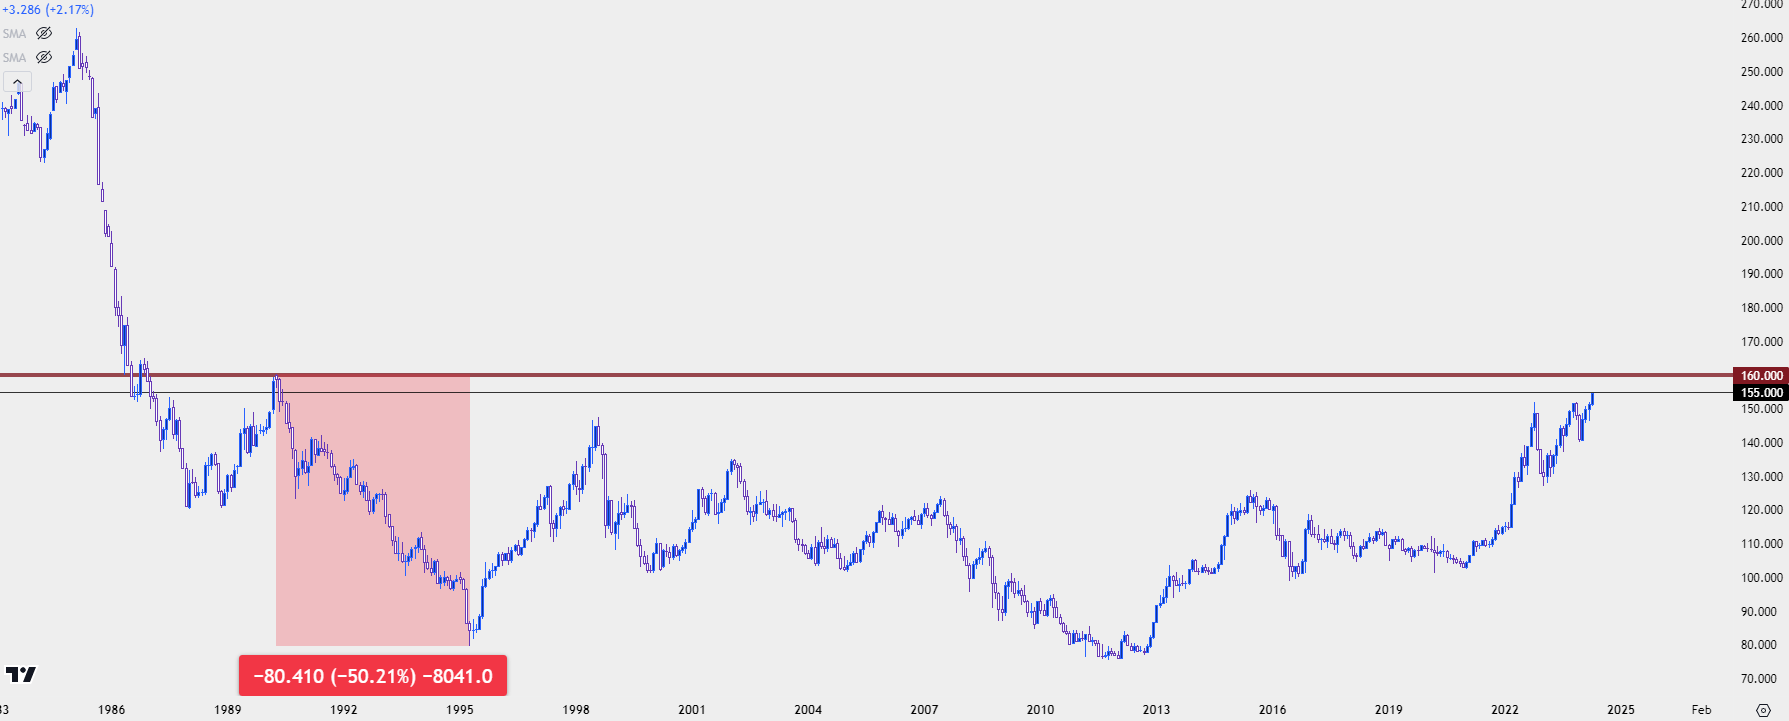 Chart prepared by James Stanley, USD/JPY on Tradingview
USD/JPY Intervention Dynamics
There is another side of this, however, and that’s largely drawn back to the fundamental divergence between the two economies.
The big fear of an intervention from Japanese policymakers’ side is that even if they did intervene, the impact may not last for long. Because we’ve seen two episodes of this already over the past couple of years and as long as the carry remains strongly-tilted to the long side of the pair, bulls can continue to be drawn into the matter.
So – the larger question – and something that can be spoken to next week at the BoJ’s rate decision, is whether the bank may have tolerance for more hikes in the near-term. That’s something that could begin to turn the fundamental divergence that’s driven the pair to fresh 34-year highs. Otherwise, USD/JPY may soon revisit that 160.00 handle that hasn’t been in-play since 1990.
USD/JPY Daily Chart
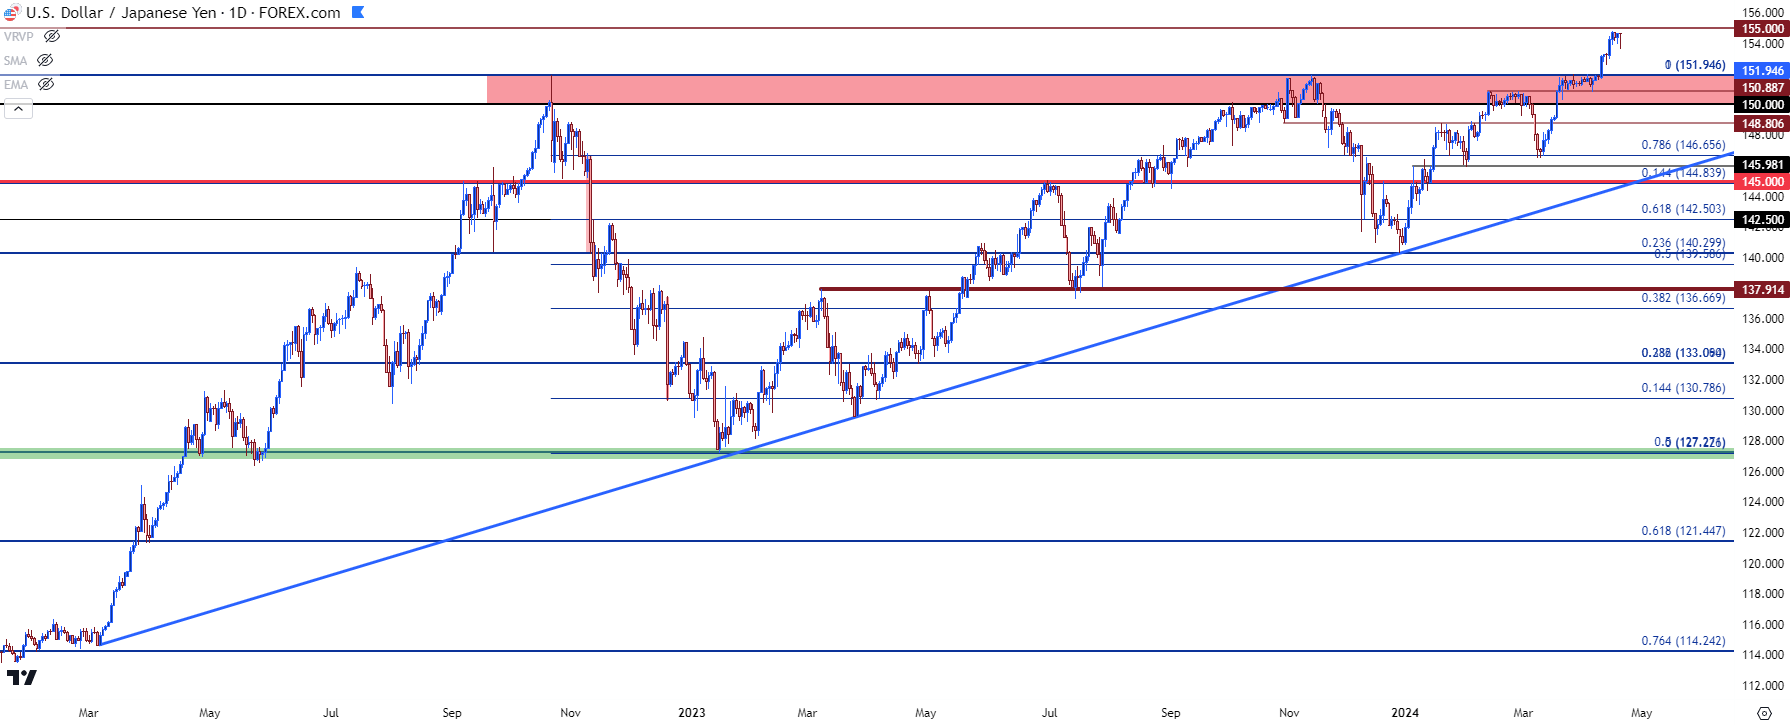 Chart prepared by James Stanley, USD/JPY on Tradingview
USD/CAD
USD/CAD has started a re-test of a key spot of resistance, the same that’s helped to hold the highs since the second-half of 2022 trade.
With the Bank of Canada lining up for possible rate cuts in June, while expectations for U.S. cuts get pared back, there’s been a similar fundamental deviation between the two economies as what was looked at above in EUR/USD. This has allowed the pair to push up to that key sopt of resistance, and for the weekly bar so far, that’s led to stall as there’s currently a doji sitting just underneath that resistance.
USD/CAD Weekly Price Chart
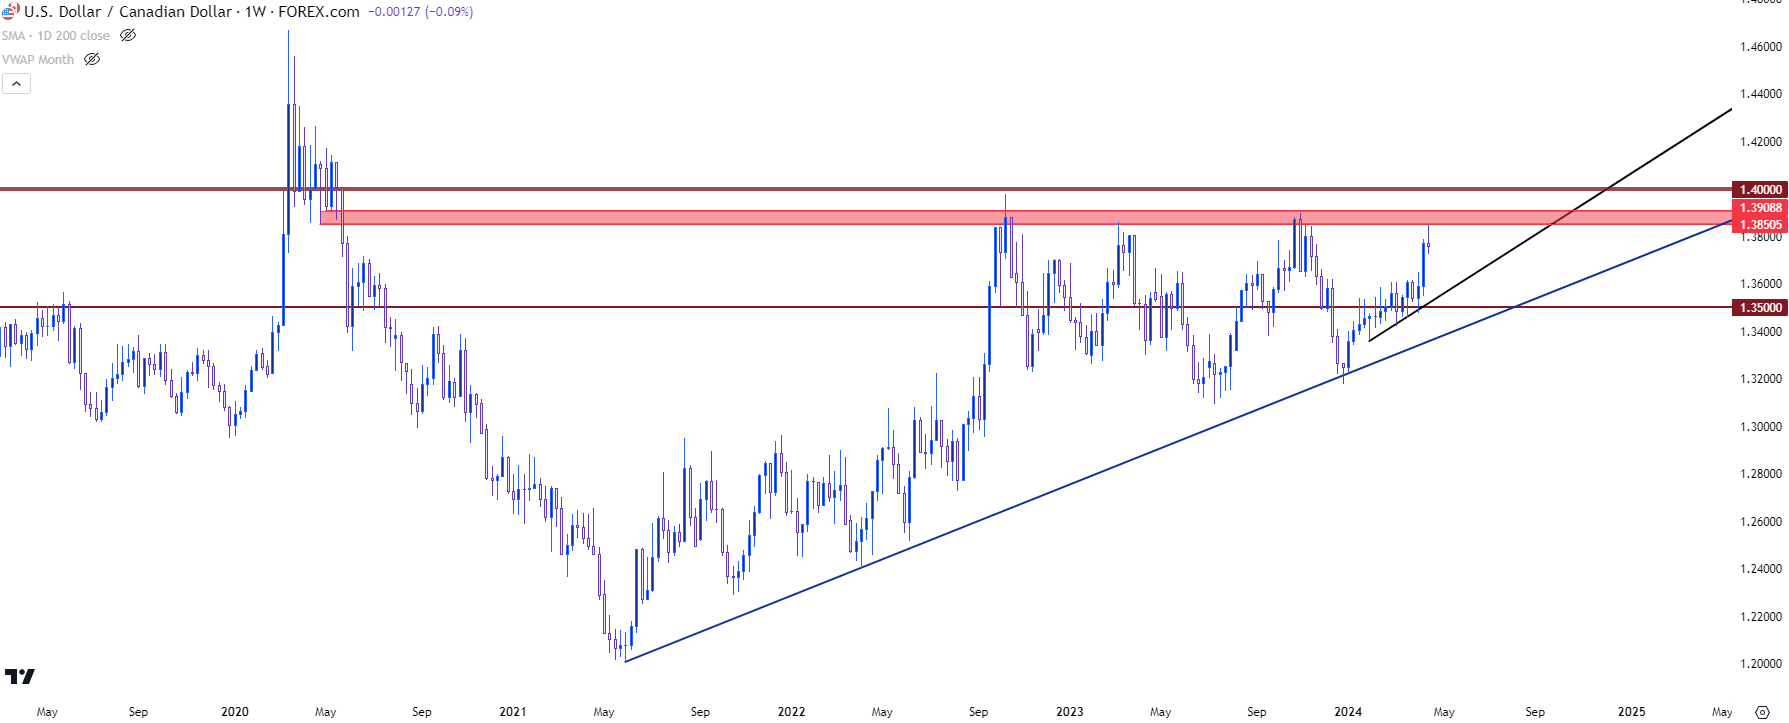 Chart prepared by James Stanley, USD/CAD on Tradingview
USD/CAD Shorter-Term
If we do see USD/CAD pullback from that longer-term resistance, there’s a key spot of support sitting just below around the Fibonacci level that plots at 1.3652, and below that, there’s another spot of possible higher-low support around the 1.3600 handle.
USD/CAD Daily Price Chart
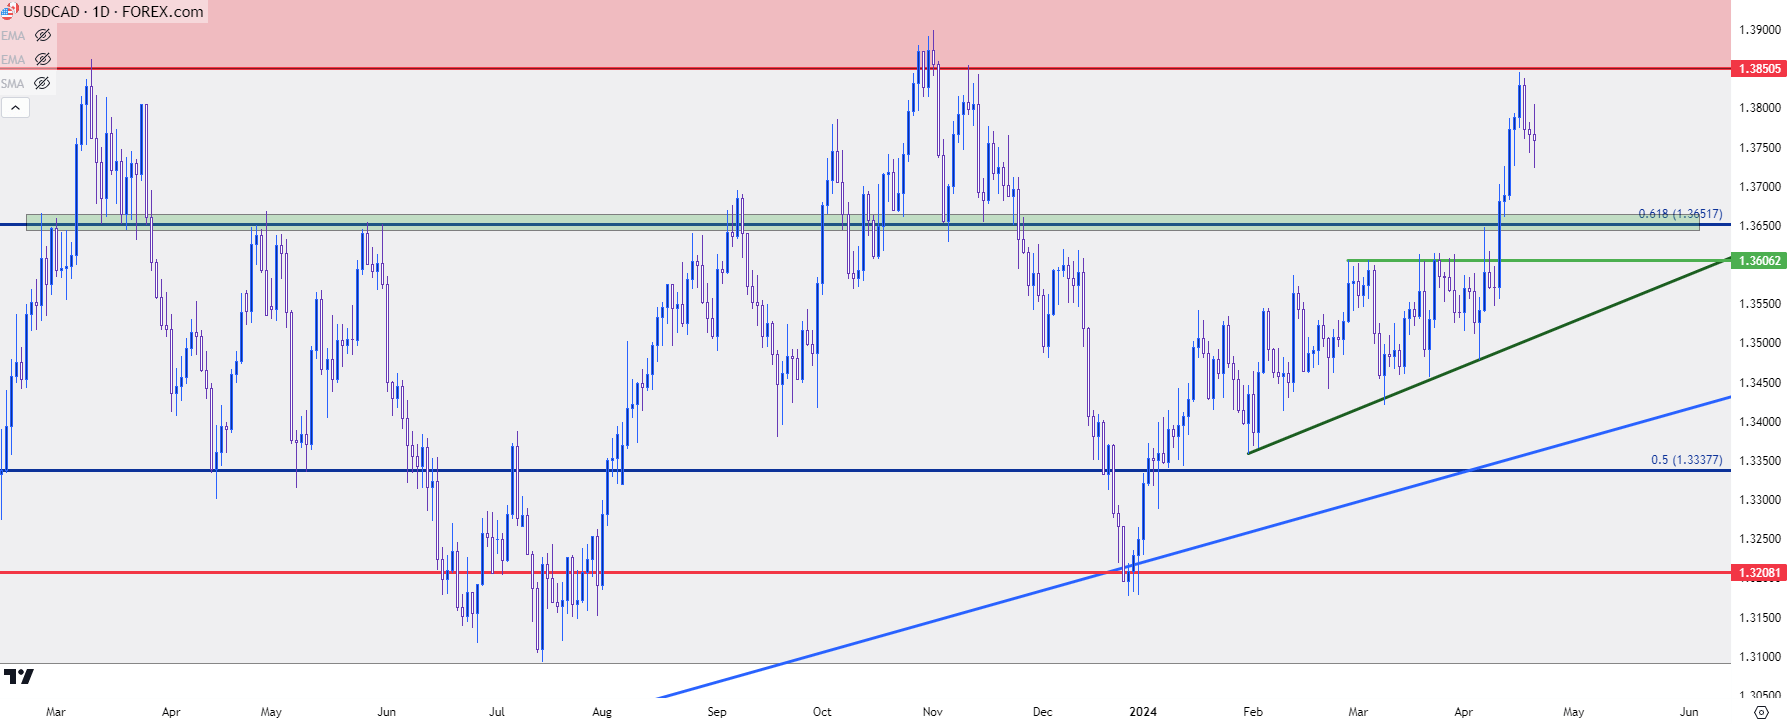 Chart prepared by James Stanley, USD/CAD on Tradingview
Gold (XAU/USD)
Gold saw another failed breakout at the $2,400 level this week, and the second instance has come along with a lower-high. Normally, this is around the time that deeper pullback potential would present itself, but the other side of the argument is that bulls have remained very active near support.
To be sure, there were pullbacks this week. And by and large they were pounced on, such as the Monday inflection at $2326 or the Wednesday test at $2,353.
On Friday morning, after the failed breakout, another higher-low presented itself at the $2,380 level, which gives the appearance that bulls aren’t yet done with the matter.
I wrote about this in a gold article yesterday when discussing the argument around whether it’s topped, and as I shared there the $2,500 level sitting overhead remains a spot of interest if bulls can keep control long enough to run the breakout. If that level comes into play next week, we may be looking at some overbought conditions as we head into the FOMC meeting a week later.
Gold (XAU/USD) Four-Hour Price Chart
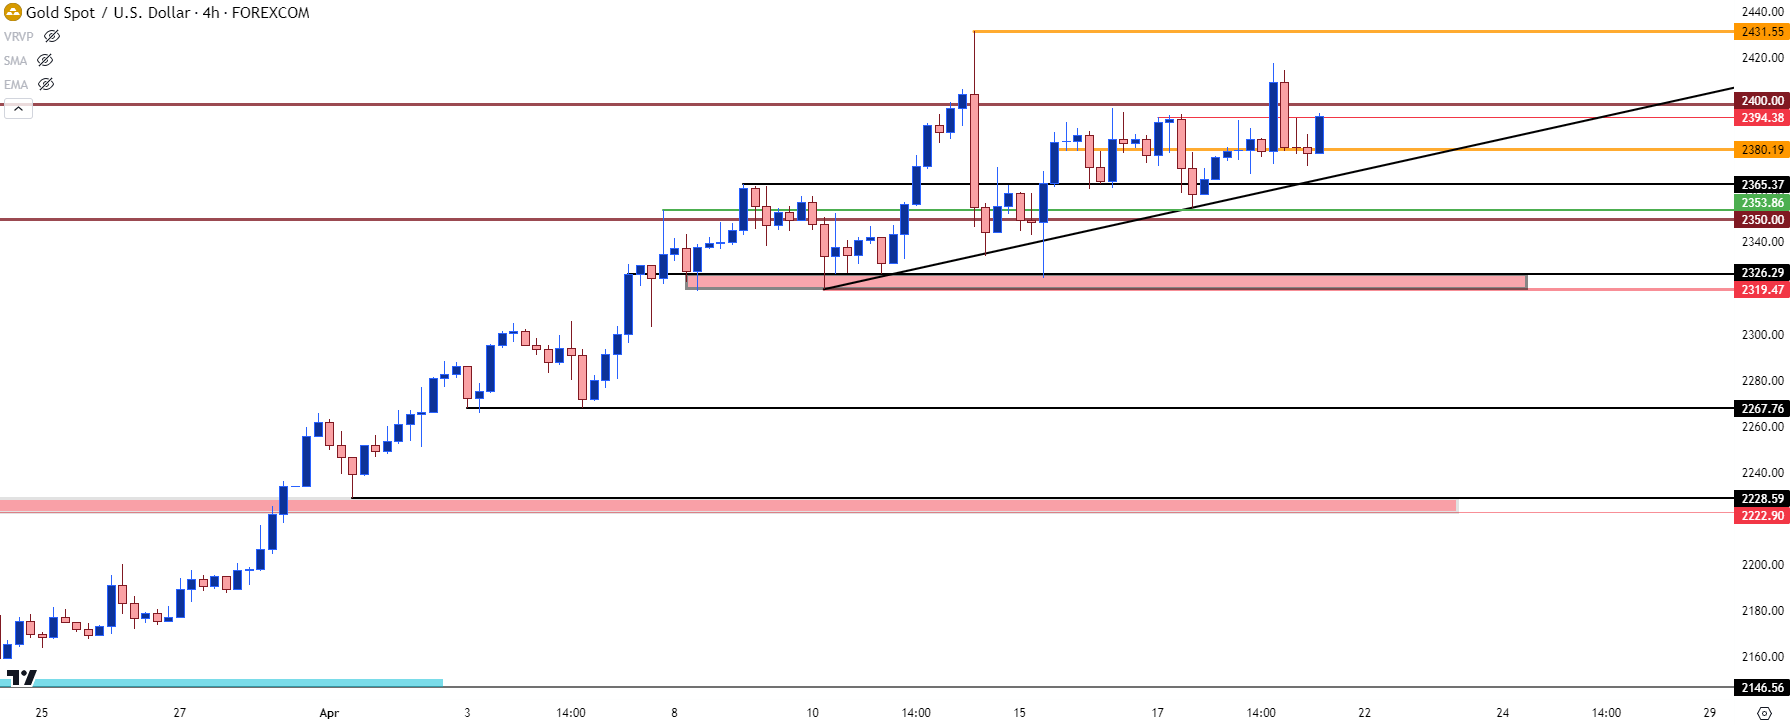 Chart prepared by James Stanley, Gold on Tradingview
--- written by James Stanley, Senior Strategist


