
U.S. dollar Talking Points:
- The U.S. dollar has just completed its strongest two-day rally in a year. Interestingly that prior instance also showed around an NFP report released in early-February, and in 2023 the high came in at the 103-handle in DXY. That was support ahead of the most recent February NFP report, before the currency launched higher on the back of a strong jobs report.
- EUR/USD weakness has been prominent as the pair tests the 2.5 month low at 1.0725, finally pushing below the 200-day moving average. That could remain as one of the more attractive bullish-USD setups, while USD/JPY could be one of the more attractive majors for scenarios of USD-weakness, explained further below.
- I’ll be discussing these themes in-depth in the weekly webinar on Tuesday. It’s free for all to register: Click here to register.
Jerome Powell was a bit less-dovish at last Wednesday’s rate decision. It really seemed to me like he was trying to rein bulls in after there was a massive pricing of rate cuts for 2024. But there remains complications with that, namely the fact that employment data has remained fairly strong with the unemployment rate sticking at 3.7%. The Average Hourly Earnings portion of the report points to wage growth, and that also impressed with a massive print of 4.5% annualized against an expectation of 4.1%. That speaks to inflation, which is the other side of the Fed’s dual mandate and that similarly isn’t something that’s screaming for rate cuts. And yet, still, markets are expecting at least five 25bp rate cuts to a current 68.7% probability.
FOMC Rate Probabilities at End of Year
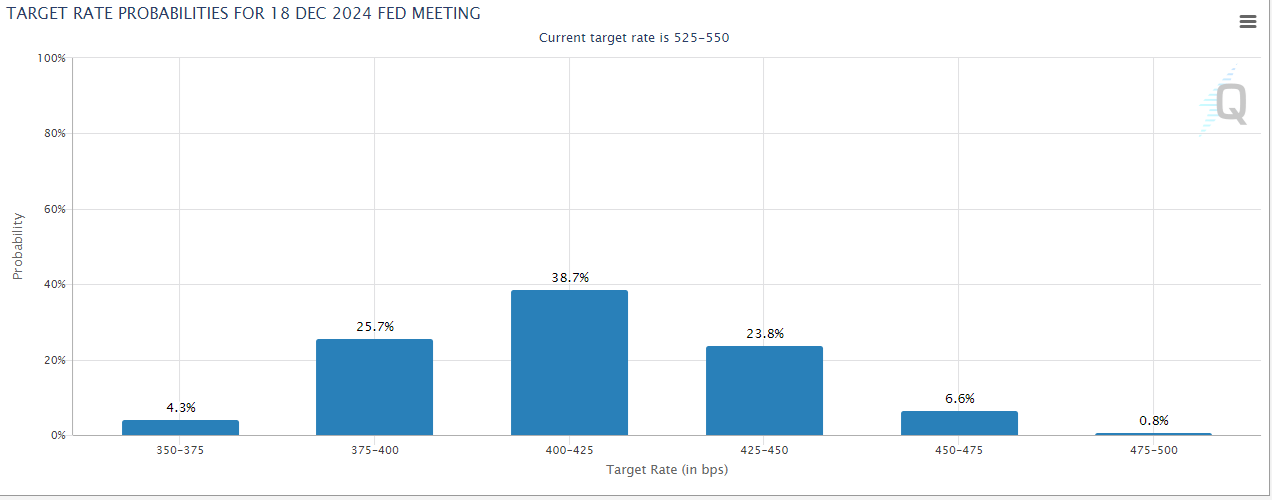 Chart prepared by James Stanley; data derived from CMEFedwatch
And then if we look elsewhere, equities remain in a very strong position near all-time-highs and as I shared in this week’s forecast, taking one look at what happened in Meta on Friday highlights that the primary fear that’s showing at the moment is the fear of missing out. FOMO can drive a market cap boost of $200 billion or more, as we saw at the end of last week and this highlights sentiment, in my mind, which would be somewhat of the opposite of what’s shown in the USD over the past couple of days.
But, from the chart, the move has been aggressively strong as noted in the talking points, with the greenback showing its strongest two-day spurt in over a year. Also in that category is the fact that DXY is now working on its sixth consecutive green weekly bar, which is somewhat abnormal. Getting seven or eight consecutive weeks of strength is rarer, but as we saw last year such a one-sided run in the greenback can create ramifications elsewhere. Last year the USD put in 11 consecutive weeks of gains before stalling in October and, eventually, reversing in November on the back of a more dovish Fed.
But now that we have some strong data and a more cautious Powell that’s not yet ready to commit to rate cuts we’ve been seeing the USD go the other way.
U.S. Dollar Weekly Chart
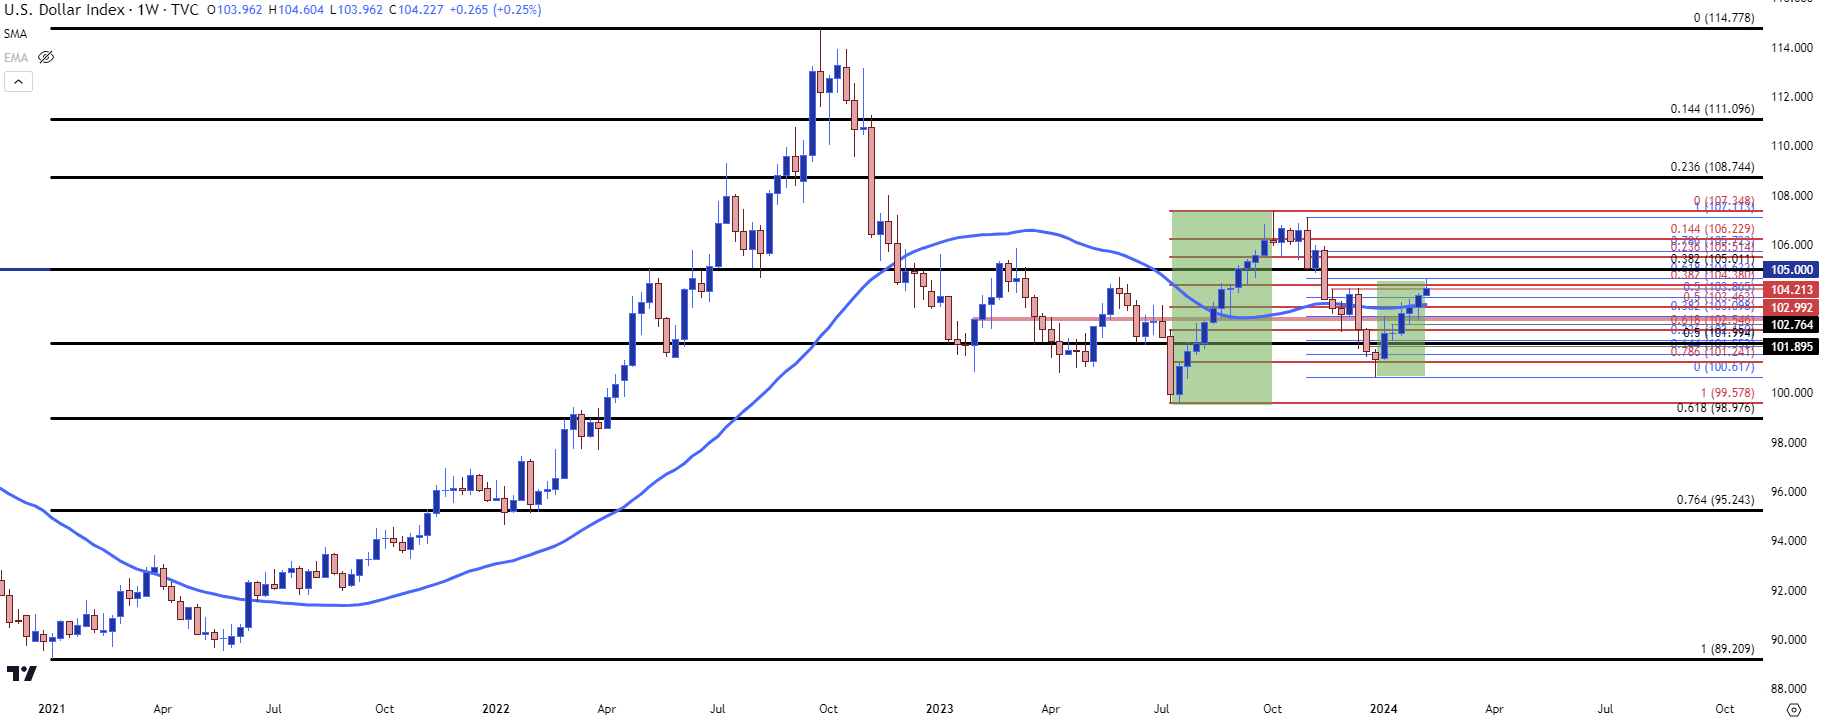 Chart prepared by James Stanley; data derived from Tradingview
U.S. Dollar Structure
Bulls have an open door here, but there would need to be some element of higher-low support to show up to keep that door open and all we have right now is a sharp two-day breakout. As highlighted in the webinar, there’s a plethora of areas for that to come into play.
The 200-day moving average sticks out as important. I wrote an article on that indicator about a month ago and then a week later it was in-play on DXY, helping to hold the highs for almost three weeks until last week’s breakout. That becomes a big spot of higher-low support for bulls to defend in the event of a pullback as it’s confluent with prior resistance. There’s also the 103.87 level that remains of interest as this is the 50% mark of the sell-off that started at last November’s FOMC rate decision and this similarly helped to hold highs until last Friday’s breakout.
The more aggressive level at 104.21 is already in-play and this is taken from a late-November swing-high, synced up to the Fibonacci level at 104.38.
U.S. Dollar Daily Price Chart
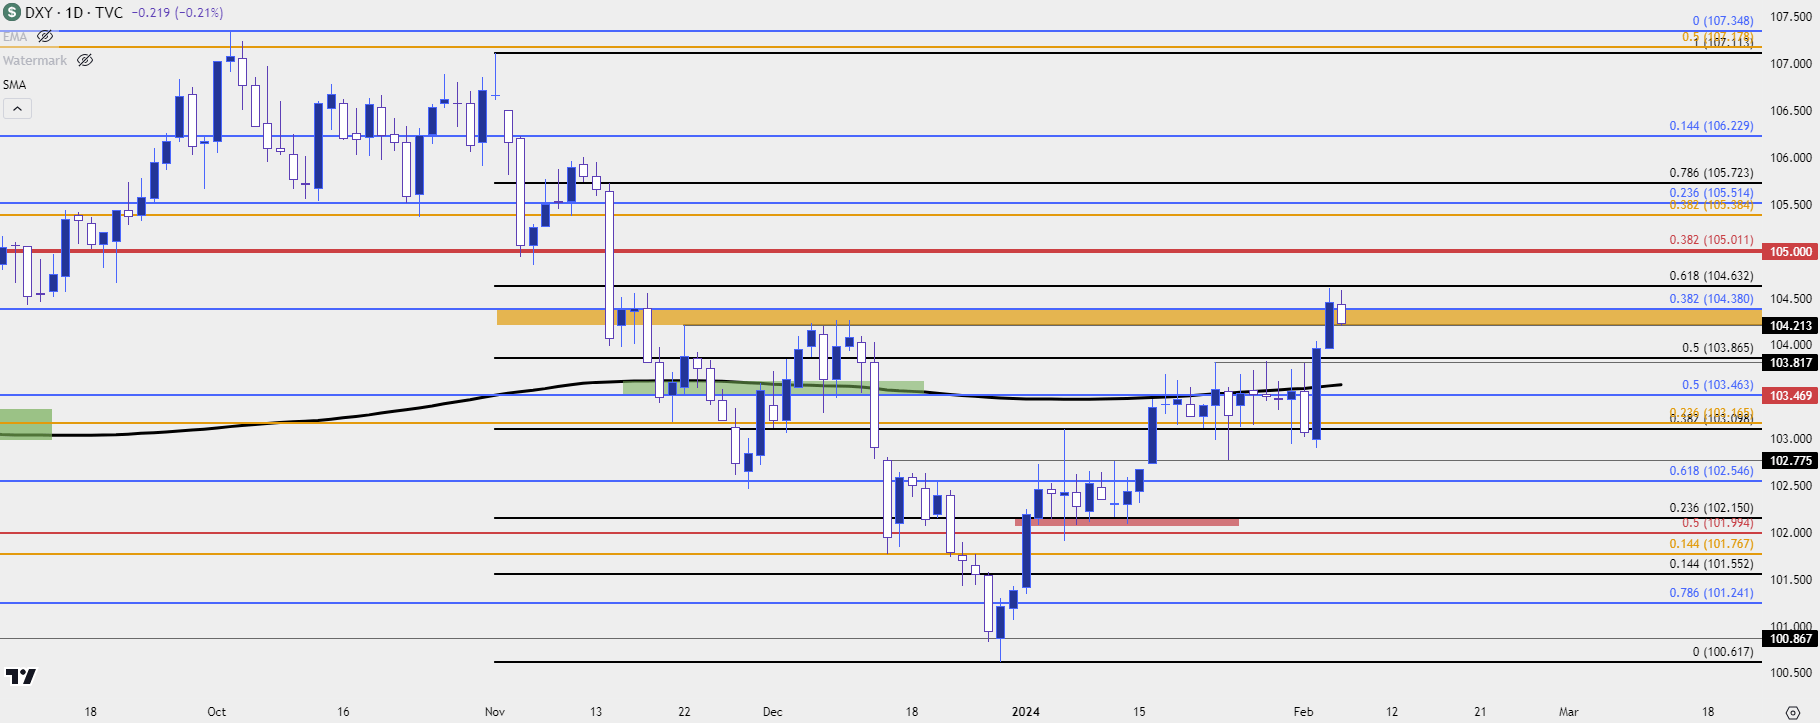 Chart prepared by James Stanley; data derived from Tradingview
EUR/USD
I think EUR/USD remains one of the more attractive major pairs for bullish-USD scenarios, and this can even come along with the longer-term range that’s been in-play on the pair for more than a year. The bottom side of that range is around the 1.0500 handle and just above it is a confluent spot with quite a bit going on from 1.0610-1.0643. Below is the weekly chart highlighting that range, along with a key trendline that’s started to come into play that’s drawn from 2022 and 2023 swing lows.
EUR/USD Weekly Chart
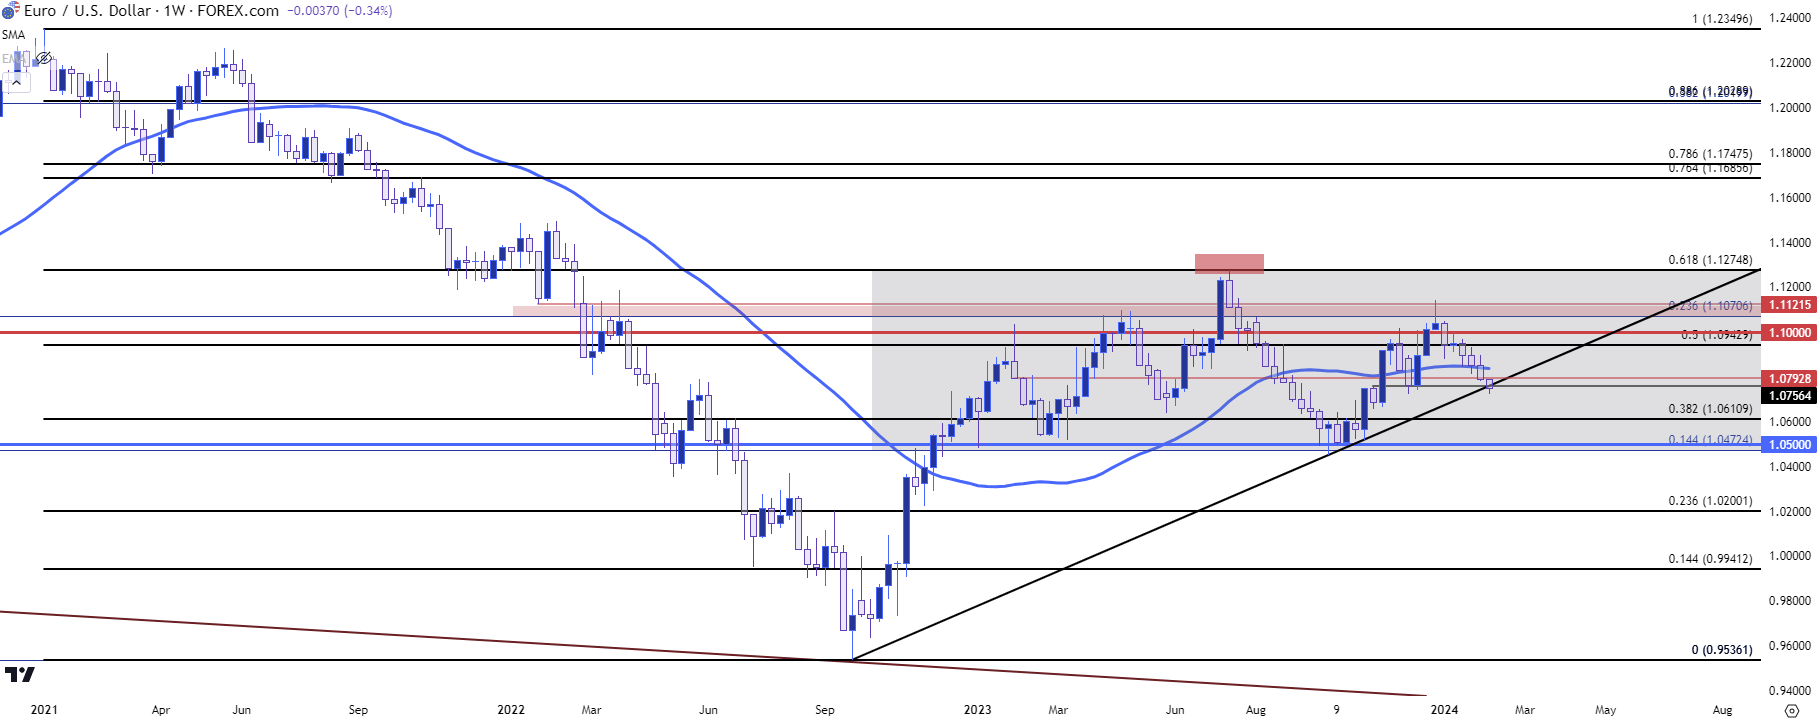 Chart prepared by James Stanley, EUR/USD on Tradingview
From the daily chart below we can get better view of that range and the current low is holding around the same spot that held the December low at 1.0725. The support zone between 1.0610 and 1.0643 remains key, and along the way there are swings at 1.0694 and 1.0668.
On the resistance side of the coin, and for those looking to sell pullbacks in the pair, much like the USD/DXY above there’s an ideal place for that to show to keep the door open for continuation – and that’s at the same 200-day moving average that was holding support until last Friday’s breakdown.
That plots at the underside of another zone that runs up to 1.0862.
EUR/USD Daily Price Chart
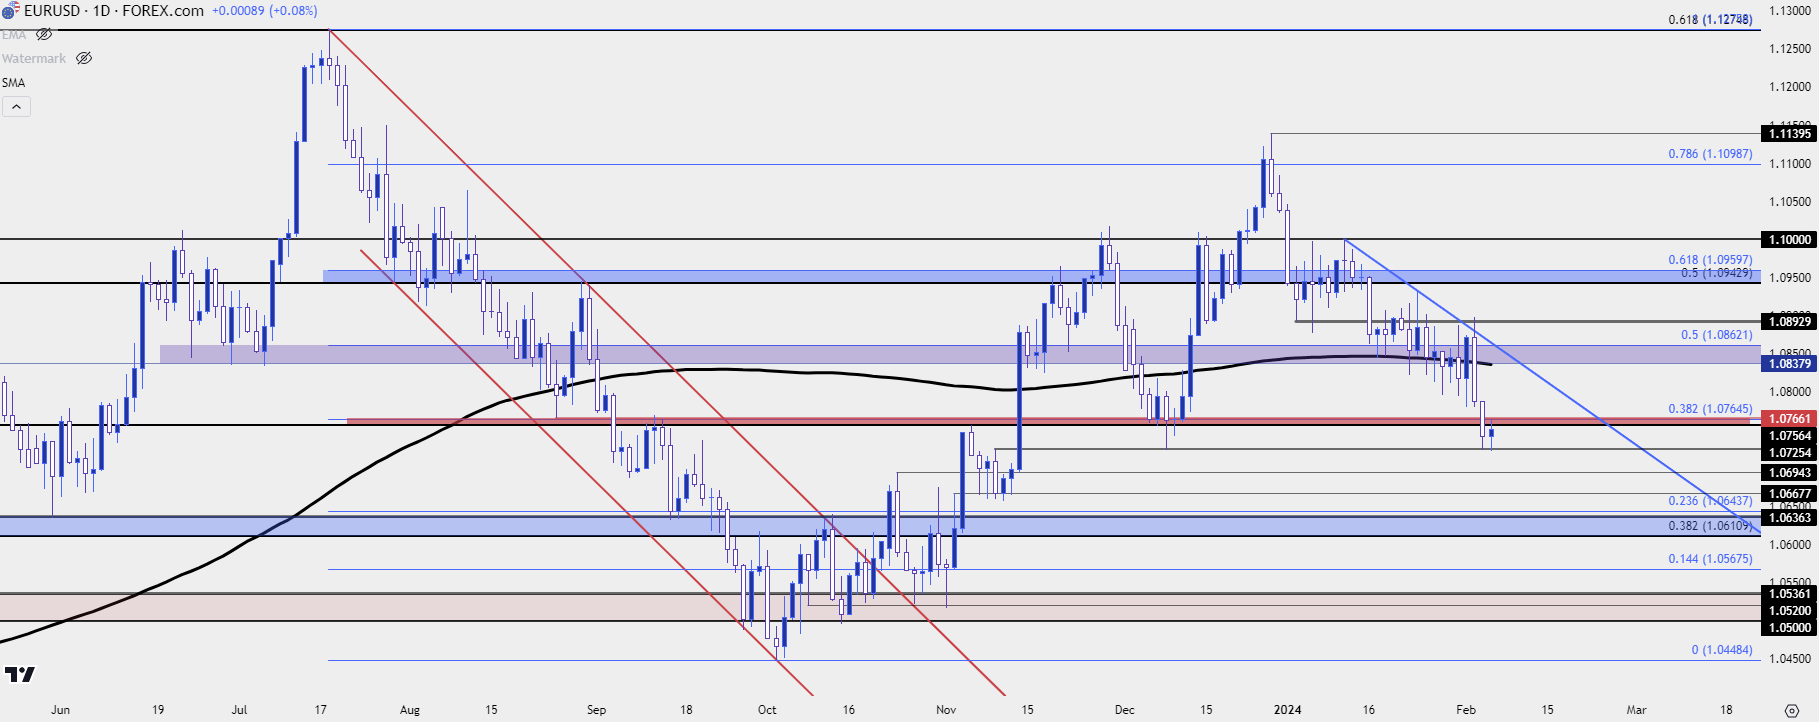 Chart prepared by James Stanley, EUR/USD on Tradingview
GBP/USD Breakdown
Until last Thursday’s Bank of England rate decision the British Pound had held up incredibly well to that early-year USD-strength. But a dovish BoE came by surprise, especially considering where inflation still is and that led to some bulls unloading and price has posed its first test of the 200-day moving average.
At this point there’s been a bounce from that fresh two-month low and there’s a resistance test at prior support, taken from the 1.2590-1.2614 zone. This would keep the door open for those looking for bullish continuation in the USD.
GBP/USD Daily Price Chart
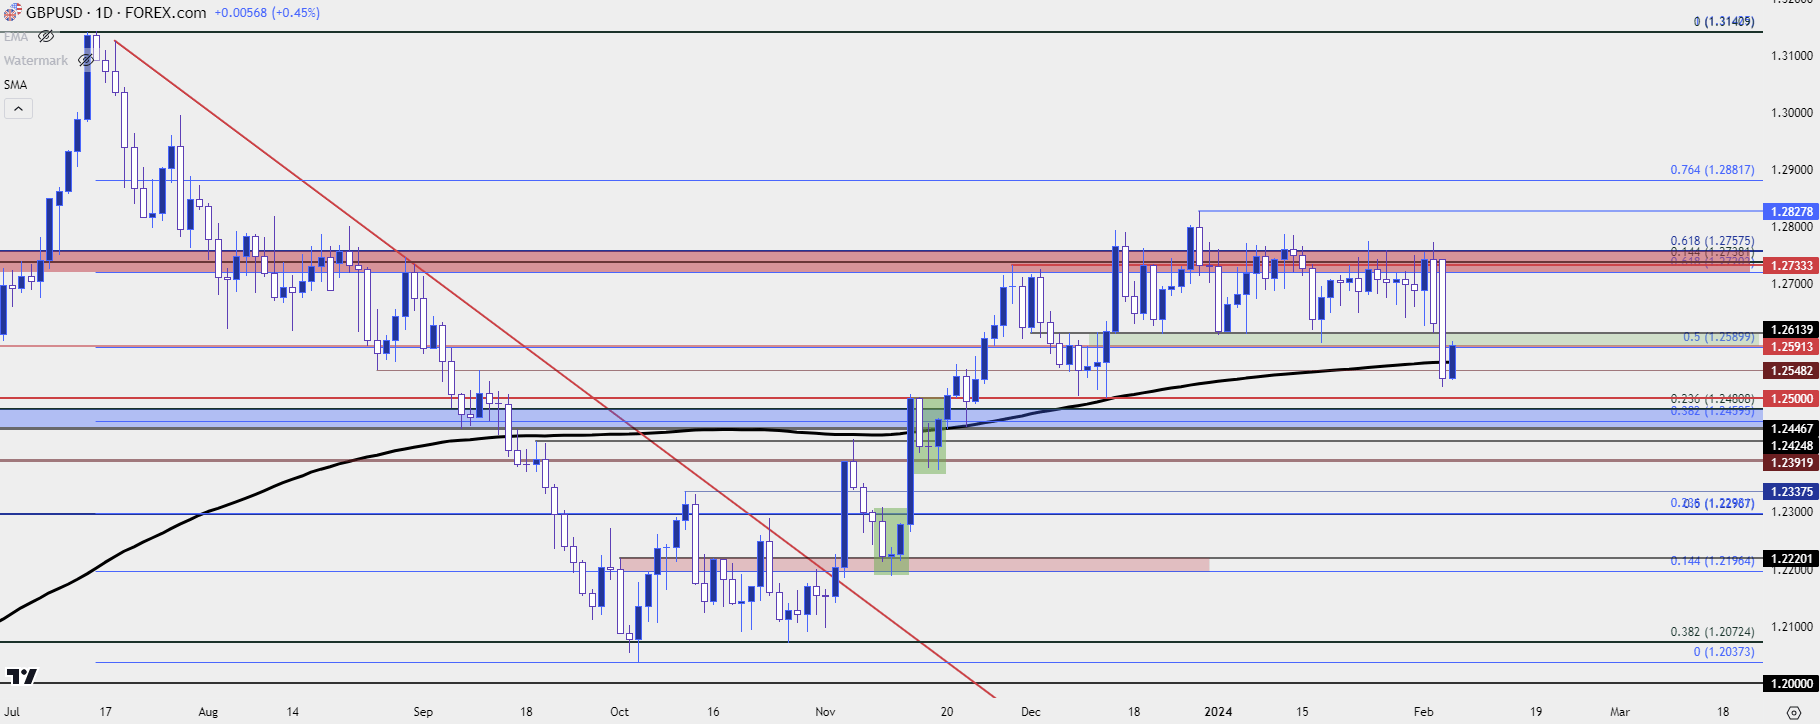 Chart prepared by James Stanley, GBP/USD on Tradingview
USD/JPY
I’ve been saying so far this year that USD/JPY has acted like an amplified U.S. Dollar. And as USD strength was on its way back in early-January trade this made sense as USD/JPY clawed back prior losses that posted after the CPI report that was released in November.
But now that price is getting closer and closer to the 150-zone that’s brought the ire of the Japanese Finance Ministry over the past couple of years the long side of the pair appears to be lagging behind the strength that’s shown in DXY.
USD/JPY could still be one of the more attractive venues in the event of USD-weakness, largely on the basis of that carry unwind theme that could remain in-play. But with the USD showing strength so far in 2024 trade that motive has been subordinated behind the carry.
From the weekly chart below we can see two consecutive weeks of indecision with a resistance hold at prior support of 148.81.
USD/JPY Weekly Price Chart
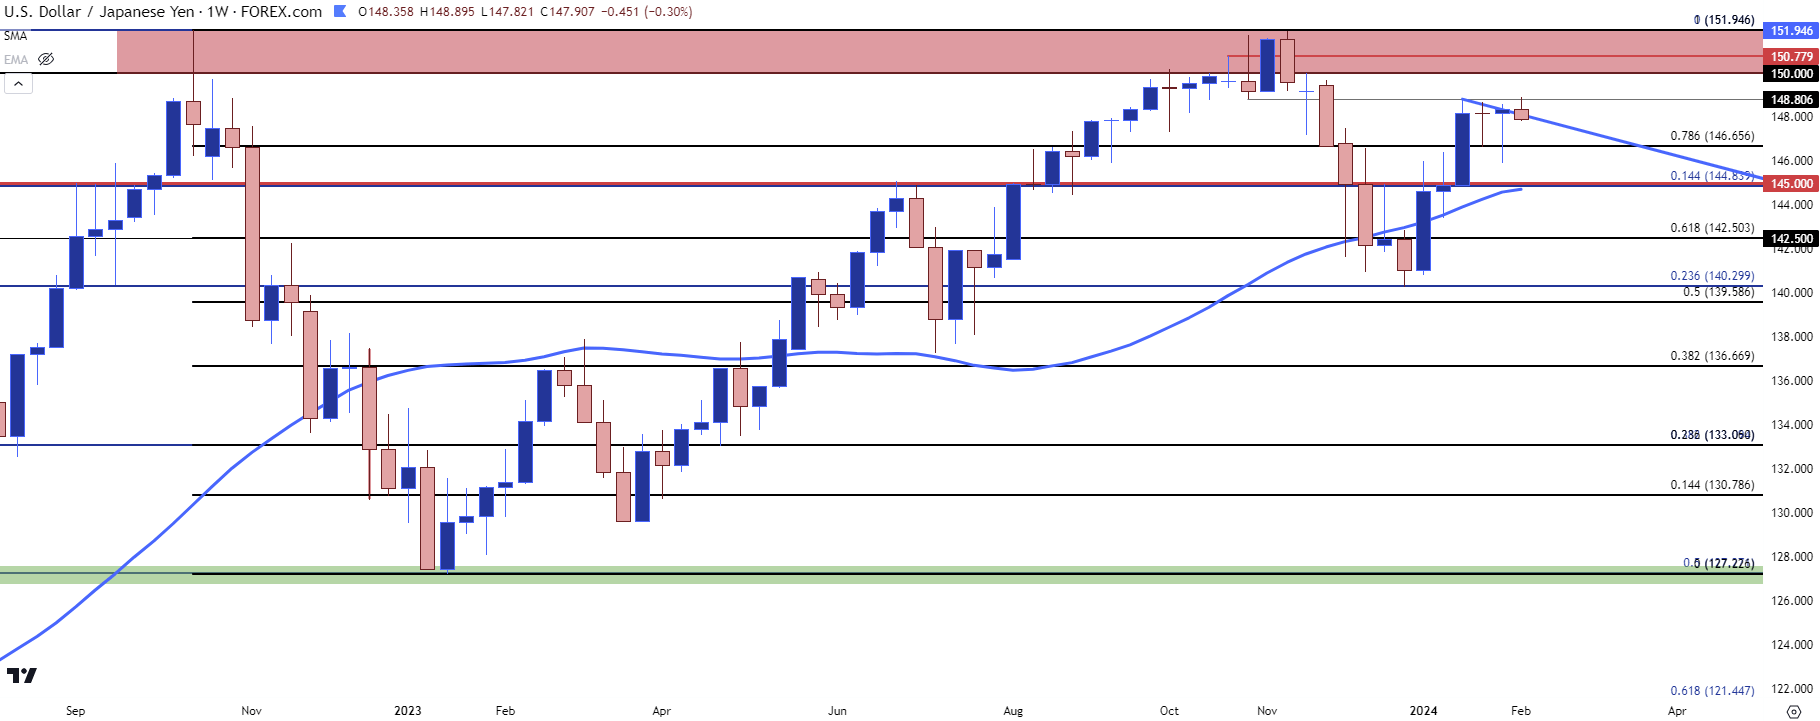 Chart prepared by James Stanley, USD/JPY on Tradingview
From the chart below we can see some levels of interest. The big one underneath current price action is at 145.00, which is now confluent with the 200-day moving average. Along the way there’s a Fibonacci level at 146.66 and a prior resistance-turned-support swing at 146.00.
On the topside of price, if bulls force a push then they get to deal with the same 150/152 resistance area that’s held highs over the past two years. And at that point the attention would likely shift towards Japanese policy makers to see if anything has changed from the past two years.
USD/JPY Daily Price Chart
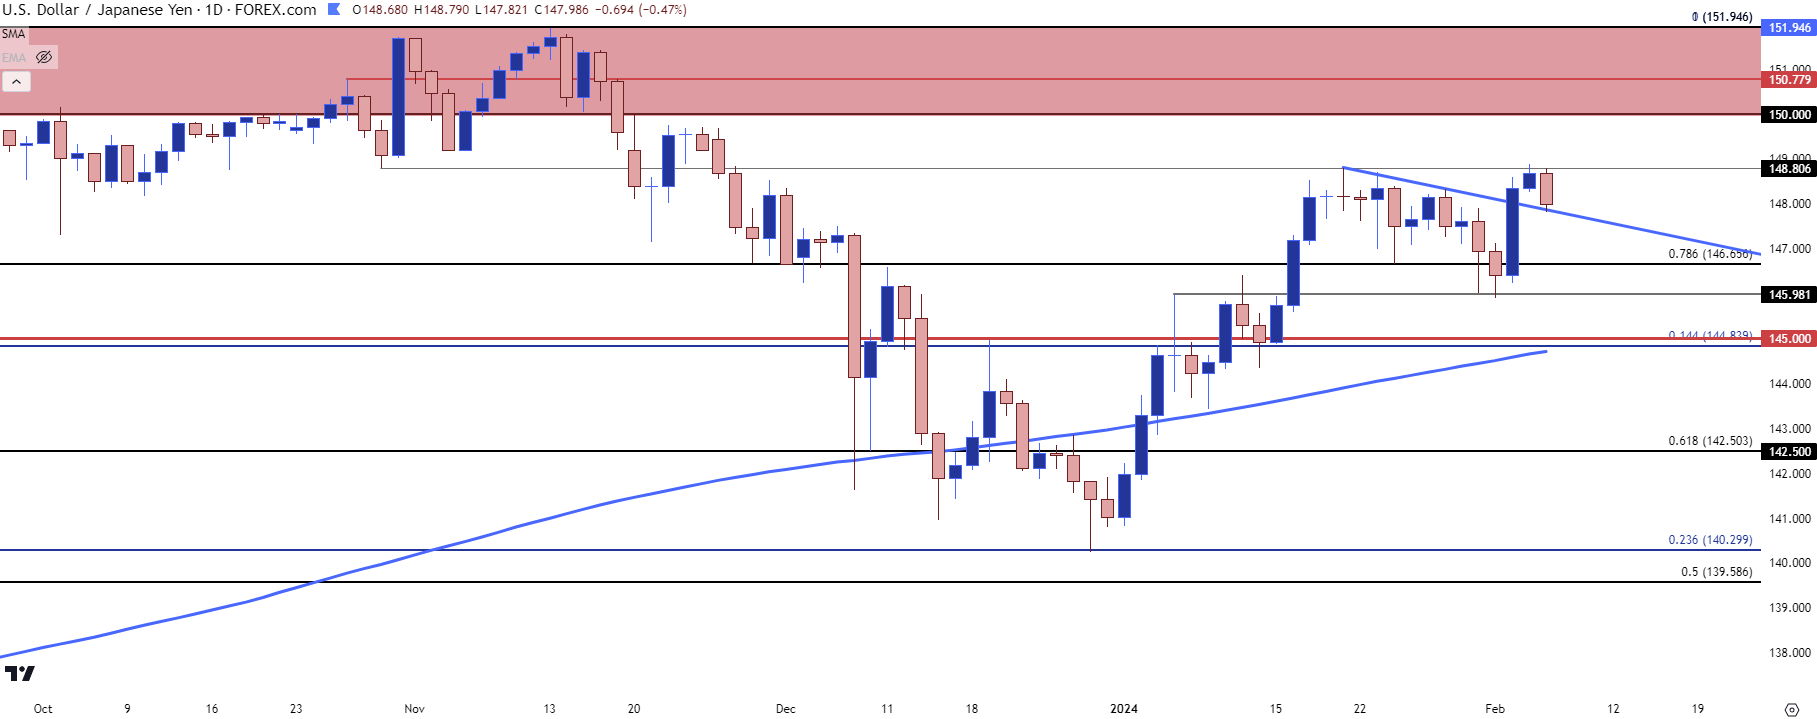 Chart prepared by James Stanley, USD/JPY on Tradingview
Gold (XAU/USD)
I remain of the mind that the strong bullish trend above the $2k handle will take place after the Fed formally flips. That does not appear to be the case around the Fed right now, although there is still a chance for such and I think that chance is why gold has been able to hold above the $2k level so far this year in 2024.
Like we saw on Friday on the back of strong U.S. data that can show up quickly but it hasn’t shown up in gold, not yet at least.
First the longer-term range: Price remains at the resistance side of this formation as it has for a couple of months now. The falling wedge began to show breach last week although bulls didn’t get very far as they were caught at the same resistance at $2,060 that’s been in-play.
Gold (XAU/USD) Weekly Price Chart
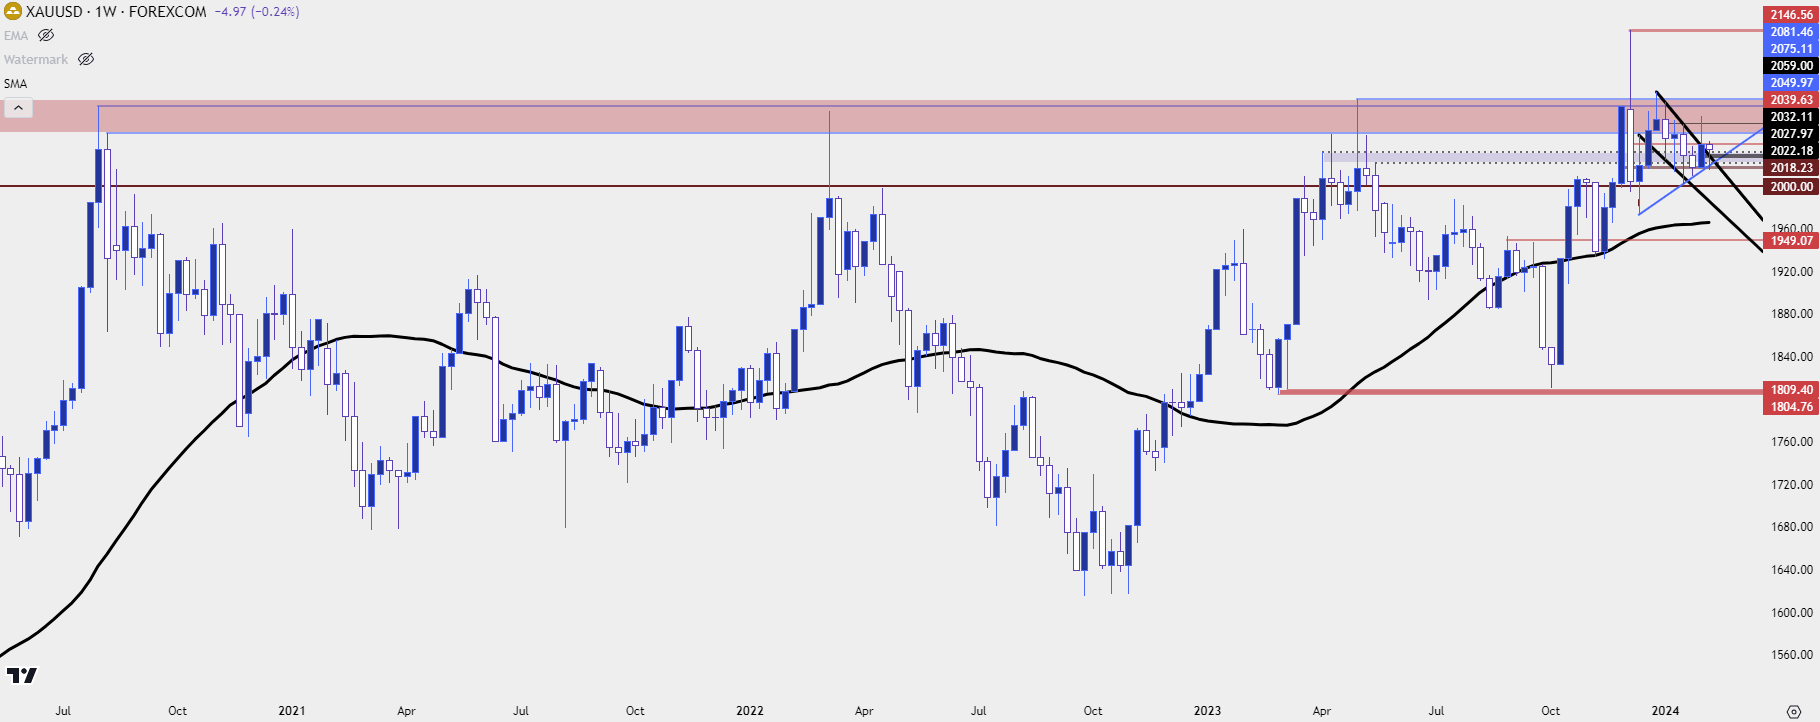 Chart prepared by James Stanley, Gold on Tradingview
From the daily chart we can see that near-term bullish structure. The falling wedge was broken early last week and bulls continued to push around the FOMC rate decision and through Thursday trade. The NFP report was a quick jolt and that continued through yesterday, with support eventually showing at a confluent spot, taken from both the resistance side of the falling wedge as well as a bullish trendline projection taken from December and January swing lows.
XAU/USD (Gold) Daily Price Chart
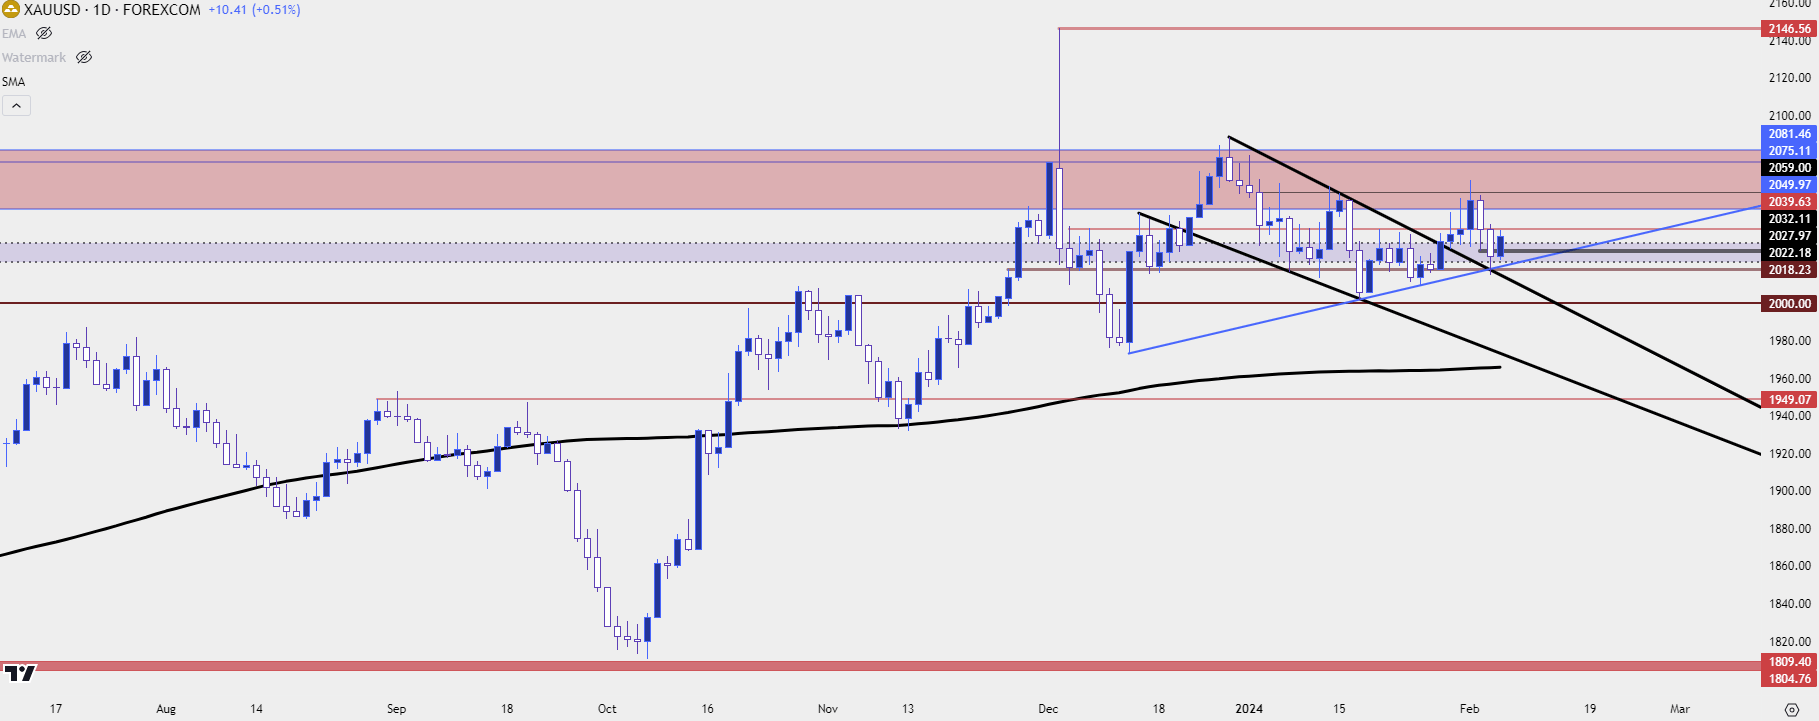 Chart prepared by James Stanley, Gold on Tradingview
--- written by James Stanley, Senior Strategist


