
U.S. Dollar Talking Points:
- There is one more major data release before the end of Q1, and that’s Core PCE set to be released tomorrow morning, on Good Friday.
- That’s also the final trading day of Q1 and many exchanges are closed in observance of the holiday, which can spell for slippery conditions in Spot FX, particularly if that print comes out far off of the expectation.
- For Q2, the focus is on rate cuts and whether the Fed begins to soften rates. Key for that argument will be inflation data, discussed in further detail below.
- The Trader’s Course has been launched and is available from the below link. The first three sections of the course are completely open and this focuses on fundamental analysis, technical analysis and price action.
The U.S. Dollar is nearing the end of Q1 trade and while the showing so far this year has been strength, price action has been entirely inside of the range established last Q4. While U.S. inflation remained strong and the labor market similarly echoed that strength, the Fed remained dovish and continued the trend that had started at the November 1st rate decision last year. The Fed reiterated this at the most recent FOMC meeting, releasing forecasts indicating the continued expectation for three cuts in 2024 trade.
For Q2 of 2024, the big question is whether those cuts actually begin; and if they don’t, this loads the deck for a volatile second-half of the year with a Presidential election, as there would be only four meetings left to perform those three cuts. So, if we do see continued strength with inflation to the degree that it forces the Fed to shift expectations lower, to two cuts or less, there’s a fundamental case for USD-strength. There could also be potential vulnerability in equities as the dovish push from the Fed that started last November has helped to propel equities to fresh all-time-highs and there’s been a minimum of pullback along the way. If you’d like to read my forecast for equities in Q2, the link below will allow for access.
But – before we even get to Q2 there’s one more pivotal data point to digest, and this is the release of Core PCE data that’s scheduled for tomorrow, on Good Friday. Many exchanges will be closed at the time and later in the day there’s an appearance from FOMC Chair, Jerome Powell. This produces a backdrop that can be slippery for spot FX markets if that data prints far outside of the expectation. But the continued progress in that data point will be key for the Fed’s dovish push as ‘the Fed’s preferred inflation gauge’ of Core PCE has been falling more consistently than Core CPI.
On the below chart, we’re looking at both of those data points and the expectation for tomorrow is that we’ll get a 2.8% read at the same level as last month. If so, that would break a streak of six consecutive months of falling Core PCE. If it comes out above 3%, however, that could create some reverberations; but given that there’s an appearance from Powell later tomorrow, that could potentially be offset depending on his opinion on the matter.
When markets open next week, they will not only be faced with digesting that data print but also the Q2 quarterly open.
Core CPI (blue) v/s Core PCE (orange)
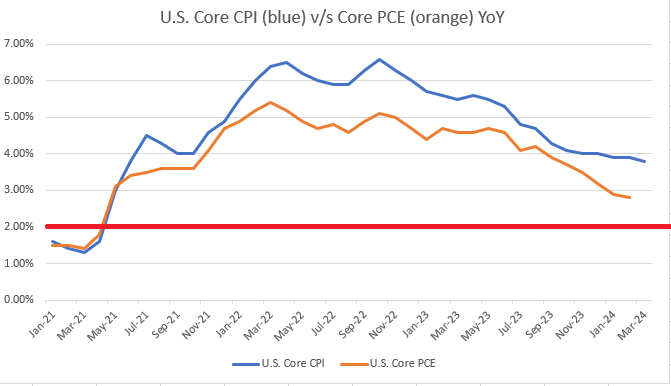
Image prepared by James Stanley
U.S. Dollar
The U.S. Dollar had a bullish outing in Q1 but it was far from one-sided; and the Fed’s dovishness played a large factor in this scenario. DXY was pushing-higher through the first-half of Q1, driven in-part by those strong CPI numbers. The morning of February 12th showed this theme visibly, with Core CPI once again holding very near the 4% marker, and that led to another breakout in the USD. Price began to test a key resistance zone, the same spot that had set support last November before the Dollar broke down.
But it was the morning after that CPI release that Chicago Fed President Austan Goolsbee remarked that market participants should not get ‘flipped out’ about the CPI print, and that helped DXY to claw back some of those recent gains. Weakness held in the Dollar through the end of February and into March, until a low was set on the morning of NFP on March 8th. Since then, bulls have been driving again and they’re nearing a re-test of that same resistance that rebuked the advance six weeks prior.
U.S. Dollar Daily Price Chart
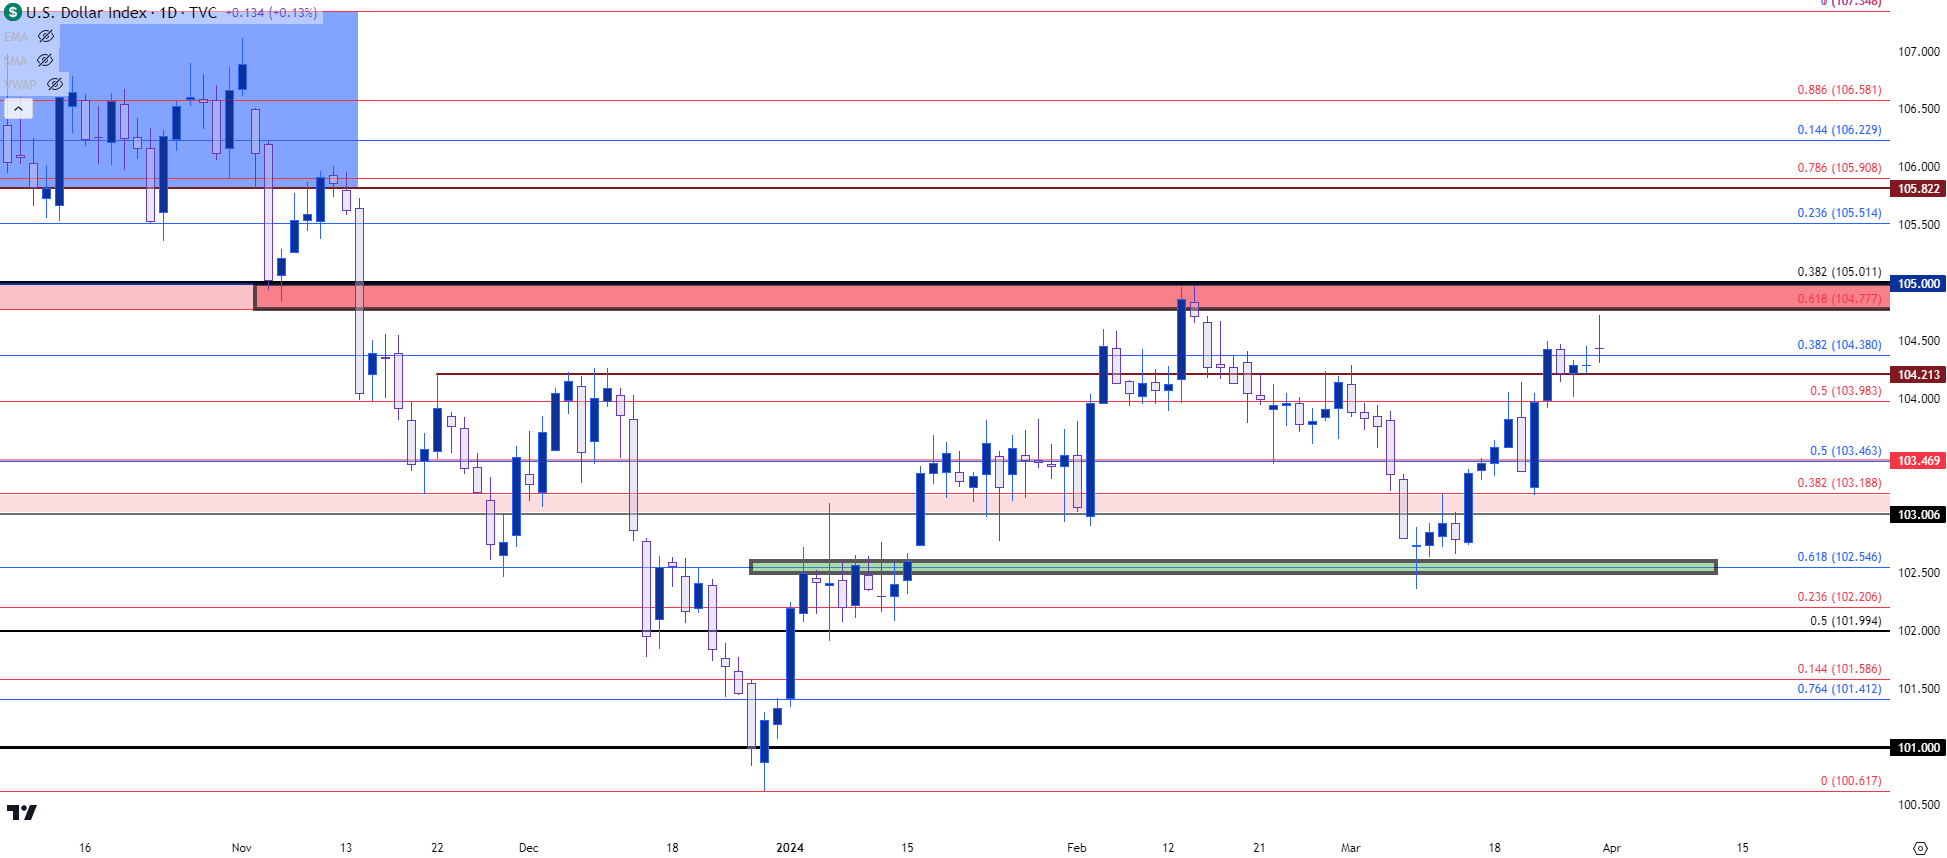 Chart prepared by James Stanley; data derived from Tradingview
EUR/USD
Is the Fed actually going to cut before the ECB? That remains an active topic as the European Central Bank suspended forward guidance and that leaves questions for rate cut expectations. It would seem that stability in both the Euro and U.S. Dollar would be a desired trait for each Central Bank, as a continued run of strength or weakness in either could create reverberations in the inflation picture, which would then create more problems down-the-road for the Central Bank.
But matching that bullish move in Q1 for the U.S. Dollar was a bearish move in EUR/USD. The pair found resistance twice at the 1.1000 psychological level in the opening days of 2024 trade and was unable to re-test that level for the rest of the quarter. There was a bullish flair in the pair, starting right around the time of that ‘flipped out’ comment that helped to prod a pullback in the USD; but sellers held resistance at a lower-high, in the resistance zone from 1.0930-1.0943, and that brought bears back into the mix to push all the way down to the trendline taken from 2023 and 2024 swing lows.
EUR/USD Daily Price Chart
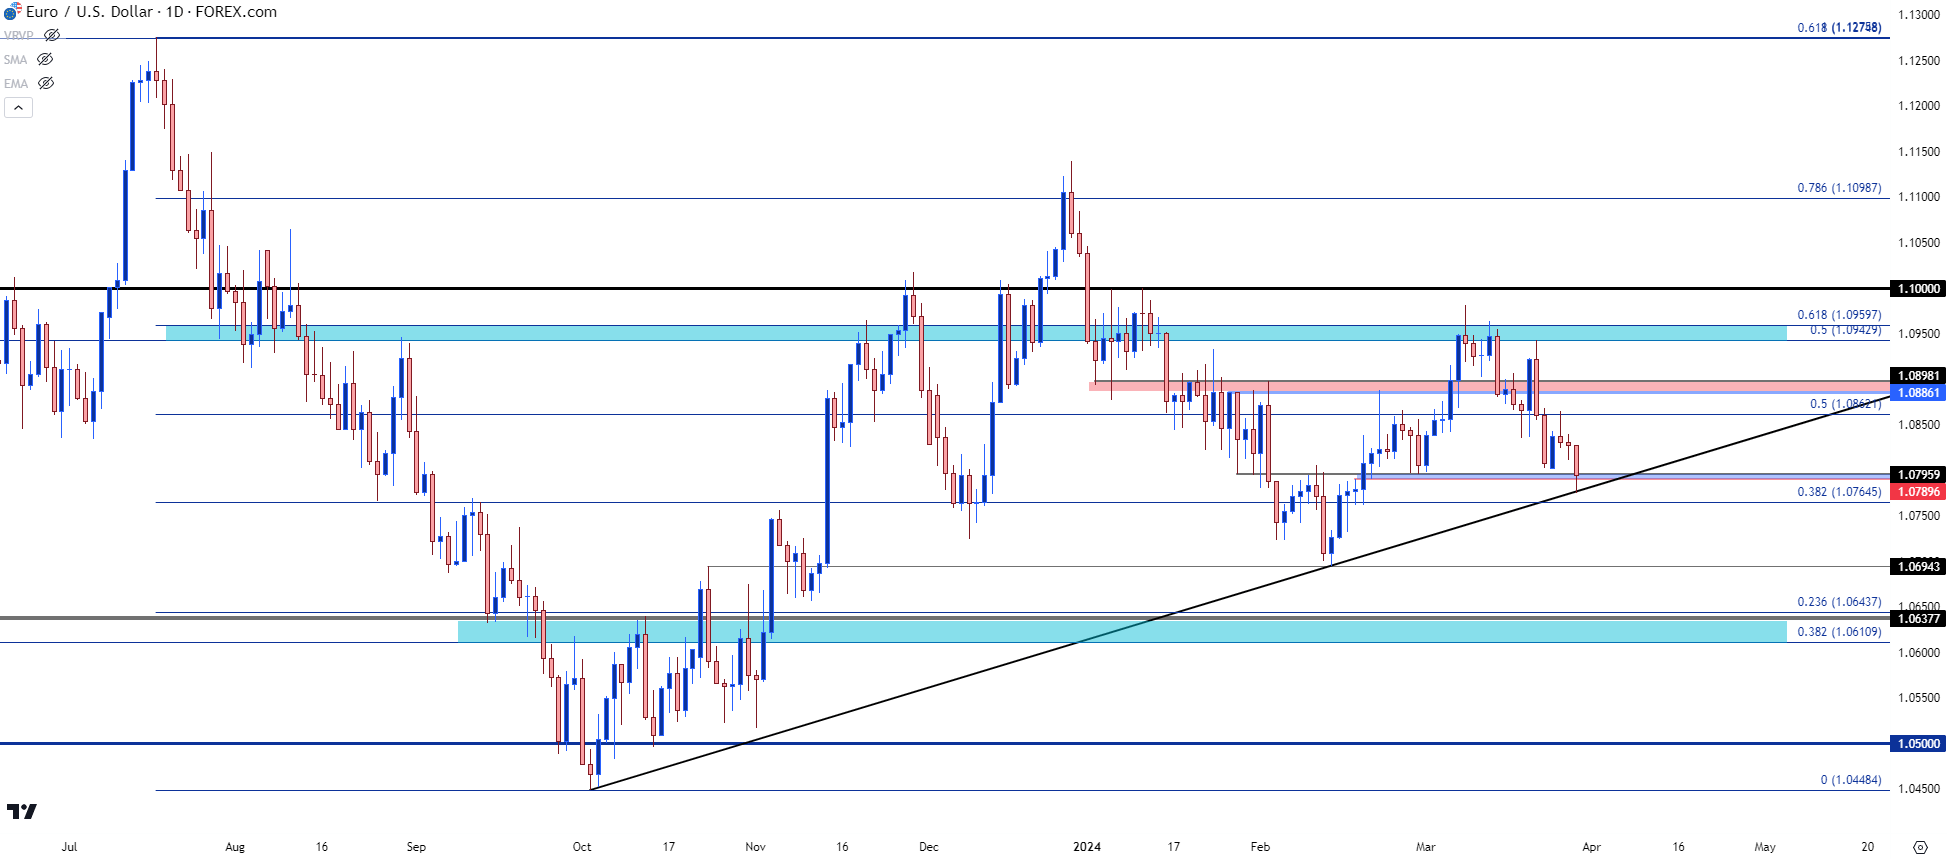 Chart prepared by James Stanley, EUR/USD on Tradingview
GBP/USD
The first part of Q1 saw relative strength in the British Pound. Even as the USD was surging higher in the first-half of the quarter, GBP/USD held a range and brushed off much of that strength. But, similarly, the Bank of England remains dovish even with the inflation picture showing continued strength.
After the March rate decision at the Fed, GBP/USD sprung from a support zone and showed a bullish move; but this was quickly offset a day later when the BoE echoed that dovishness despite the fact that the prior print for U.K. Core CPI had come in at 5.1%. The data released after that rate decision, however, showed more encouragement as Core CPI printed at 4.5%.
Ahead of the Q1 close, GBP/USD is still straddling the 200-day moving average, and there’s additional reference for support a bit lower, around the 1.2500 level that was last tested on the morning of the December FOMC rate decision. Confluent with the 200-day moving average is the 50% mark of last year’s sell-off at 1.2590.
GBP/USD Daily Price Chart
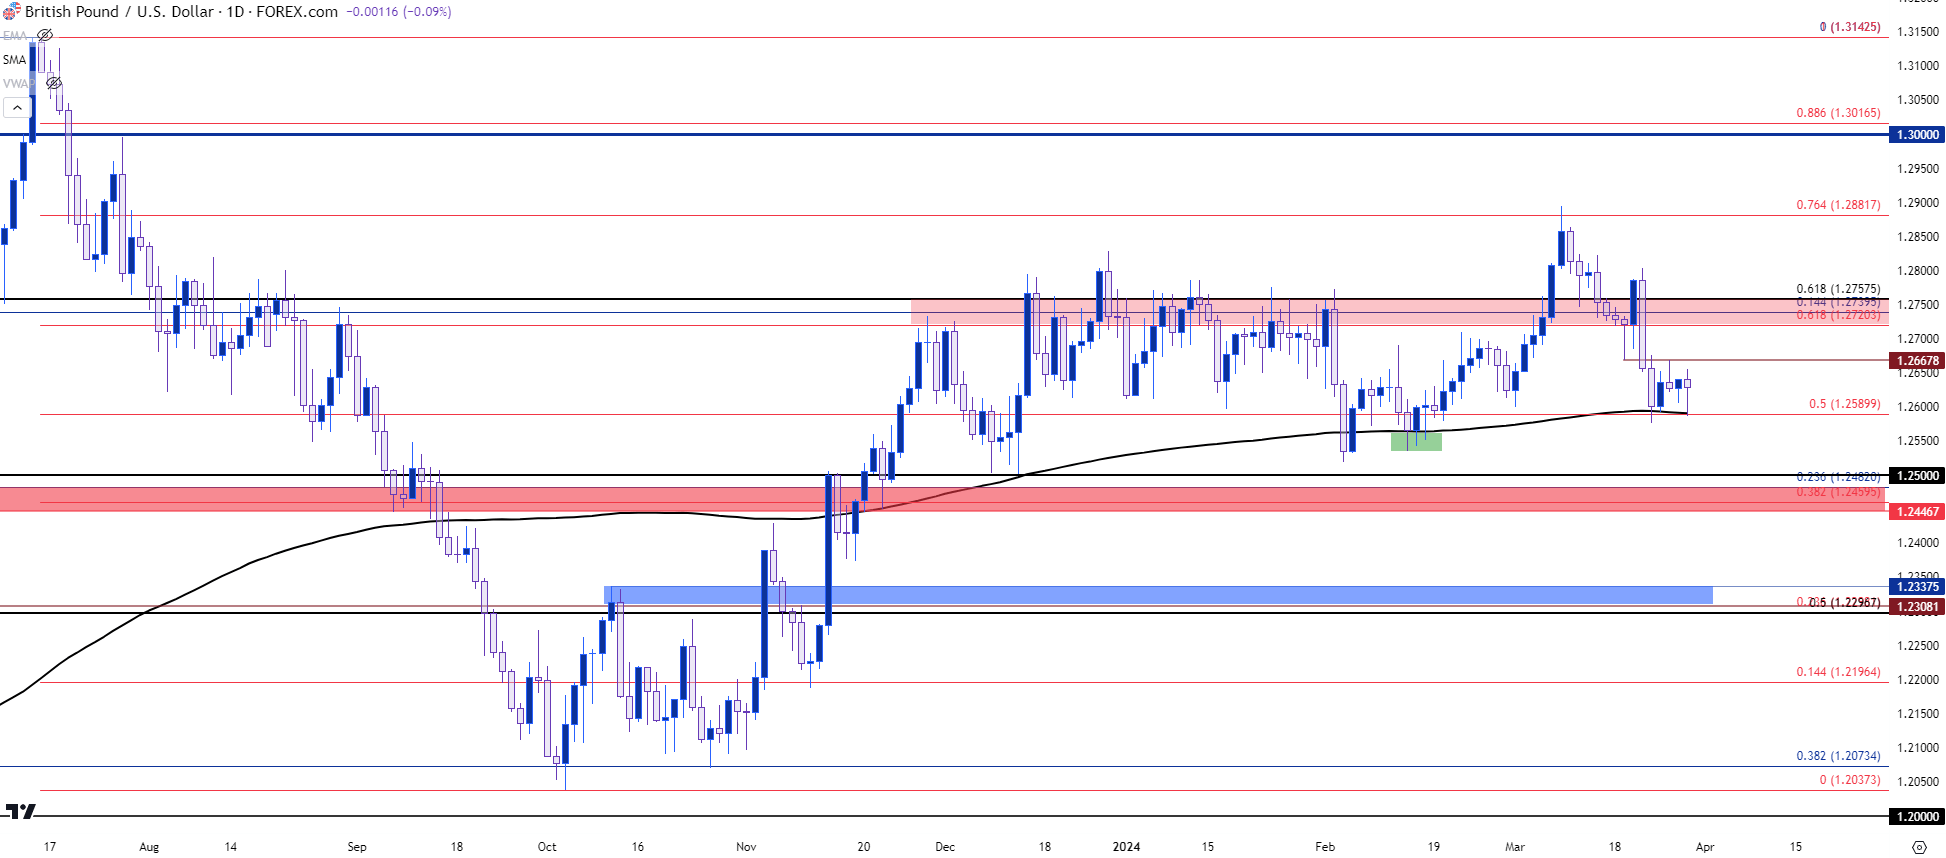
Chart prepared by James Stanley, GBP/USD on Tradingview
USD/JPY
The deck is loaded for USD/JPY in Q2. The Bank of Japan pushed their first rate hike since 2007 towards the end of Q1, and they did so in perhaps the most delicate manner possible. Bond purchases remain the same and there was little unsettling of the carry trade as the BoJ pushed rates from -0.1% to 0.1%, and USD/JPY simply jumped right back to the same 152 level that’s been a line-in-the-sand for the past two years.
The past week was filled with threats of intervention, from both Kanda and Suzuki, but the question remains whether they’ll jump on the matter upon a test of 152 or whether that line-in-the-sand may move up to a 155 level.
The weekly chart below shows an ascending triangle formation, often approached with aim of bullish breakouts. Given the Finance Ministry’s prior comments and the BoJ’s prior intervention, the rationale for resistance at 152 remains viable. And what really seemed to drive pullbacks from that zone in the prior two years were episodes of USD-weakness, helped along by inflation prints in each of the past two Novembers.
If the USD does sell-off in Q2 then the reversal setup here could be attractive. But, before that happens, there’s risk of a topside breakout in the pair as there are likely a number of stop orders sitting above the high, and if those stops on shorts get triggered, that’s fresh demand that can drive into the market.
This makes tomorrow morning especially interesting as an above-expectation Core PCE print, particularly if it’s over 3%, could possibly drive that breakout, triggering stops along the way. And then there could be motive for an intervention upon a print of fresh highs.
USD/JPY Weekly Price Chart
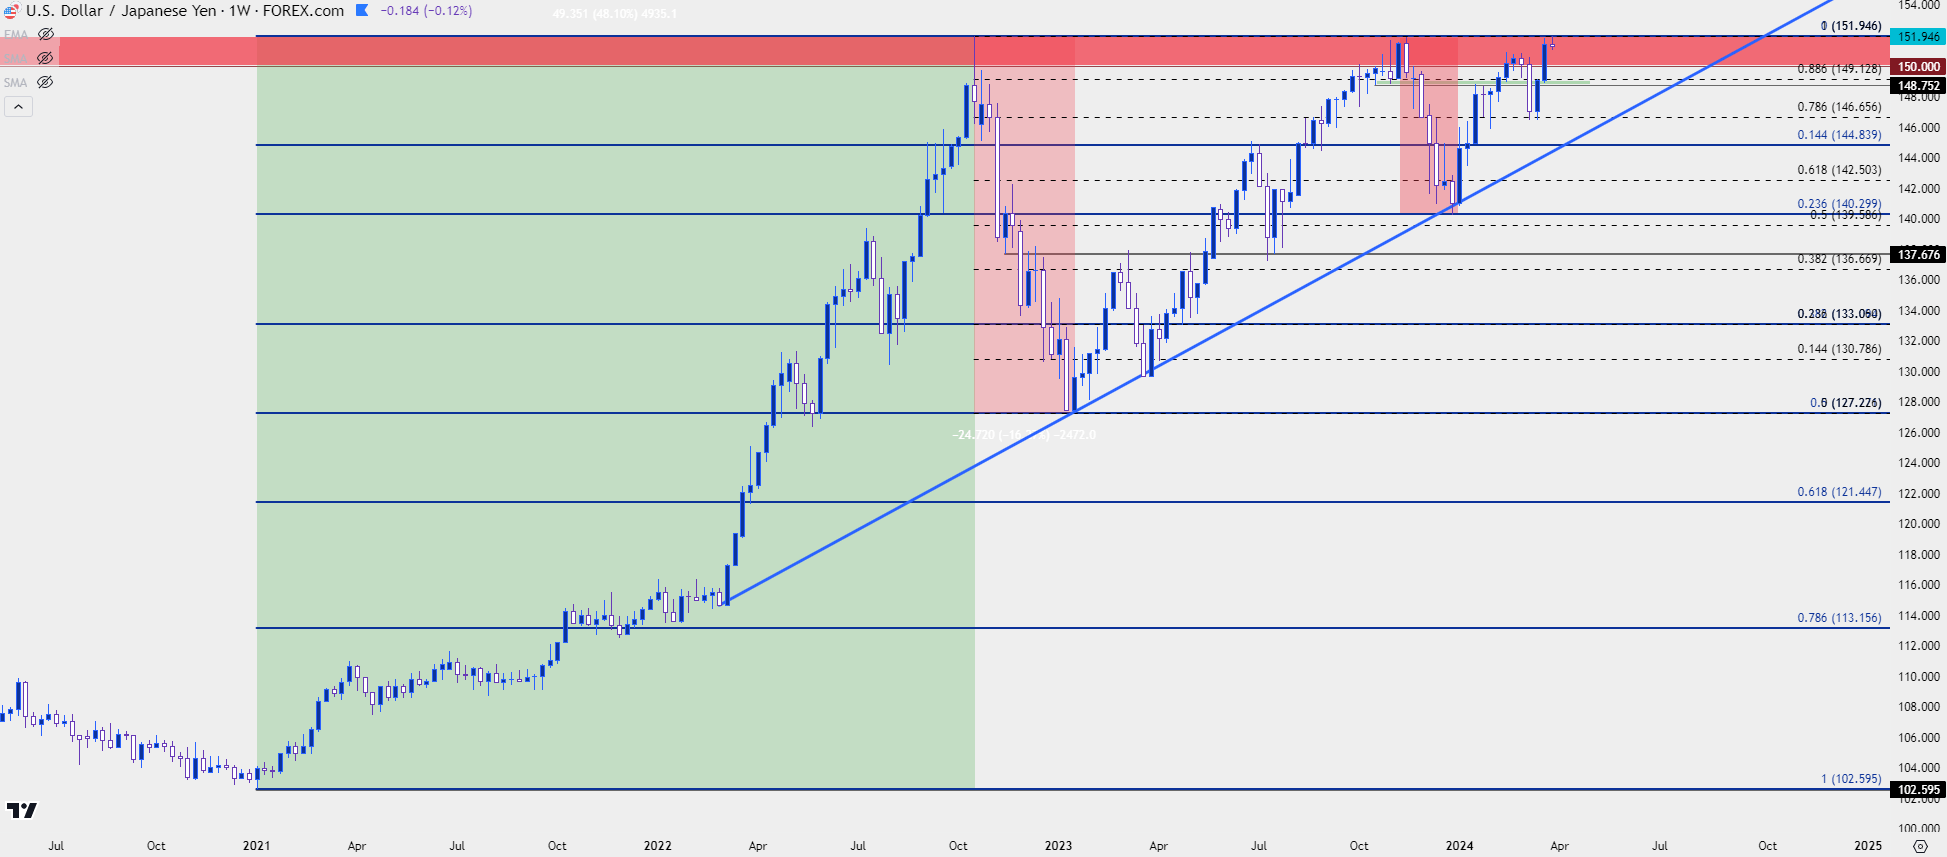 Chart prepared by James Stanley, USD/JPY on Tradingview
USD/CHF
While the Fed, ECB and BoE all prime the market for rate cuts, the Swiss National Bank has actually cut rates and this has pushed a fresh bout of weakness into the Franc v/s the U.S. Dollar. That drove a strong breakout in the USD/CHF pair and in scenarios of continued USD-strength, that could remain an attractive theme.
On the below daily chart of USD/CHF, we can see a similar dynamic as what had played out in the USD chart above – with the notable exception that the pullback from mid-February through March 8th seemed considerably lighter. And, the corresponding bullish reaction over the past few weeks also appears more visibly as USD/CHF has driven back above the .9000 psychological level.
At this point, a pullback has started to show, and the daily chart is currently working on a non-completed evening star formation. There’s higher-low support potential at the .9000 big figure, the .8970 swing or the .8919-.8924 zone. If none of those supports can hold the low, that sets up for a key test at prior resistance, taken from around the .8888 level.
USD/CHF Daily Price Chart
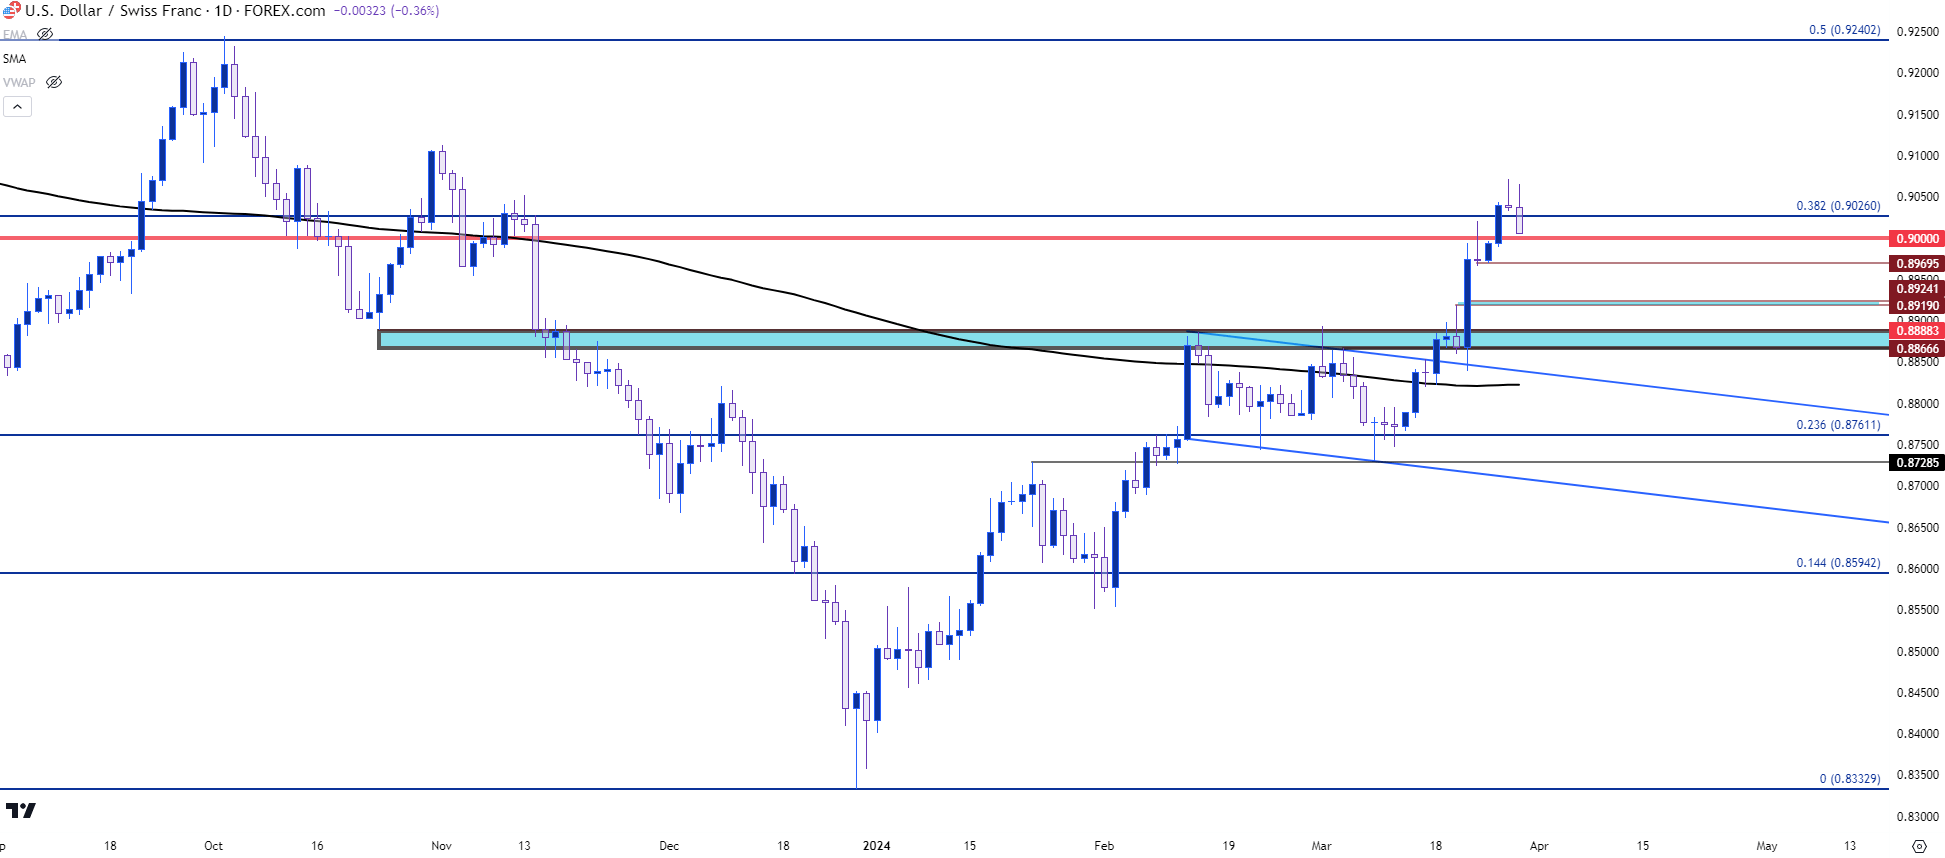 Chart prepared by James Stanley, USD/CHF on Tradingview
USD/CAD
It was a contentious quarter for USD/CAD but much of the period appears to be the pair struggling to finally gain acceptance above the 1.3500 level again. That psychological level came into play in the first couple weeks of the quarter, and it was in-play again last week but this time, as support. There’s also the 200-day moving average that was in the equation quite a bit in Q1, helping to highlight resistance-turned-support.
Like USD/CHF above, this can remain an attractive venue for scenarios of USD-strength, particularly if bulls can retain support at or above that 1.3500 price, which is nearing confluent with the 200-dma.
USD/CAD Daily Price Chart
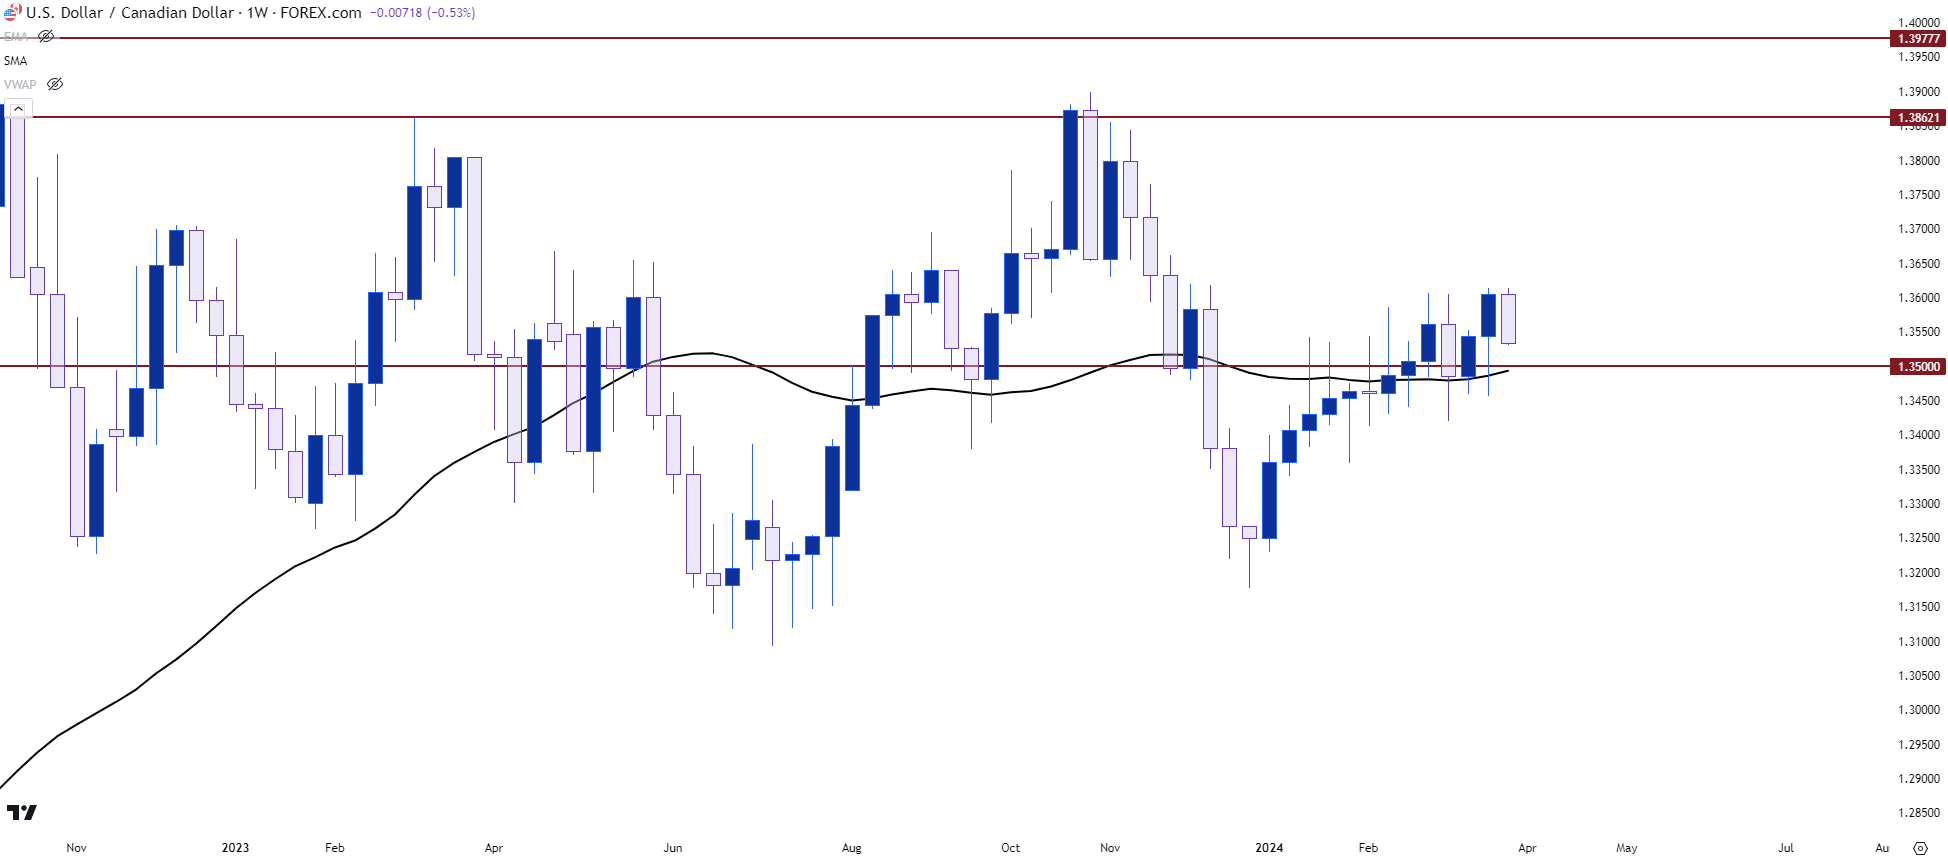 Chart prepared by James Stanley, USD/CAD on Tradingview
--- written by James Stanley, Senior Strategist


