
US Dollar, EUR/USD, GBP/USD, USD/CAD, Gold Talking Points:
- The US Dollar showed up with strength this week following a strong sell-off the week before, helped along by the FOMC rate decision and Non-farm Payrolls report.
- The USD held support at the 105.00 handle to start the week, which remains a key level for the currency. But the big question around a deeper pullback for the currency is whether Euro bulls can finally fire a deeper pullback of the sell-off that appeared this summer.
- I’ll be discussing these themes in-depth in the weekly webinar on Tuesday at 1PM ET. It’s free for all to register: Click here to register.
The US Dollar finished last week in a very bearish manner. Prices in DXY ran down to a fresh monthly low after the release of NFP data and the currency pushed into and found support at the 105.00 level to finish last week. I had highlighted that level before as it’s a key spot for the Greenback, as 105 is not only a psychological level but also the 38.2% Fibonacci retracement of the 2021-2022 major move.
That level was tested a bit more after the weekly open but bulls began to return on Monday, and that led to a consistent run of strength through the rest of the week with price pushing back up to, and eventually through, prior support at the 105.69-105.88 spot on the chart.
US Dollar Daily Price Chart (indicative)
 Chart prepared by James Stanley; data derived from Tradingview
From the four-hour chart below, the US Dollar’s recent price action shows as a range with a tendency towards mean reversion over the past six weeks.
Sellers seemingly had an open door to run a short-side trend after last week’s sell-off, but the fact that they failed to retain control and that price has pushed back above keeps the door open for further mean reversion into next week. This, of course, will have some relationship to whether other currencies might be able to take on strength to allow for a deeper pullback or a re-test of 105.00 in DXY, which has been problematic of late.
US Dollar Four-Hour Price Chart
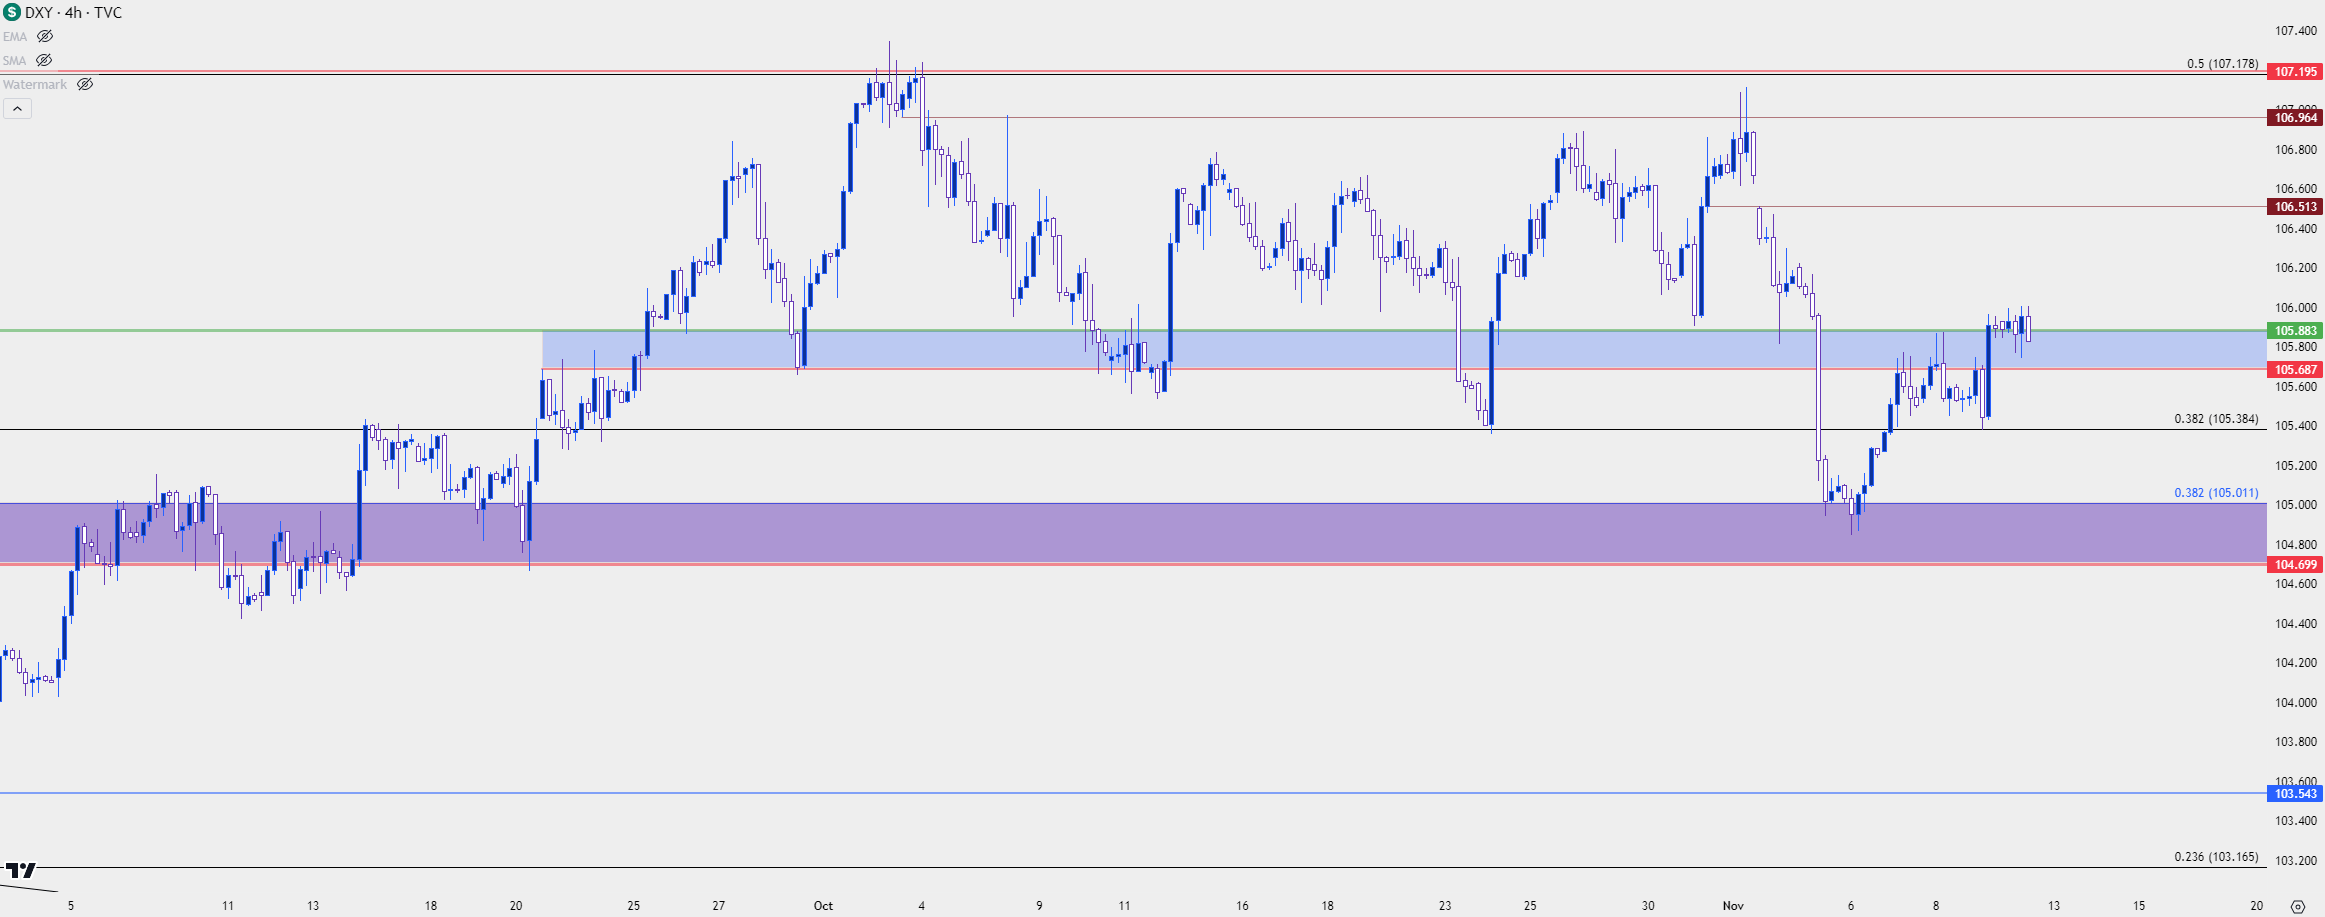 Chart prepared by James Stanley; data derived from Tradingview
Taking a step back to the weekly chart provides some additional context. Last week finished as a bearish outside bar which put control into bears’ hands for this week. They were unable to do much with it, but it must be noted that there could be a possible lower-high setting up in here, which is why the shorter-term mean reversion theme remain so important for the early-portion of next week.
The primary trouble for the USD and I think this is something that can be extrapolated in the Euro via EUR/USD, is the fact that bulls have been unable to push as we’ve gotten closer to resistance, which plots around the 50% mark of the pullback move that started last year. In EUR/USD, that mirror image stall has been at the 1.0500 level.
In DXY, this raises the question of bearish trend potential if sellers do show up early next week; but, again, this is going to need some help from some related markets if that’s to take place.
US Dollar Weekly Price Chart (indicative)
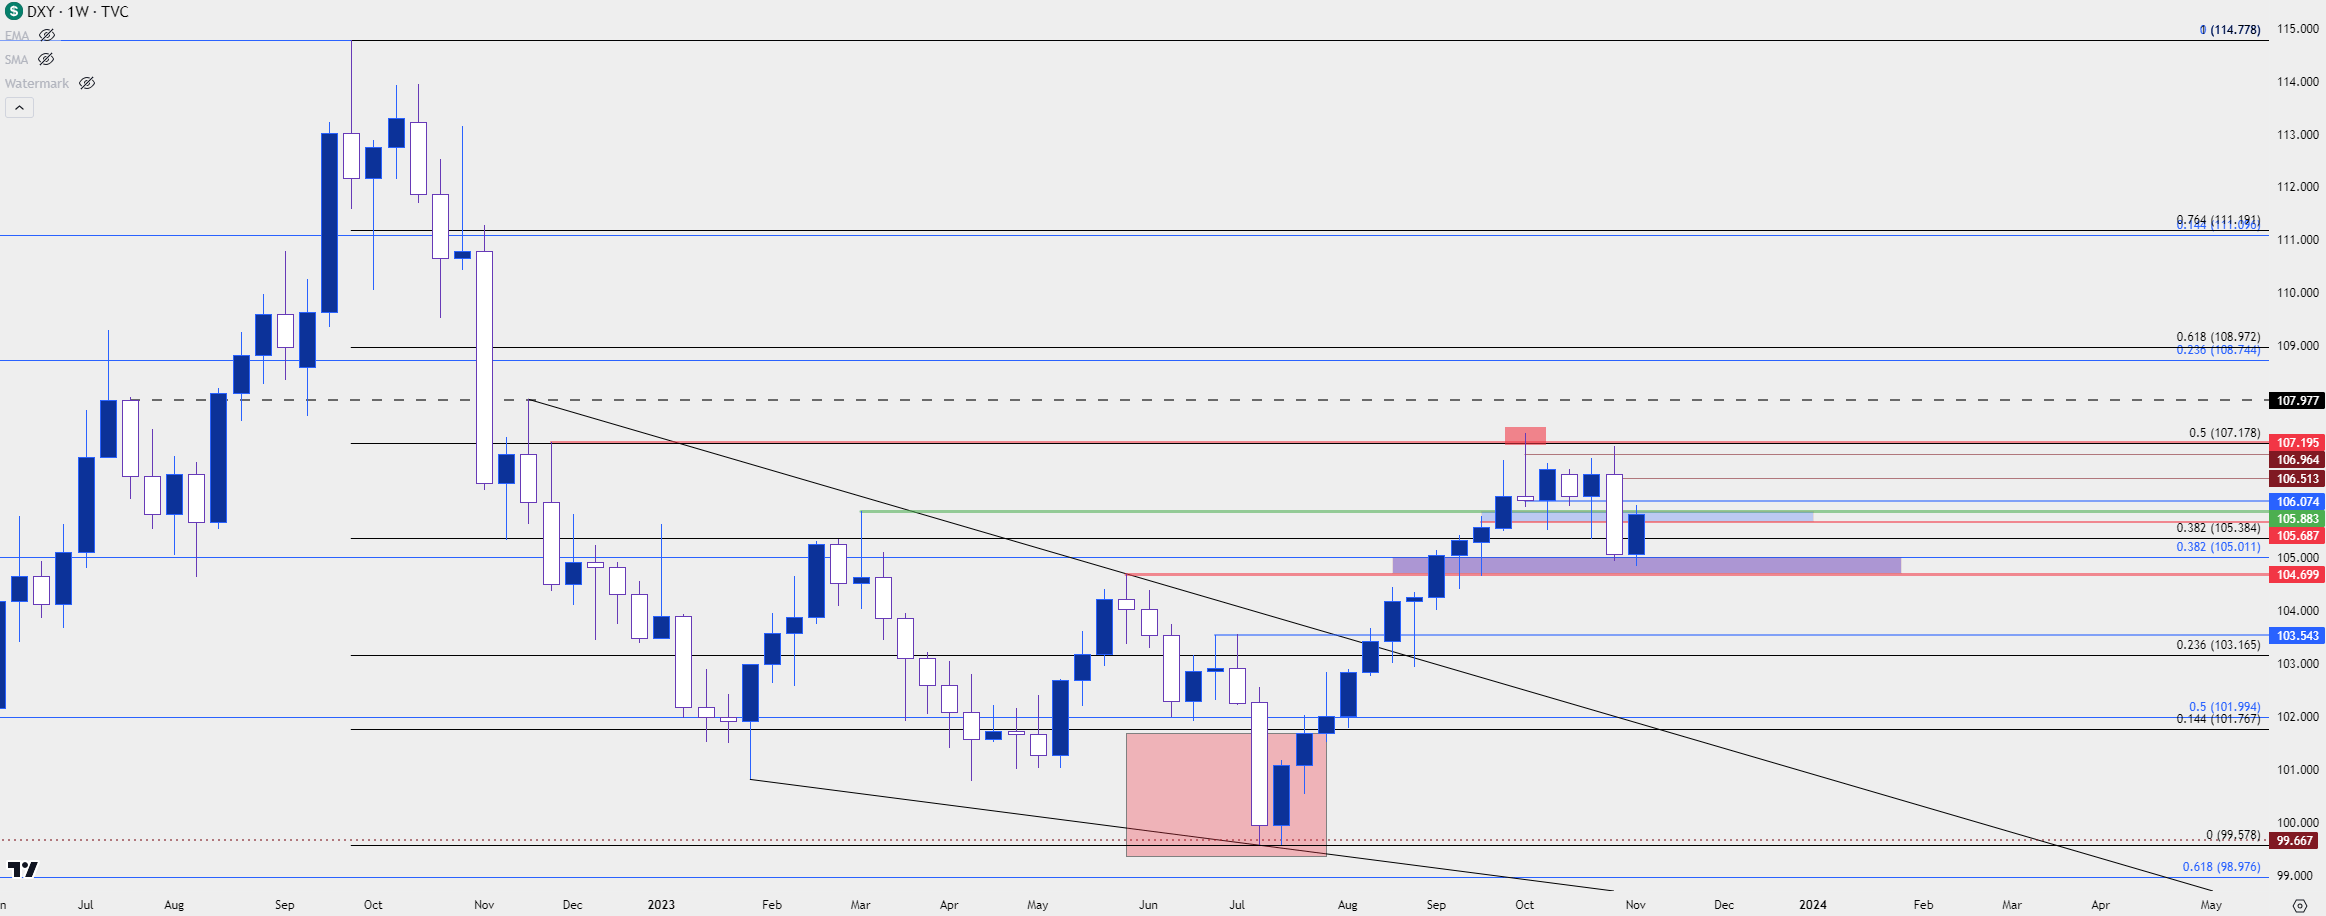 Chart prepared by James Stanley; data derived from Tradingview
EUR/USD
Going along with that stall at resistance in the USD around the 107.00 level in DXY has been similar stall around the 1.0500 spot in EUR/USD. This has become somewhat of a saga as it’s been a similar scenario for much of the past six weeks and, again, this has some parallel with the US Dollar.
The issue in EUR/USD has been bulls willingness to take on strength, even for a pullback. With warnings such as we heard this week from former ECB President, where he highlighted recessionary potential in the near-term, there’s a very applicable reason that markets remain skeptical of prolonged EUR/USD strength, so the bearish trade has remained crowded; and each time price has popped up to a fresh high it’s been met with sellers, very similar to the flare from NFP Friday that produced a fresh monthly high in the pair last Friday only to see the entirety of this week clawing that move back.
But – at this stage, bears haven’t been able to take out support and this can keep the door open for a stronger push. I’m charting support here in a zone of prior resistance, running from the Fibonacci level of 1.0611 up to another Fibonacci level at 1.0643.
EUR/USD Daily Price Chart
 Chart prepared by James Stanley, EUR/USD on Tradingview
GBP/USD: Cable Cut
GBP/USD has had a similar backdrop as EUR/USD with a few notable exceptions. While price did test below a significant psychological level at 1.0500 in the Euro, with bears unable to continue the move, the major big figure in GBP/USD is at the 1.2000 handle and that hasn’t yet been tested.
Price held a higher-low last week before posing a strong topside breakout around the Fed on Wednesday and the Bank of England on Thursday, but much of that move was priced-out this week. Bulls failed to hold higher-low support at the 1.2300 area and price sank all the way back to test below the 1.2200 handle.
This still has an appearance resembling EUR/USD, and a similar conundrum of the short side still appearing to be a somewhat crowded trade as bears hit last week’s breakout aggressively.
At this point, the support looked at in the Tuesday webinar retains some potential, as there’s a large batch of longer-term support sitting just below spot.
GBP/USD Daily Chart
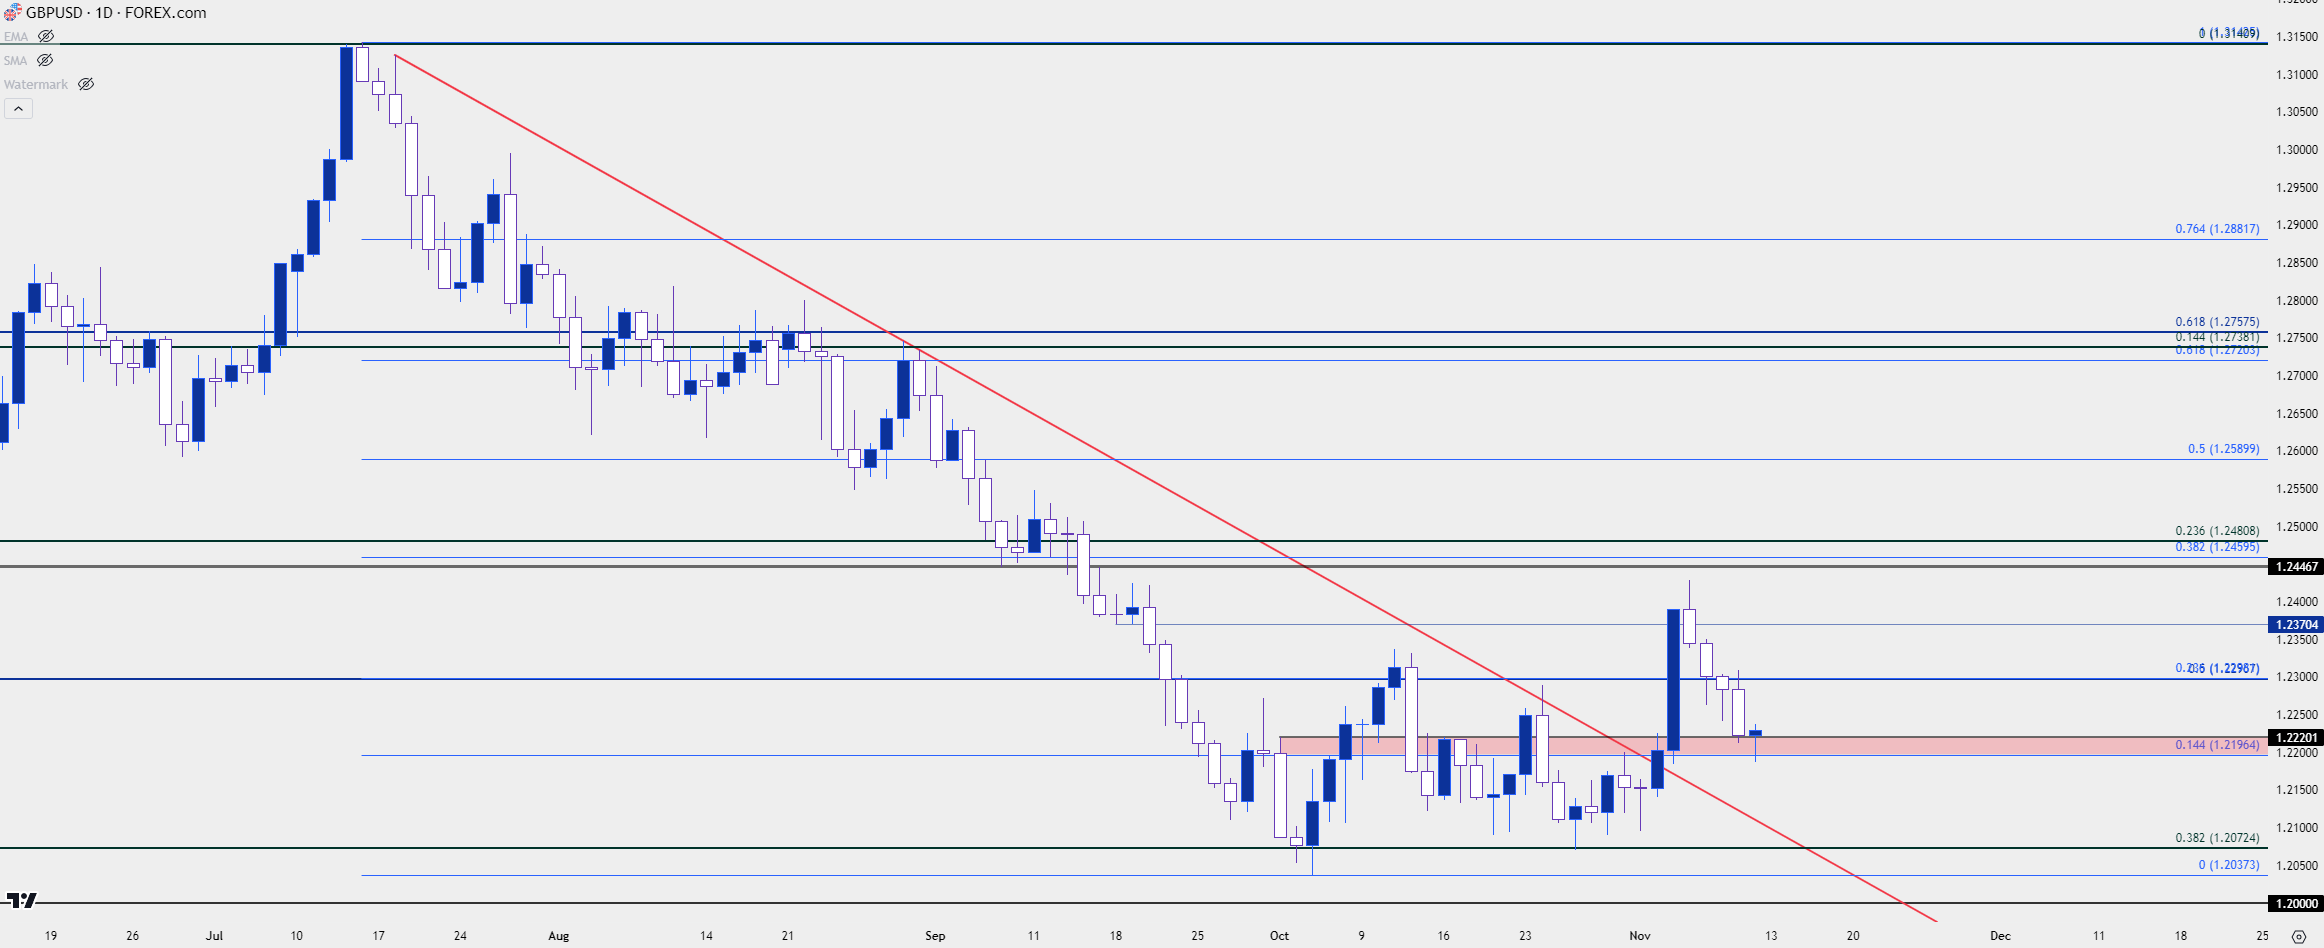 Chart prepared by James Stanley, GBP/USD on Tradingview
USD/CAD
It’s been a wild few weeks in USD/CAD.
The pair put in a breakout in late-October to push outside of a symmetrical triangle formation that’s been brewing for the past few years. That led to a fresh yearly high and a test of a big spot of resistance at the 1.3900 level.
That test was just ahead of FOMC, and when USD-weakness took over afterwards, the entirety of the prior week’s move was erased, and USD/CAD returned to re-test the Fibonacci level at 1.3652. Like USD, USD/CAD finished last week as a bearish outside bar, which put control in bears’ hands to start this week. But, also like USD, support caught in early-trade and the rest of the week was bulls firing off of that inflection, with USD/CAD pushing right back into resistance at 1.3850.
USD/CAD Weekly Chart
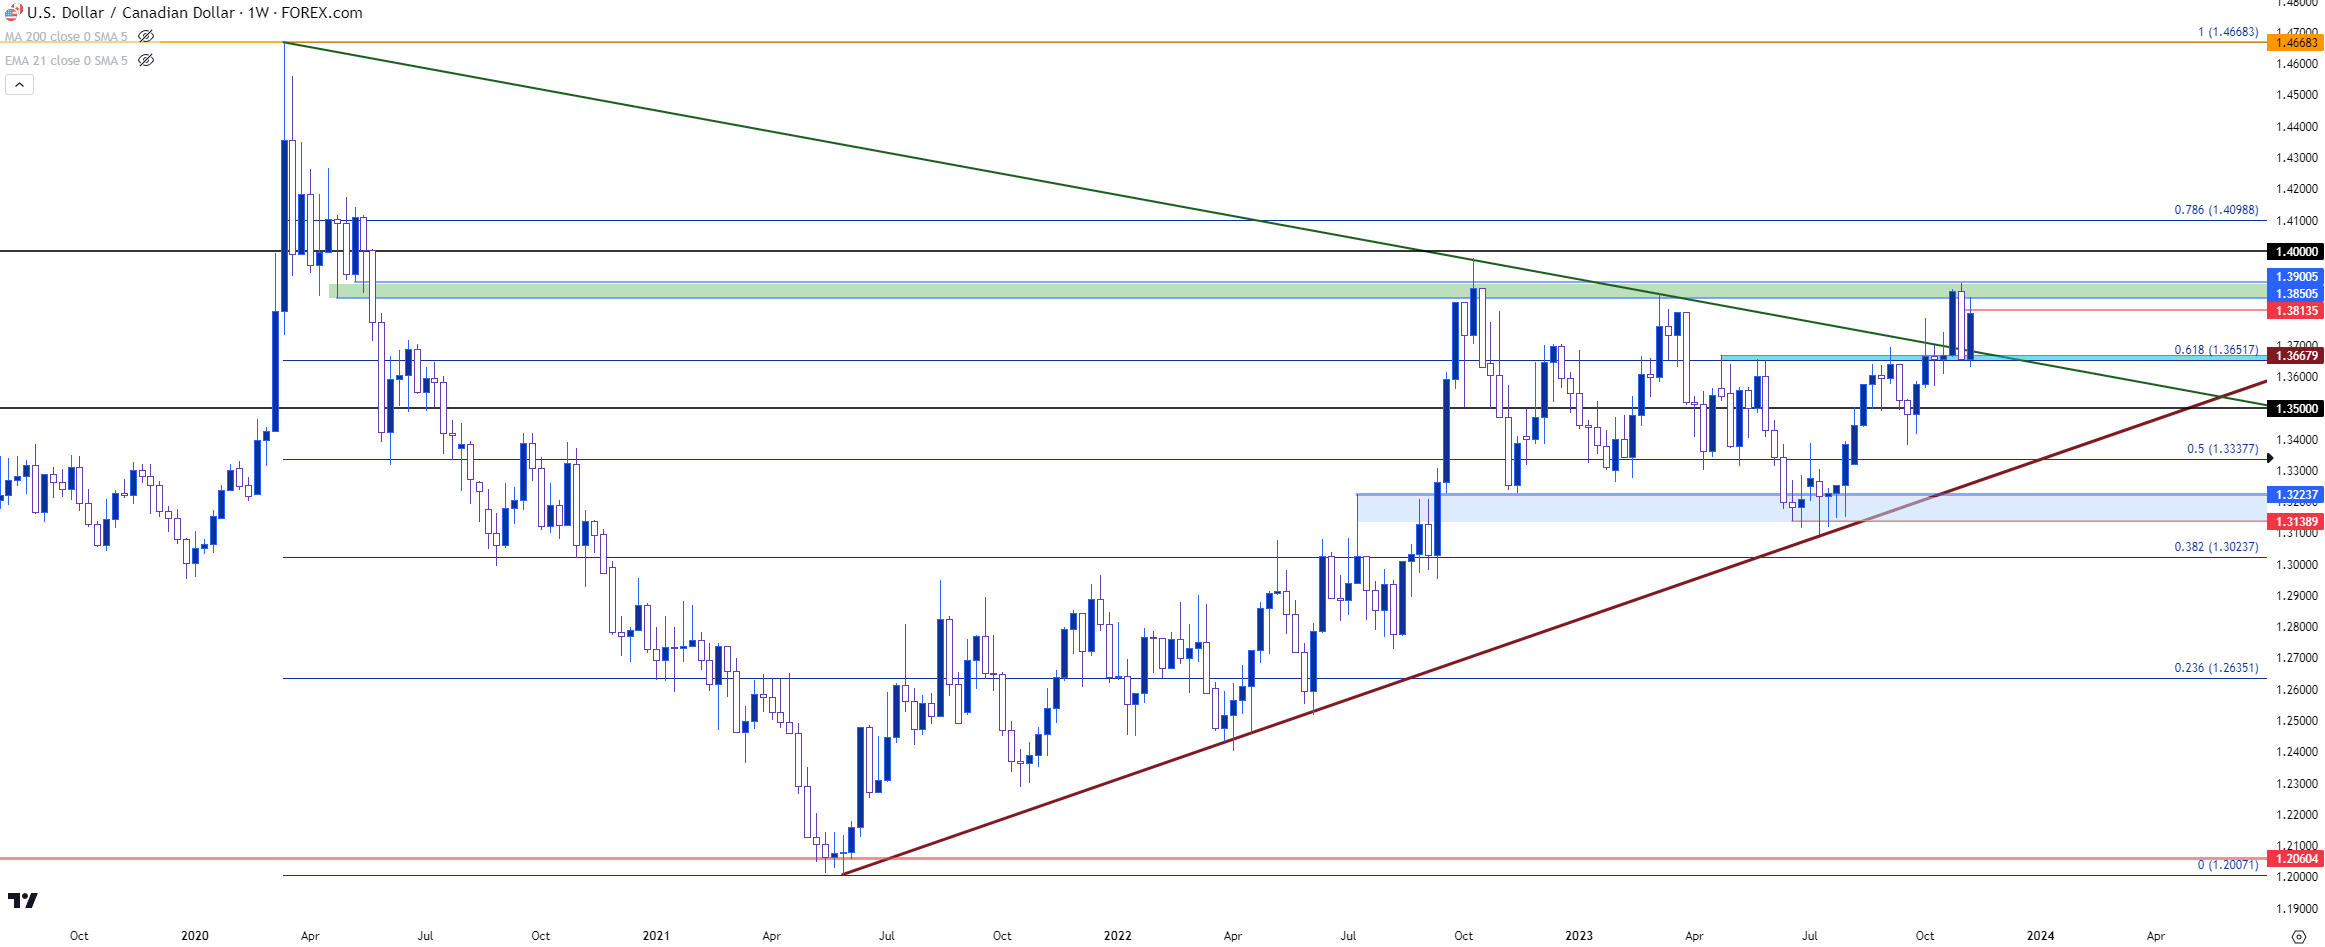 Chart prepared by James Stanley, USD/CAD on Tradingview
USD/CAD Shorter-Term
In the Tuesday webinar I had highlighted the possibility of lower-high resistance potential, with a focal point around 1.3814. The logic behind this was that, even if bulls could stretch beyond 1.3900, another major level lurks nearby at the 1.4000 handle, and as I had shared in that webinar, a major psychological level of that nature on a natural cross can become problematic for continuation scenarios. This, of course, doesn’t preclude a test, but without adequate motivation from bulls this can fast lead into a lower-high situation, somewhat similar to the setup around DXY with 107.00 at the moment.
USD/CAD Daily Price Chart
 Chart prepared by James Stanley, USD/CAD on Tradingview
Gold
It was a harsh week for Gold bulls as the yellow metal built in more weakness after the stall that showed in the prior week, around the $2,000/oz level. From the weekly chart below, we can see an evening star formation punctuated by strength two weeks ago, indecision last week and then a very bearish outlay for the most recent weekly bar.
Gold (XAU/USD) Weekly Price Chart
 Chart prepared by James Stanley, Gold on Tradingview
If gold markets have taught us anything over the past few months, it’s the danger of chasing a move. And as of this writing I have gold nestling up to a support level at 1932. And as evidence of the danger of chasing, gold set a fresh low on Thursday morning with a test inside of the 1948 level only to snap back and find resistance at prior support of 1964.
So, for gold bears, waiting for resistance could be practical when facing the option of chasing a fresh break, and given all the prior support, there’s a few different levels of note sitting above current price. The levels at 1947 and 1953 stick out for such, with 1964 retraining some appeal, although if we test that quickly the breakdown move will start looking like a failure, so that scenario would need to be monitored in the event that it does happen.
Gold (XAU/USD) Daily Price Chart
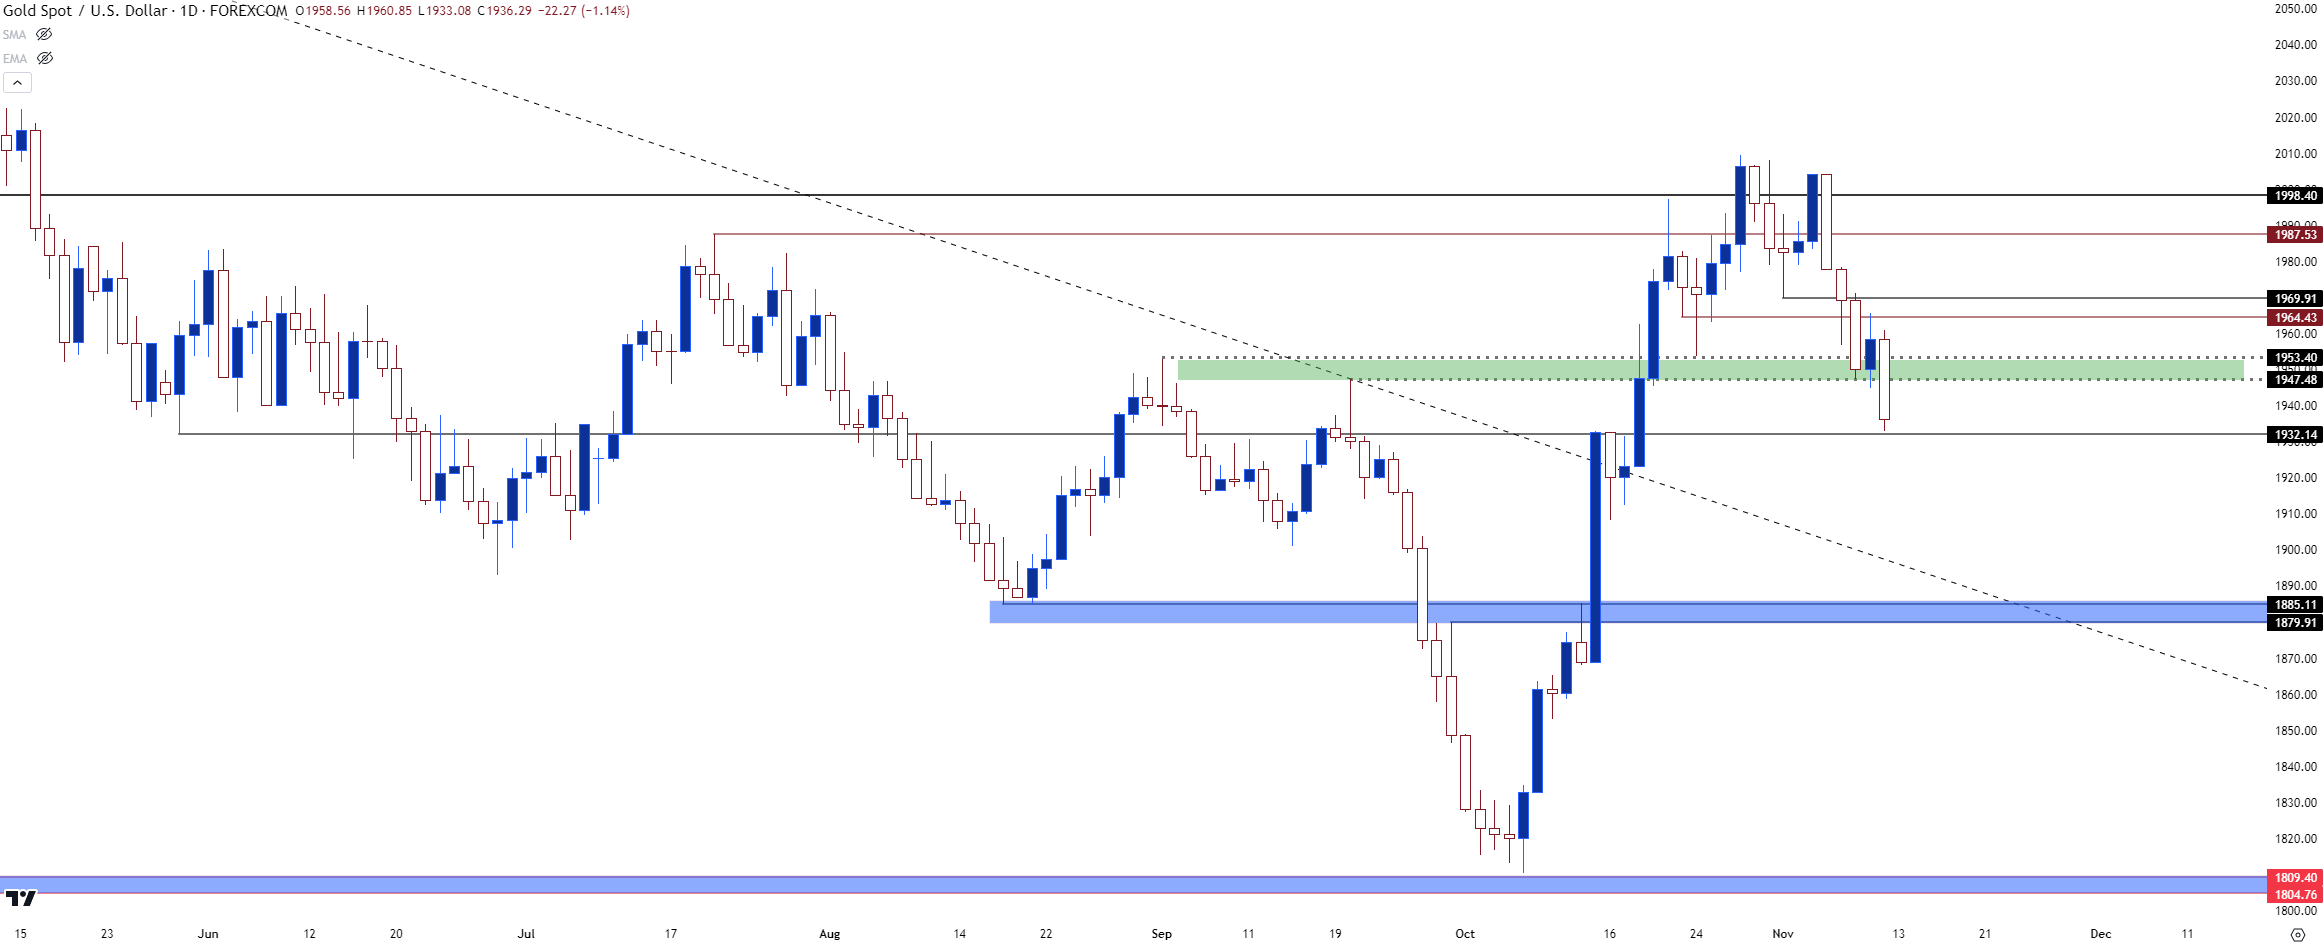 Chart prepared by James Stanley, Gold on Tradingview
--- written by James Stanley, Senior Strategist


