
US Dollar Talking Points:
- The US Dollar sold off on the FOMC rate decision today as the Fed didn’t seem too perturbed by inflation that’s seemingly started to stall at elevated levels.
- The Fed did announce a reduction in their Quantitative Tightening program which could be construed as a dovish move; and this contributed to a sizable sell-off in the USD, which drove breakouts in EUR/USD and Gold along with a pullback in USD/JPY.
- The week is not over yet, however, as this puts more emphasis on the NFP report on Friday.
- I’ll be discussing these themes in-depth in the weekly webinar. It’s free for all to register: Click here to register.
The US Dollar has quickly moved from tempting a breakout to a sizable pullback. While economic data in the U.S. has remained strong so far in 2024 trade, the Fed continues to toe a relatively dovish line after whittling down QT today. At today’s rate decision there were no updated projections or forecasts from the Fed, and this gave Powell considerable latitude in the messaging, the net of which drove that bearish move in the USD.
The currency quickly went from tempting a breakout at the 106.50 level on Tuesday night to a sizable sell-off with a major push at the start of the 2:30 PM press conference on Wednesday.
At this point the 105.38-105.51 support zone that held three days of support tests is in-play. And there’s also a case for a re-test of the 105.00 level which is a Fibonacci level, a psychological level and it had held the highs twice already in 2024 trade. Notably, that level hasn’t yet been tested for support since the CPI-fueled breakout three weeks ago.
US Dollar Daily Price Chart
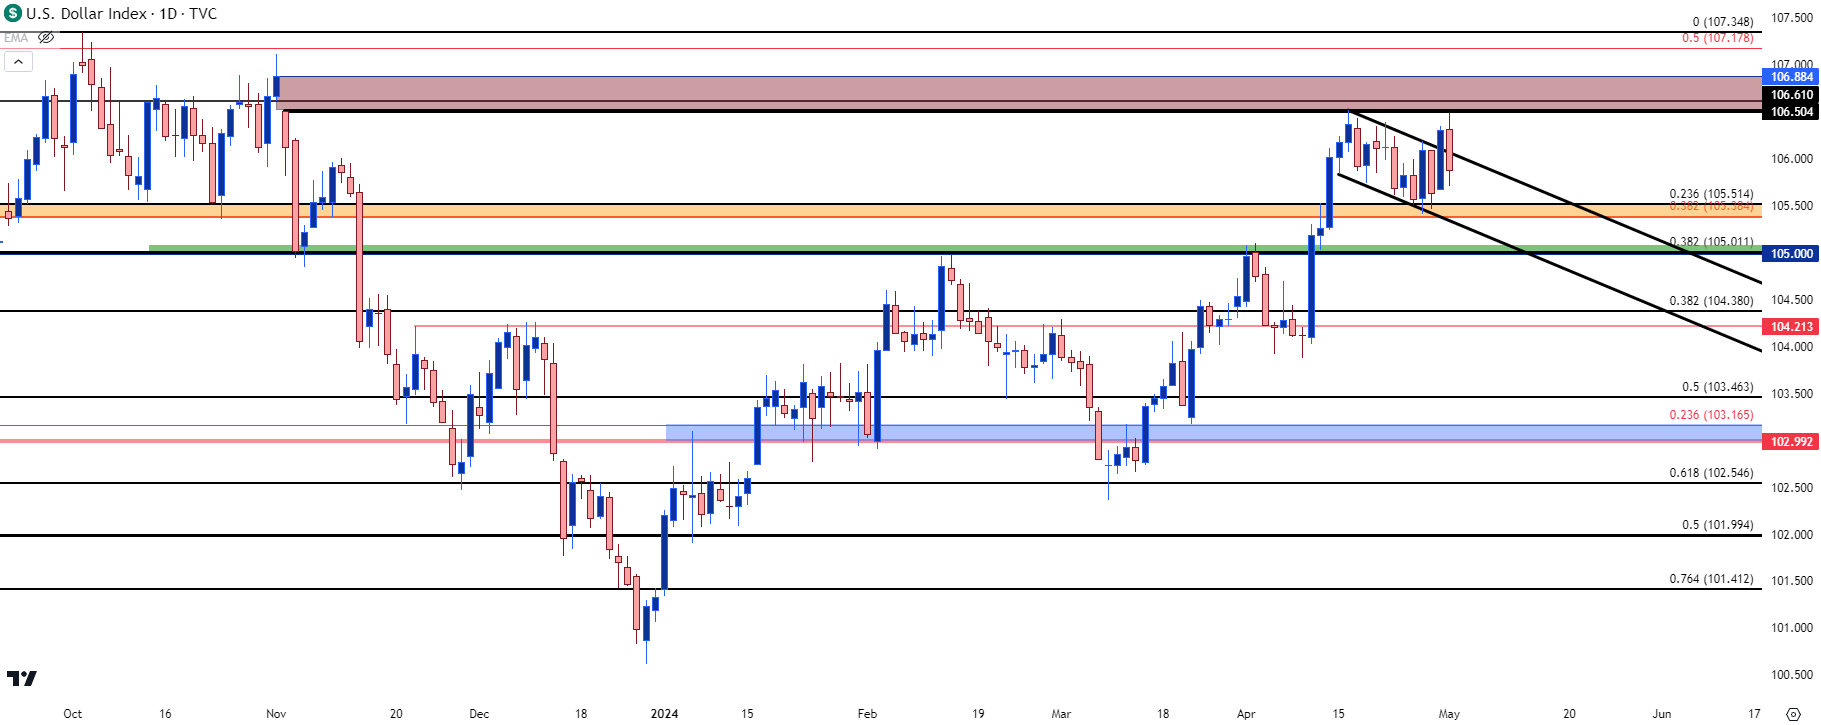 Chart prepared by James Stanley; data derived from Tradingview
Focus Shifts to NFP
So far this year, it’s been the data that’s done the bulk of the bullish drive in the USD. I had remarked on this in webinars throughout Q1, where the ‘natural flow’ of the Dollar felt higher yet the Fed continued to tamp down bullish runs with dovish commentary.
And it’s also important to remember that the effect of FOMC rate decisions could take days or perhaps even weeks to play out into a fresh trend. So it would be too early to say that today’s meeting is going to spark a prolonged run of USD-weakness. But, instead, this puts focus on supports to see if buyers show up to hold higher-lows.
With the Fed retaining a relatively dovish stance this further puts focus on data as markets look for signs of softening inflation that may lead to rate cuts from the FOMC. The Friday NFP report could be big for this theme, but likely it’s the next CPI report that will garner that attention. But, also of importance is the matter of counterparts.
EUR/USD
I looked into this in the webinar ahead of the rate decision, but the support in EUR/USD has been in place for 16 months now, and this spans from the 1.0500 handle just past 1.0611, with the latter price taken from the 38.2% retracement of the 2021-2022 Fibonacci retracement. The 61.8% of that move caught the high last year, and the 50% mark cauterized resistance in March with a series of lower-highs.
That price at 1.0611 was traded through for a single day last month and helped to set a higher-low the day after; but there’s even more context for support below that down to the 1.0500 handle which held multiple tests in 2023 without bears able to continue the breakdown.
At this point that support has already been defended but the big question is whether it can continue to fill in the long side of the range that’s been in place since the start of last year. If the NFP report comes out relatively soft on Friday that could help to buoy the pair back towards the 1.0750 and then 1.0796 levels.
EUR/USD Daily Price Chart
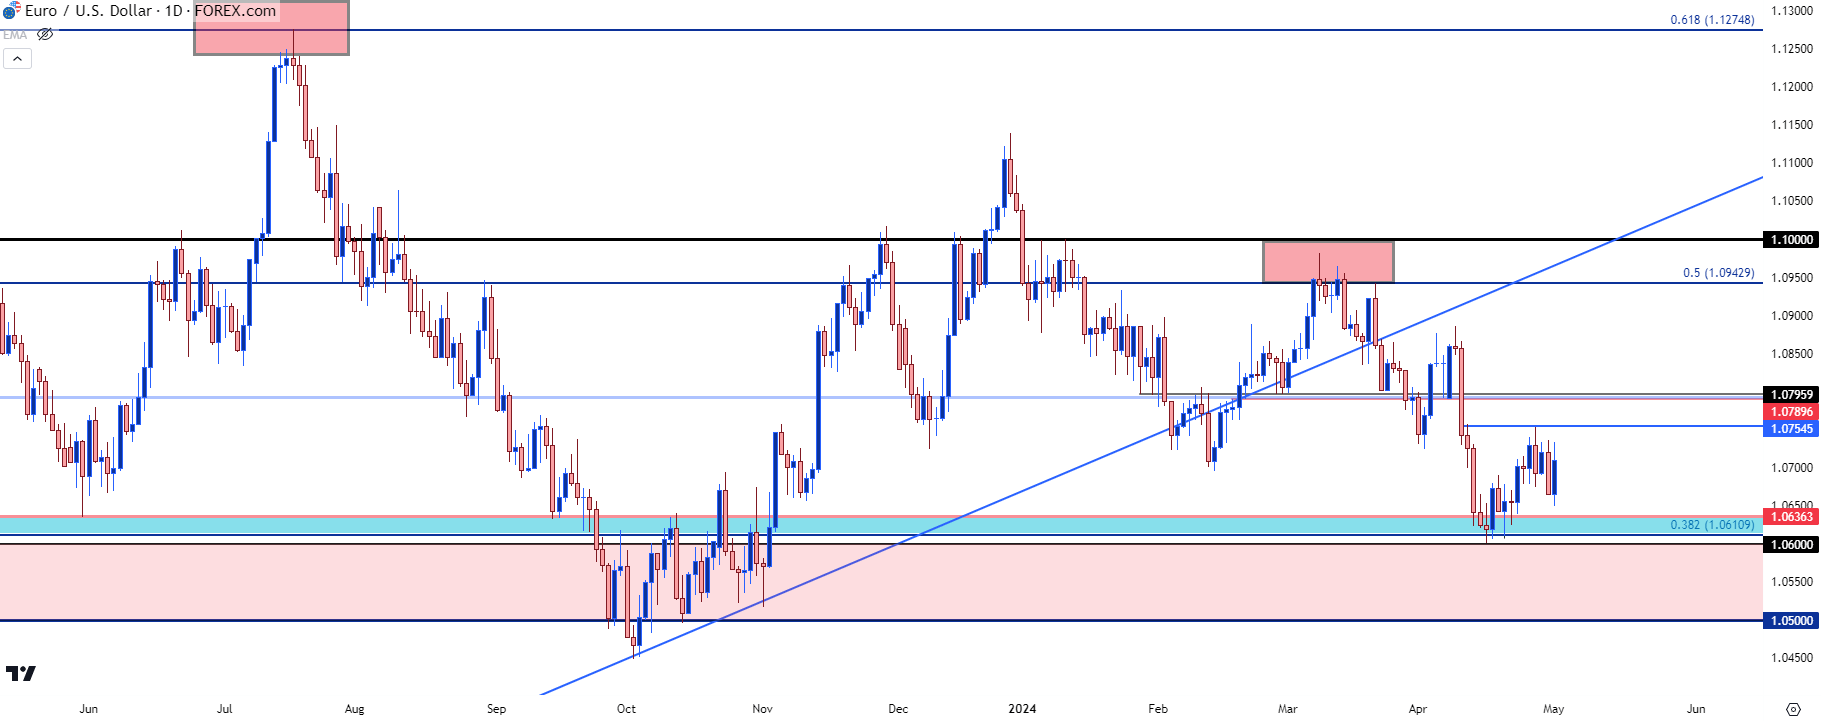 Chart prepared by James Stanley, EUR/USD on Tradingview
USD/JPY
The Bank of Japan might be exhaling a sigh of relief when they wake up this morning.
While the BoJ intervened at the 160.00 level to start this week, bulls were undeterred and simply pushed price off support at 155.00. As I had discussed last week, intervention isn’t really a long-term strategy as it doesn’t solve the fundamental divergence in the pair that’s continued to draw bulls in.
What could change that pace, however, is what we saw in Q4 of 2022 and 2023, where a falling USD on the back of expectations for rate cuts was a major motivator to getting carry trades to square up positions, leading to a surge in supply and a fast fall in USD/JPY prices.
From the hourly chart below, we can see a wide range that remains in-play today, with focus on rounded levels such as the support at 157.00 around the start of the Fed meeting, or the resistance at 157.50 or 158.00.
This is a market that I expect to continue to track USD-flows. If DXY catches a bounce from that support, USD/JPY could see similar strength. But, if NFP disappoints and USD-weakness shows, which would like go along with a EUR/USD test of 1.0796, that could offer some further relief to this theme with focus on a re-test of the 155.00 handle in USD/JPY.
USD/JPY Hourly Price Chart
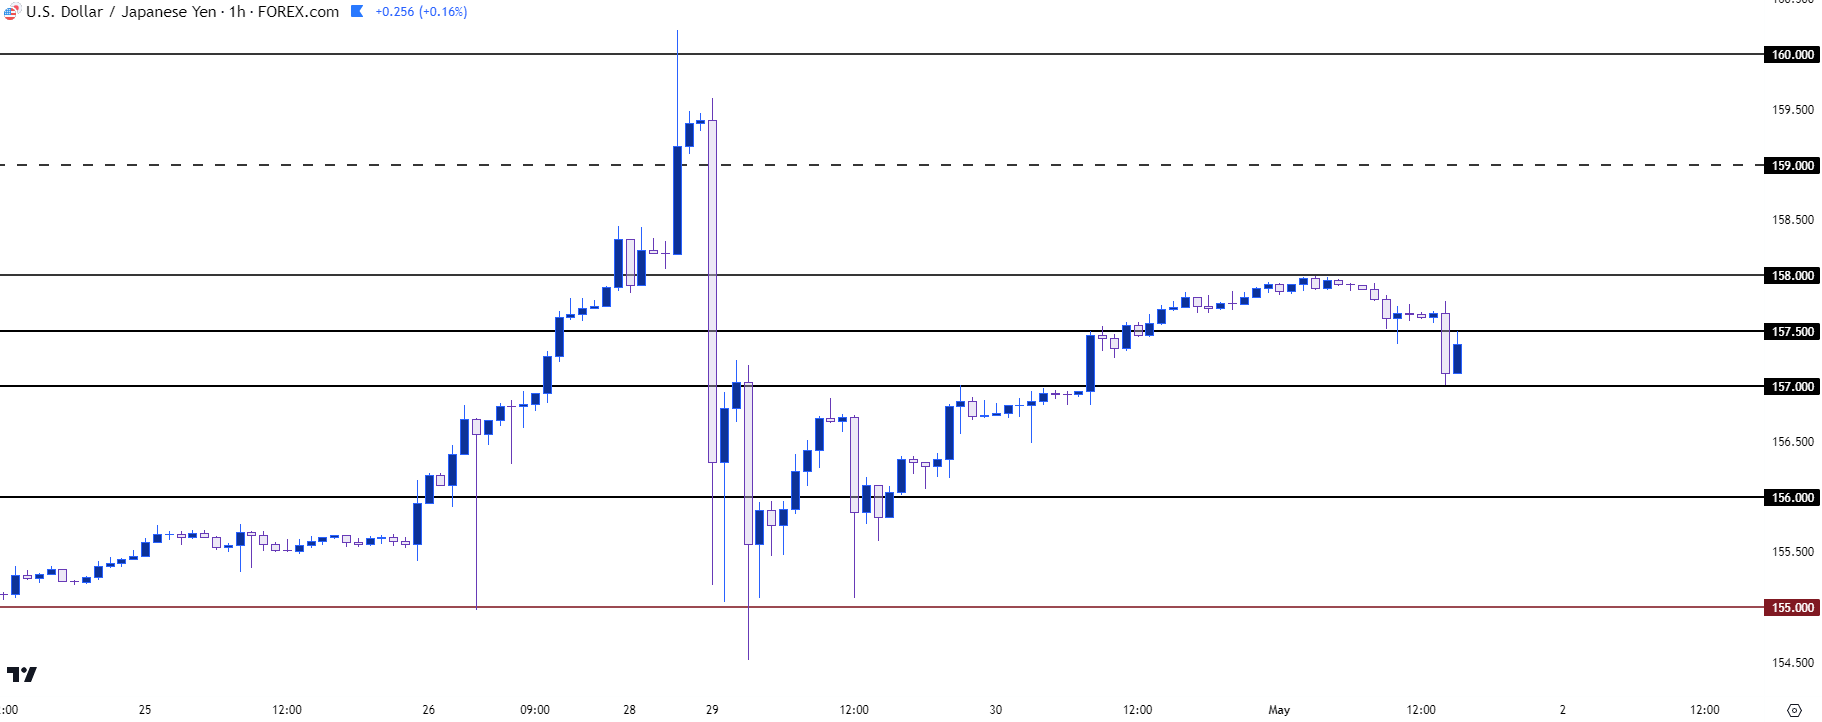 Chart prepared by James Stanley, USD/JPY on Tradingview
USD/CAD
USD/CAD has had a few clean technical items of late. I had looked at this a couple of weeks ago when USD/CAD began another test of a key spot of resistance. In that article, I also highlighted the 1.3652 Fibonacci level as support potential, which led to a strong bounce yesterday.
But with USD-weakness back on the menu the big question now is whether that support can hold a re-test; and if it can, this could remain as one of the more attractive bullish USD themes on the basis of the fact that the Bank of Canada seems much closer to cutting rates than the Federal Reserve.
USD/CAD Daily Price Chart
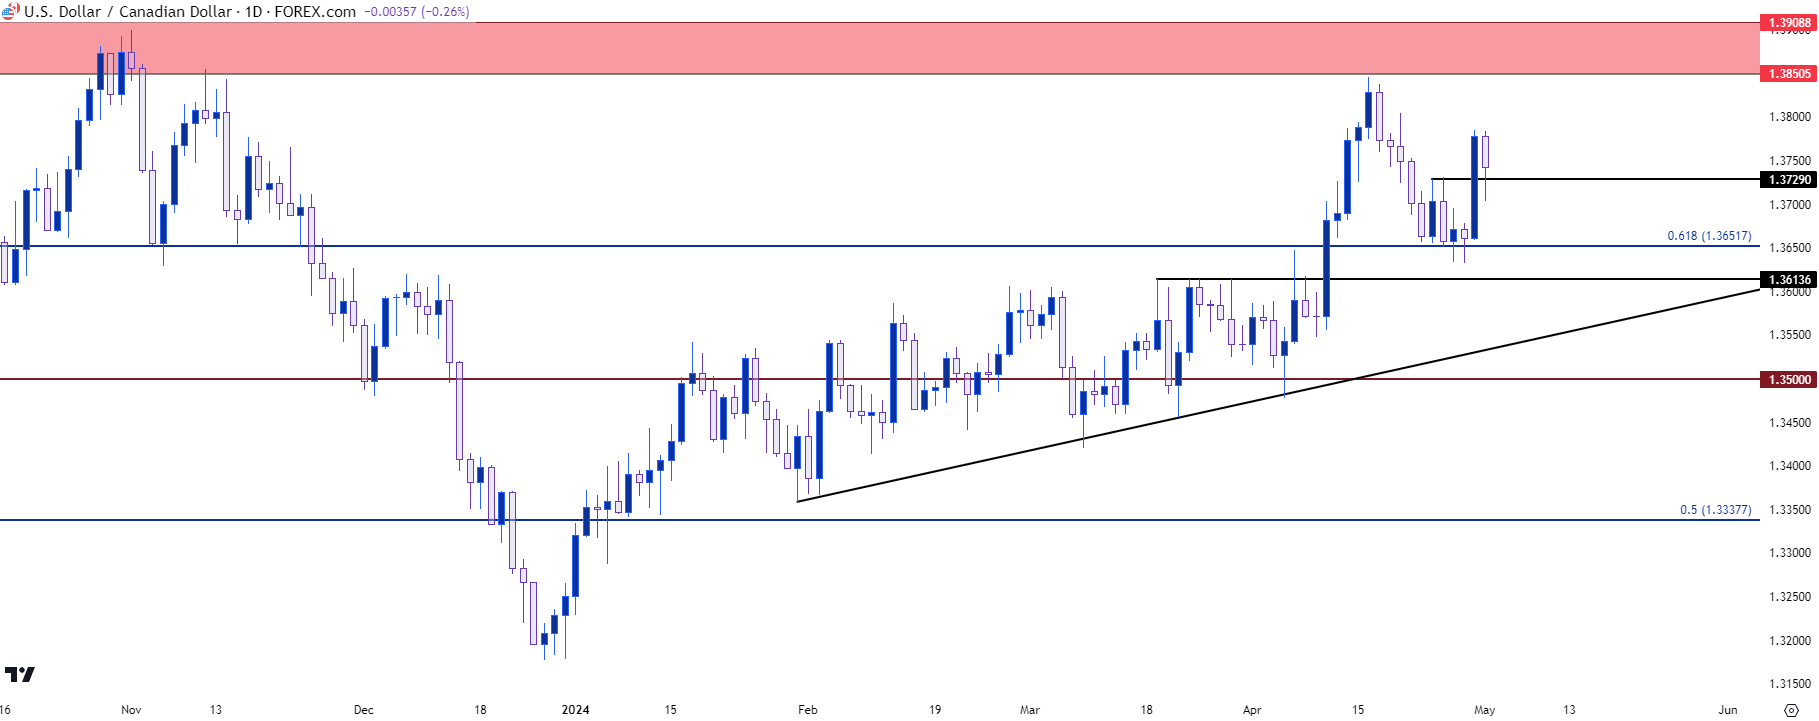 Chart prepared by James Stanley, USD/CAD on Tradingview
Gold
Gold was very overbought just a couple of weeks ago with RSI nearing the 80-level on the weekly chart, which is pretty rare. Bears had an open door to run a breakdown yesterday but could not get very far below the prior low, and a trendline projection at those lows helps to make a falling wedge formation.
For resistance, I’m tracking a prior spot of support that’s confluent with the upper trendline of the formation and that runs from $2319-$2326. That came into play during the press conference, but bull shied away, and prices have started to pullback from that zone.
This now puts the focus back on $2300-$2304 to see if bulls can hold a higher-low. There’s also a spot at $2310 which would be a more aggressive show of higher-low support and that similarly remains of interest.
Gold (XAU/USD) Four-Hour Price Chart
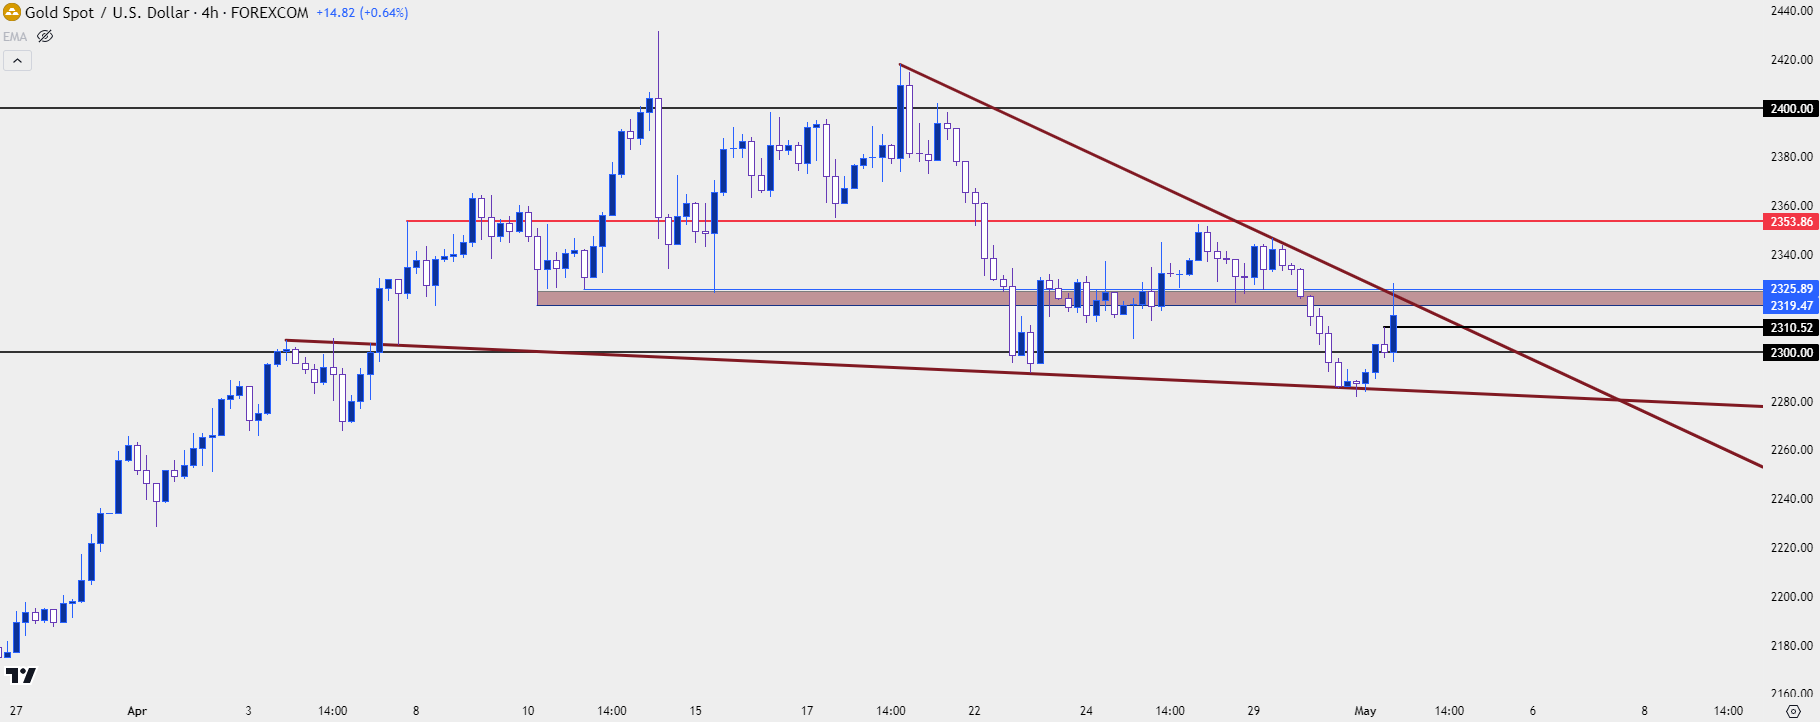 Chart prepared by James Stanley, Gold on Tradingview
--- written by James Stanley, Senior Strategist


