
U.S. Dollar Talking Points:
- Next week brings the March FOMC rate decision, and while there’s little expectation for any actual change to rates, what the Fed says in the Summary of Economic Projections can be impactful. The rest of the calendar remains busy, as well, with rate decisions out of Japan, Australia, and the U.K. to go along with several inflation prints.
- The Fed has long forecast rate cuts beginning at some point this year, but data has remained strong enough to keep that as a question. The past week saw another above-expectation CPI print, and that was followed by a large beat for PPI on Thursday.
- I’ll be looking into these setups in the weekly webinar on Tuesday, and you’re welcome to join. It’s free for all to register: Click here to register.
The U.S. Dollar has put in a bounce this week after a fast sell-off the week before. There were some large drivers in the past week as CPI came out above expectation and PPI showed a massive beat when it was released on Thursday. It wasn’t bright everywhere, however, as the U.S. retail sales print on Thursday came in below-expectation and this illustrates a common theme so far in 2024, where some data points remain very strong and others have started to look a bit more weak.
We can even span that argument through the topic of inflation and this was something that was on full display a few weeks ago around the most recent release of Core PCE, which is often considered to be the Fed’s preferred inflation gauge. That data point has fallen dramatically over the past six months and appears to be on its way back-below 2%, as can be seen below.
But, if we look at inflation from a different vantage point, using Core CPI, well inflation looks more ‘sticky’ or ‘entrenched,’ as there’s now been six consecutive months of Core CPI printing within a 0.3% band of the 4% marker, as you can see from the below chart.
U.S. Core CPI (blue) v/s Core PCE (orange), YoY since Jan 2021
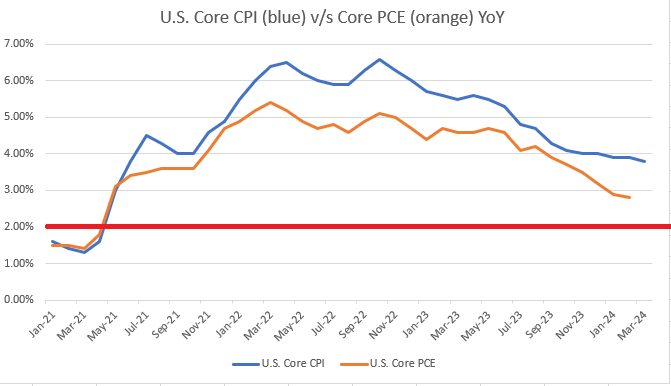
Chart prepared by James Stanley
While the two data points above may seem to balance out, we can incorporate some additional context by focusing on employment, which has remained fairly strong as seen through the NFP report. That strength took a step back last Friday when the unemployment rate surprised to the upside, but Average Hourly Earnings, another data point speaking to inflationary tendencies, remained strong. So, again, somewhat of a mixed bag or, perhaps better said, a ‘Choose Your Own Adventure Novel.’
On the part of the Fed, their drive has seemed fairly clear and I spoke to this shortly after last month’s CPI print. That was the fifth consecutive month of ‘sticky’ inflation around that 4% mark, and that shocked markets, leading to a run of USD-strength while causing equity and gold bulls to take a step back. But, that didn’t last for long as Chicago Fed President Austan Goolsbee tamped that down a day later, saying that market participants should avoid getting ‘flipped out’ about the CPI print.
In short order, the USD had started its descent and equities pushed back into rally mode. That dynamic largely drove through the end of last week, with a bit of reversion showing this week as investors tightened up ahead of the FOMC.
In the U.S. Dollar, the levels that I discussed in the Tuesday webinar remain valid. As of this writing there’s a resistance test taking place at the 103.46 Fibonacci level, which was also a late-February swing-low. Above that, the next point of resistance resides at the 200-day moving average, and if bulls can mount a trend above that level the prospect of bigger-picture strength will begin to look more attractive. Above that, there’s deeper resistance potential at 103.98, 104.21 and then at 104.38 before February resistance of 104.78-105.00 comes into the picture.
For support- the same zone of resistance from that Tuesday webinar remains in-play, as that plots from 103 up to the 103.19 Fibonacci level. And below that is a significant point of interest at 102.55, which is a Fibonacci level that helped to cauterize the low from the week before which was right around the NFP print.
U.S. Dollar Daily Price Chart
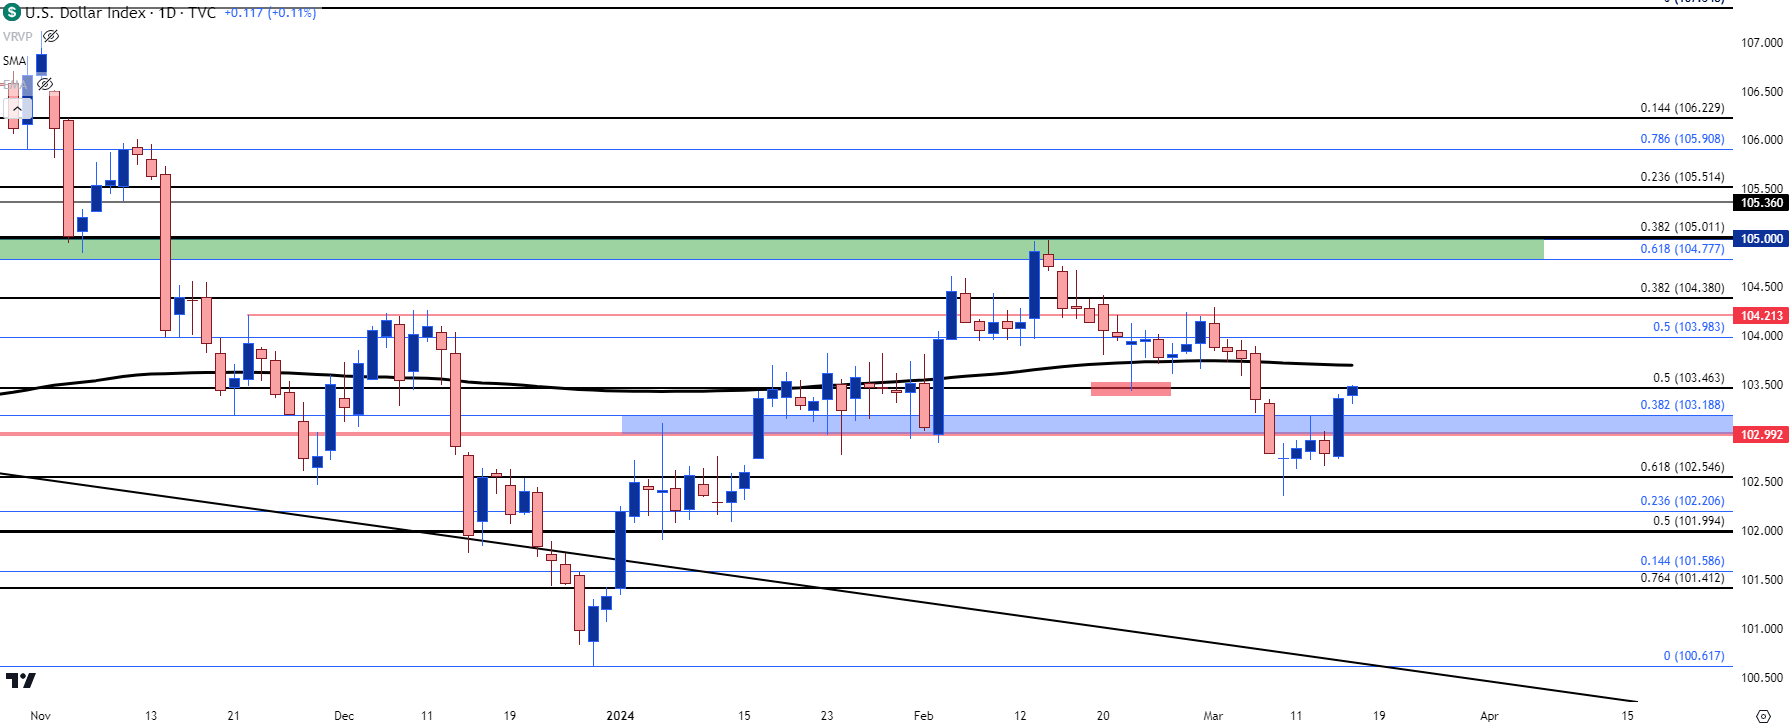 Chart prepared by James Stanley; data derived from Tradingview
EUR/USD
The European Central Bank has been evasive on the topic of rate cuts in an effort of apparent opacity. If there was the thought or perhaps the fear that the ECB may be kicking rates lower well ahead of the Fed, that could lead to a run of Euro weakness and USD-strength, which could serve to bring more inflation back to Europe while stepping on growth in the U.S. This seems to be something that both central banks would like to avoid and over the past 15 months, EUR/USD has built into quite the range. That longer-term, mean-reverting backdrop remains in-place today, but on an intermediate-term basis, there’s been a bullish trend of late that may have scope to revisit the 1.1000 or perhaps even the 1.1100 handle if the Fed is dovish at next week’s rate decision.
That recent intermediate-term bullish trend in EUR/USD started last month on the same day of the Austan Goolsbee comment regarding market participants getting ‘flipped out’ about the CPI print, so there’s a clear illustration of FOMC dovishness bringing impact to the matter, even within the confines of a longer-term range.
On the below chart, we can see price testing the same support zone looked at in the Tuesday webinar, and there’s also a bullish trendline here as derived from February and March swing lows. Deeper support potential exists at the 200-day moving average just below, after which prior support comes into view around the 1.0800 handle.
EUR/USD Daily Price Chart
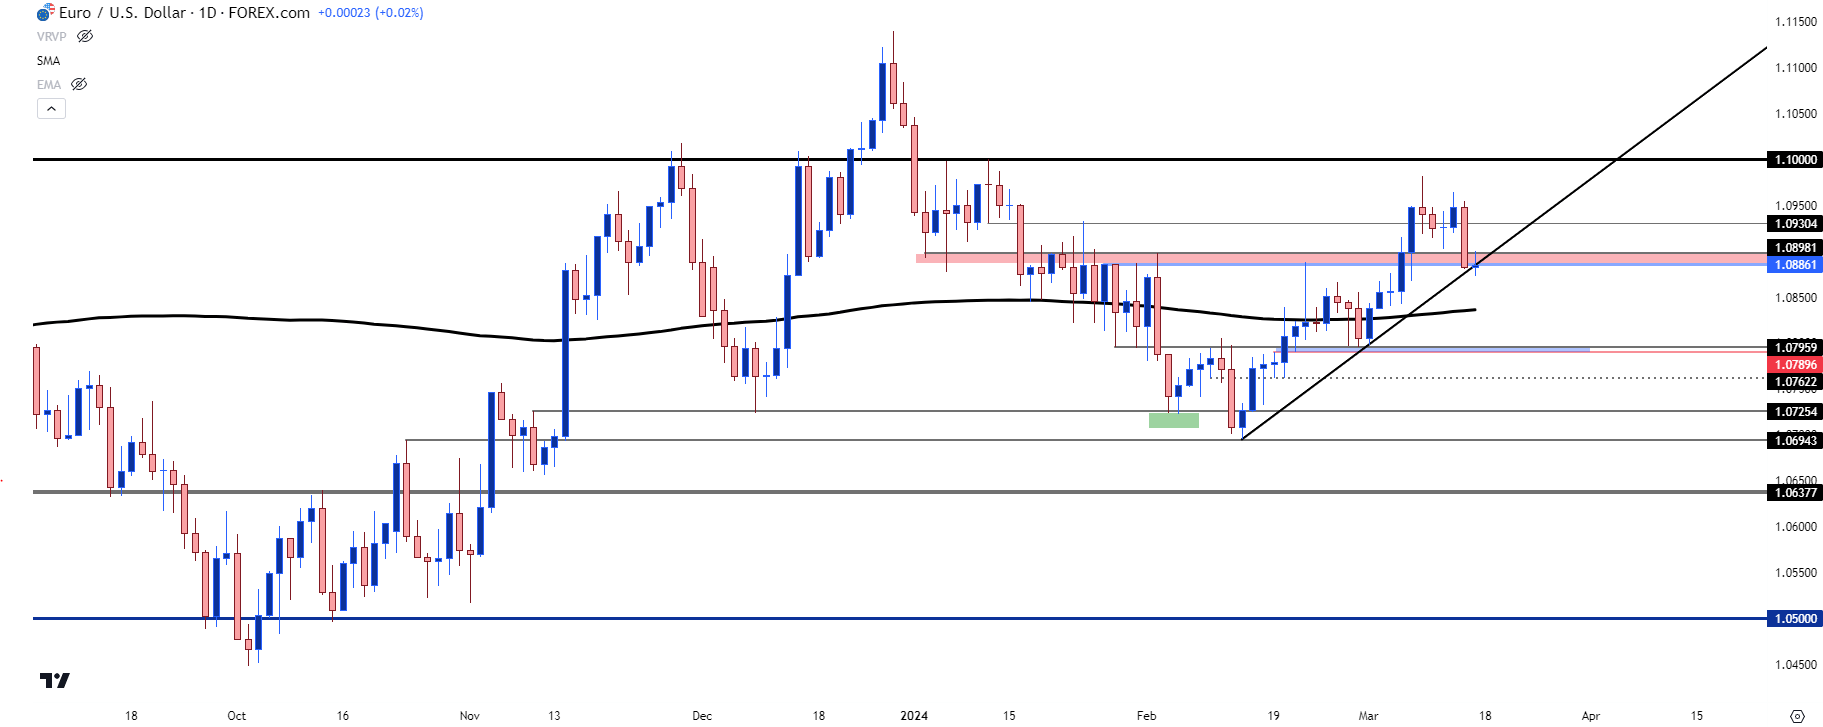 Chart prepared by James Stanley, EUR/USD on Tradingview
GBP/USD
On the morning of the FOMC rate decision, we’ll get the most recent CPI read out of the U.K. and this could retain some importance in GBP/USD. The morning after brings the Bank of England’s rate decision so there’s additional context for volatility even after Wednesday. Sterling has been relatively strong so far this year and that’s helped GBP/USD to hold a more bullish structure than what’s been seen in EUR/USD above. But, since last week’s NFP report, the pair has been pulling back and price spent this week testing support at prior resistance without bulls re-taking control.
At this point the pullback has taken on the form of a falling wedge, and that support at prior resistance structure remains in-place. As I’ve been saying in webinars of late, GBP/USD could be a more attractive venue for USD-weakness themes than EUR/USD, and the fact that EUR/USD remains in that longer-term range while GBP/USD established a fresh seven-month high last week further illustrates that dynamic.
But, it was around that Austan Goolsbee comment the day after the CPI release in February where GBP/USD set a higher-low at the 200-day moving average and then started to march higher. I talked about this scenario in pretty close depth as it was setting up in the accompanying webinar.
GBP/USD Eight-Hour Price Chart
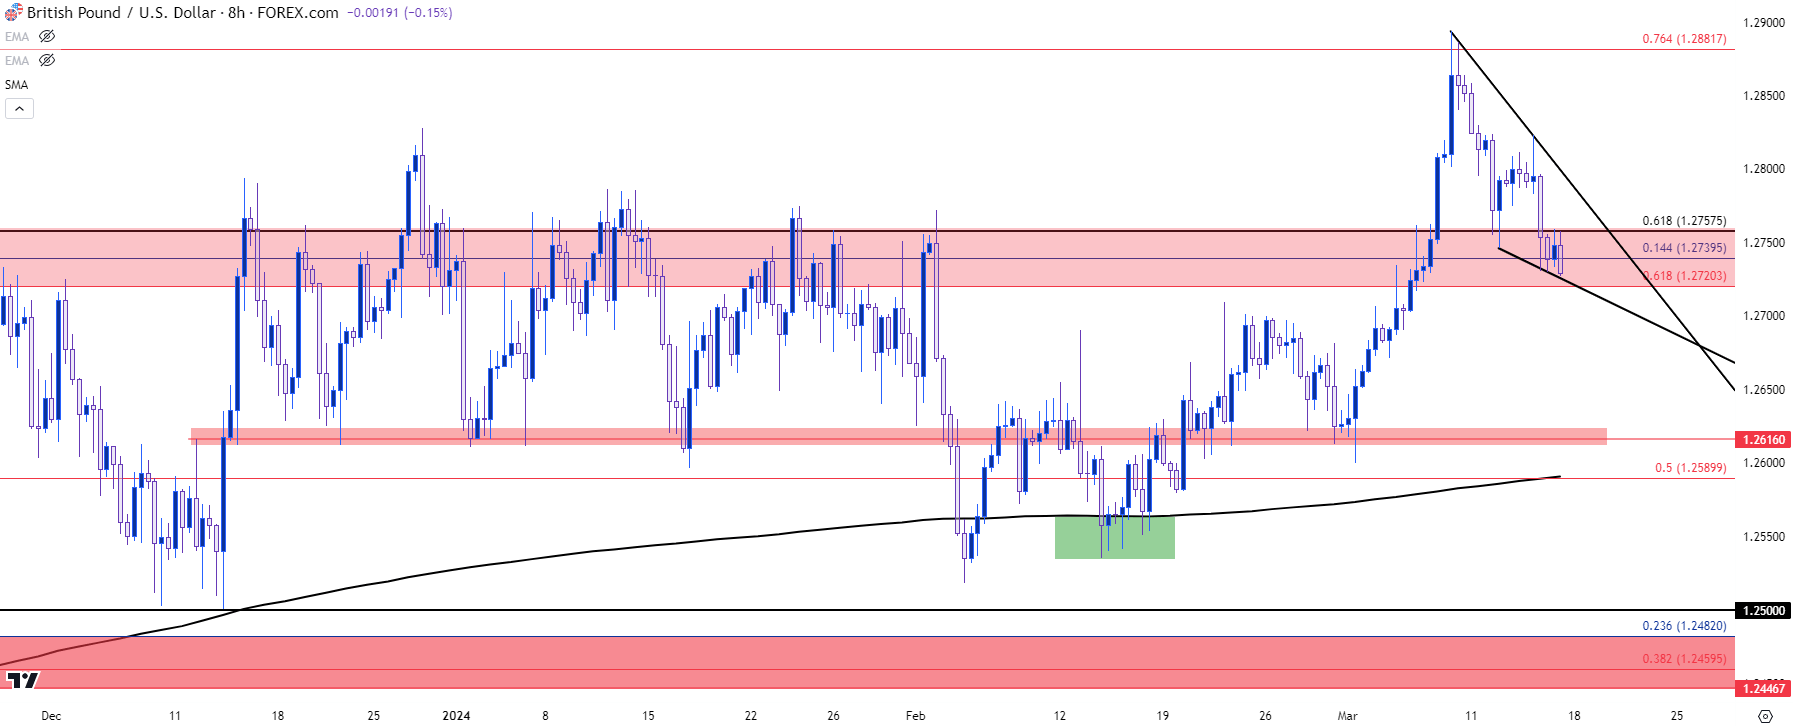 Chart prepared by James Stanley, GBP/USD on Tradingview
USD/JPY
So, this is the big one in my opinion, and by the time we get to next Wednesday’s FOMC rate decision we could be looking at an entirely different picture. But there’s growing speculation that the Bank of Japan could announce a move away from their negative rate regime at the rate decision on Monday night (Tuesday morning in Asia) and something like that could have massive impact on USD/JPY.
I had written about the matter on Wednesday and as I shared there, I have no idea whether the BoJ will make such a move at this point. In my opinion, the timing is inopportune for such a risk, especially from a traditionally conservative central bank. With the economy barely avoiding going back into recession, and with inflation already having fallen quite a bit over the past six months, even as Core CPI in the U.S. has pretty much flatlined, it doesn’t seem like the best environment to shake the branch of the carry trade and motivate bulls to jump off of the topside trend. Yen-strength could further evaporate inflation and put the BoJ in a spot with even less flexibility.
As we saw in Q4 of 2022 and 2023, the simple thought of reversal could be enough to break the seal on that theme. I talked about this in late-February, around the Core PCE print, as USD/JPY had just left the bottom of a falling wedge formation before embarking on a deeper pullback move.
That said, USD/JPY has some complication as that crowded carry trade has, so far, seen a brick wall of resistance at the 150-152 area and this is where the Finance Ministry has had a tendency to opine on the prospect of intervention. So, that may be enough to cap the top side of the pair, particularly if the Fed remains avoidant of the option of tighter monetary policy in the U.S. This could make USD/JPY one of the more attractive venues in scenarios of USD-weakness, such as we saw in Q4 of 2022. But, if the BoJ hikes rates and there’s some Yen-strength to go along with that USD-weakness, the move could be forceful.
Curiously, as reports ran rampant of a possible change from the BoJ in the latter portion of the past week, Yen-weakness continued to come back and, at this point, USD/JPY is testing resistance at prior support, which is just below that longer-term resistance at the 150-152 area.
As I had written on Wednesday, for those that are looking to fade this idea of a BoJ rate hike next week, there could possibly be more amenable pastures for Yen-weakness in a pair like GBP/JPY, or perhaps even EUR/JPY.
USD/JPY Daily Chart
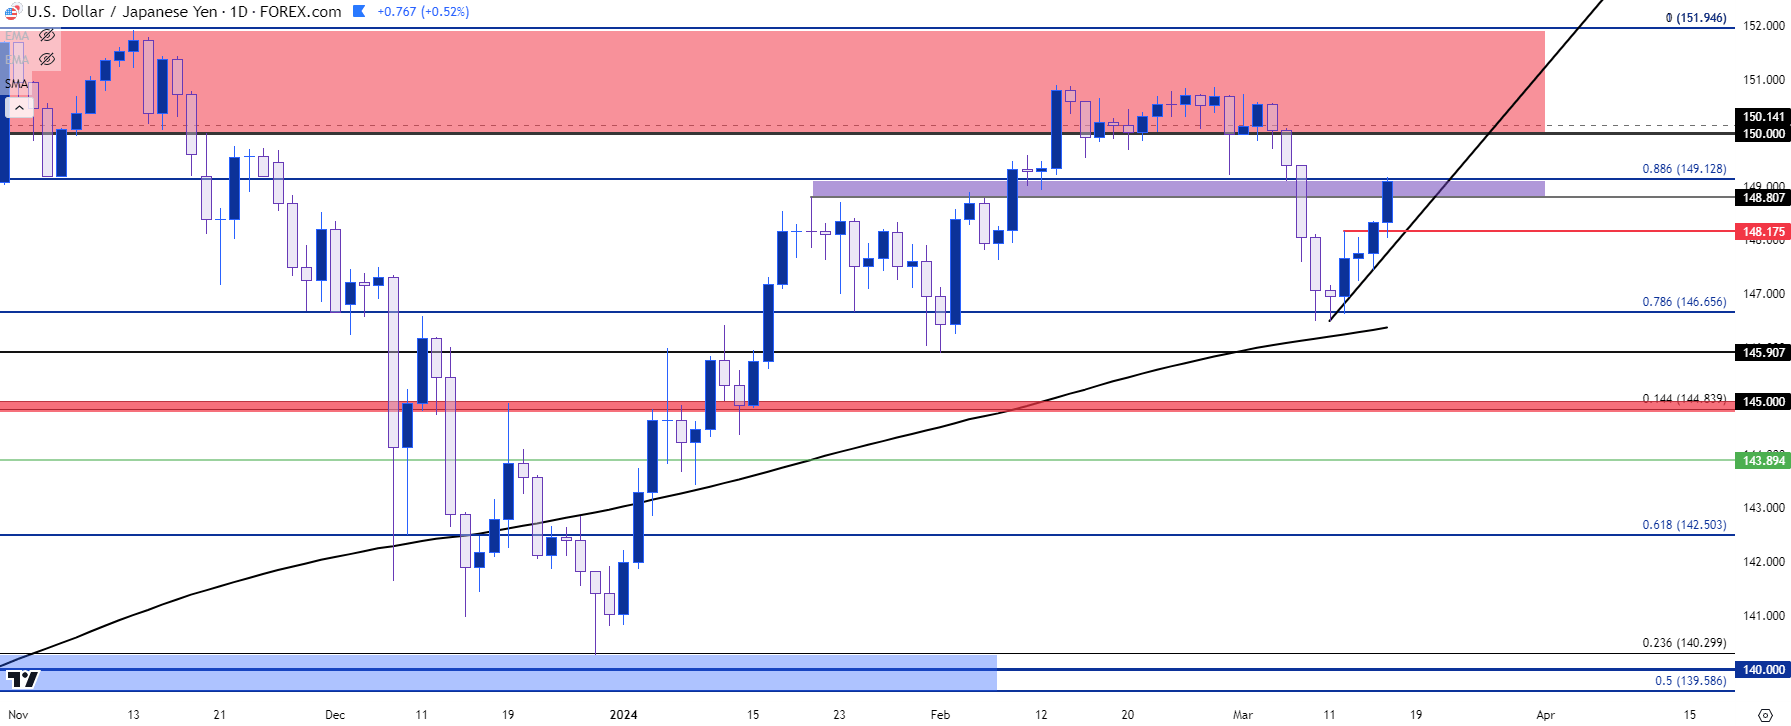 Chart prepared by James Stanley, USD/JPY on Tradingview
--- written by James Stanley, Senior Strategist


