
US Dollar Talking Points:
- Bears had an open door to run a breakdown in the US Dollar this week but could not take out support at the April and May low.
- The NFP report on Friday was very strong, highlighting continued strength in the US labor market. The big question now is how that will impact the Fed’s forecasts that are set to be released next Wednesday at the rate decision.
- I’ll be discussing these themes in-depth in the weekly webinar on Tuesday. It’s free for all to register: Click here to register.
It was a big week for the US Dollar in the headlines and the data front, although it may not be as visible on the weekly chart at this point.
There were three items from the economic calendar that really stuck out to me, and I think that’ll have some bearing on price action next week as we move into the FOMC meeting on Wednesday. The week began with a disappointing manufacturing PMI report, which gave bears a sizable push down to support. That support was between April and May swing lows, spanning from 103.88 up to 104.08.
And then on Wednesday, we saw the services PMI report come out very hot and well-above expectations; and given the heavy allocation of the US economy to services this would seem to be more important than the disappointing manufacturing component that we saw on Monday. And while this gave bulls a push, they were unable to take-out the 200-day moving average which held as resistance with price retreating back to support.
And then on Friday we saw a really strong NFP report with the headline number coming out almost 50% higher than the expectation. Average hourly earnings, the inflation component of the report highlighting wage growth, printed at 4.1% against the expected 3.9%, which is something that will likely get the attention from the FOMC in their continued fight with inflation. On the other side of the matter, the unemployment rate ticked up to 4.0% and this was above the expected 3.9%, but it seemed to matter little as it couldn’t offset strength in the headline number.
In response, the US Dollar posed a brisk move that erased earlier-week losses; and DXY is in the process of invalidating the descending triangle formation that had built with horizontal support and lower-highs through the month of May.
US Dollar Daily Price Chart
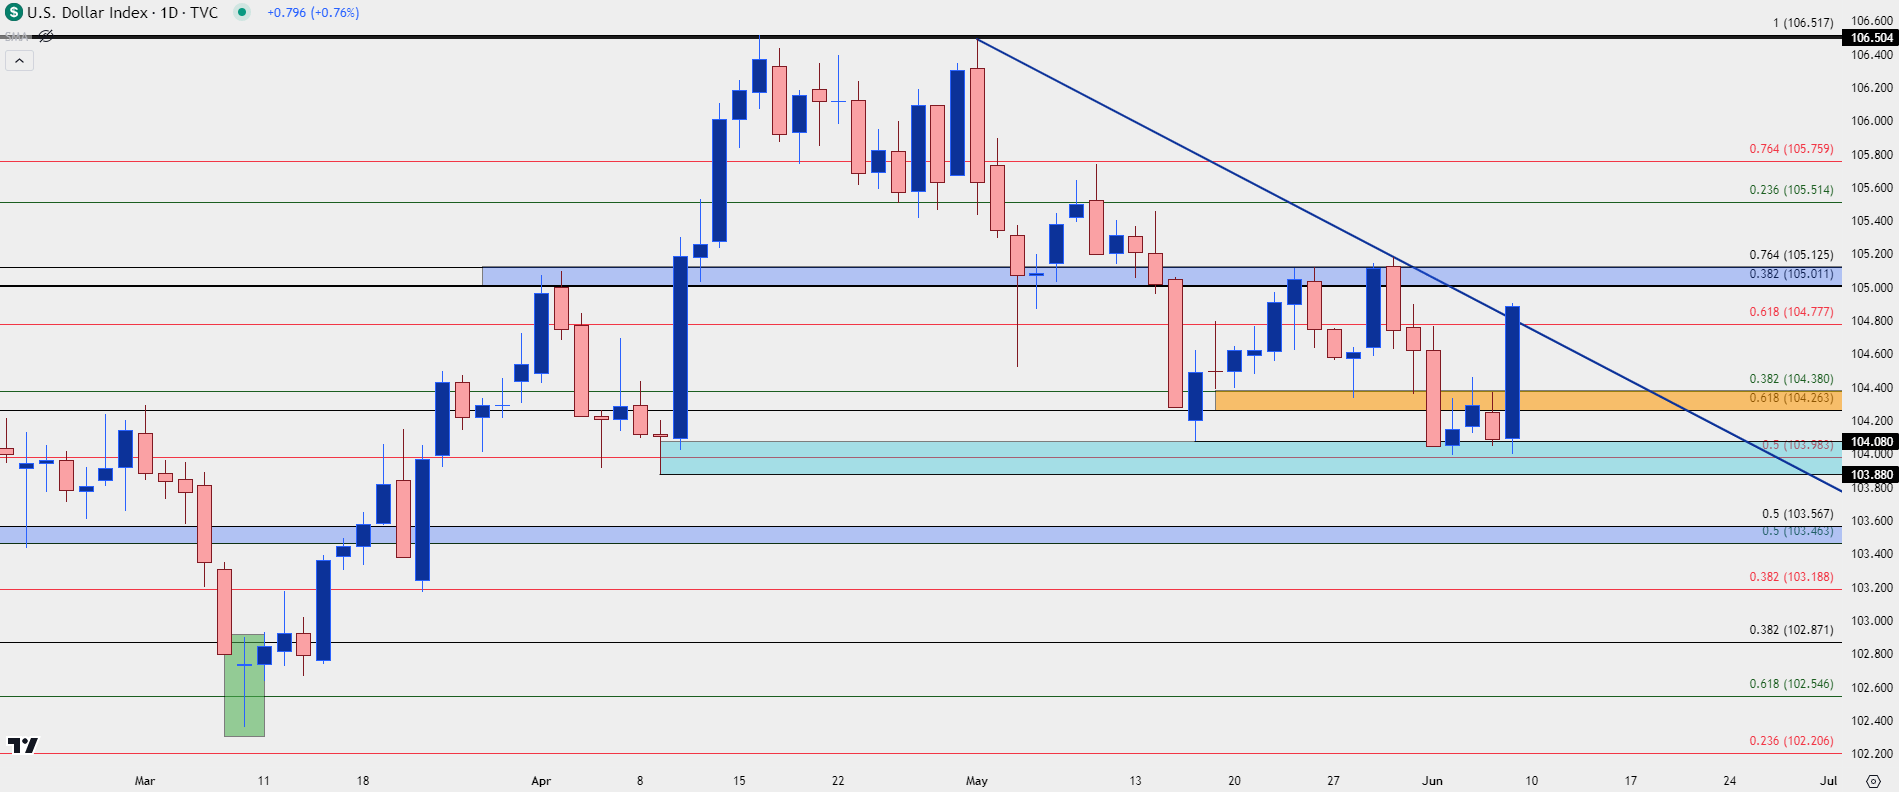 Chart prepared by James Stanley; data derived from Tradingview
USD Big Picture
This week saw the Bank of Canada and the European Central Bank kick off rate cutting cycles. And the hope around the Fed has long been that they too would be able to begin cutting rates at some time in 2024. But with the labor market remaining strong to go along with that very strong print of services PMI on Wednesday, there’s clear divergence in economic performance between the US and many other areas of the world.
But, to date, it’s really seemed as though no major central bank has wanted to stand out from the fray. And to be sure, there can be consequence of such. If Europe kicks into an aggressive rate cutting cycle while the Fed stands pat then EUR/USD could dive-lower, which could help to moderate US inflation but would also likely boost European inflation (like what was seen in mid-2022). Also of concern that is a hawkish twist at the Fed could further boost Treasury yields, which can fast become a hindrance to equities. These seem like consequences that the Fed may not want to deal with unless necessary.
From the weekly chart of the US Dollar, the 17-month range remains in-play. But there’s also a bullish scenario that can be entertained. I had previously remarked that as long as buyers held support above the higher-low that printed in April, just before the US CPI print, the door can remain open to continuation. So far that’s happened; and this week also saw the fourth consecutive weekly bar with a support test and hold of the 200-day moving average.
This puts the focus on 105-105.13, which held two resistance inflections last week.
US Dollar Weekly Price Chart
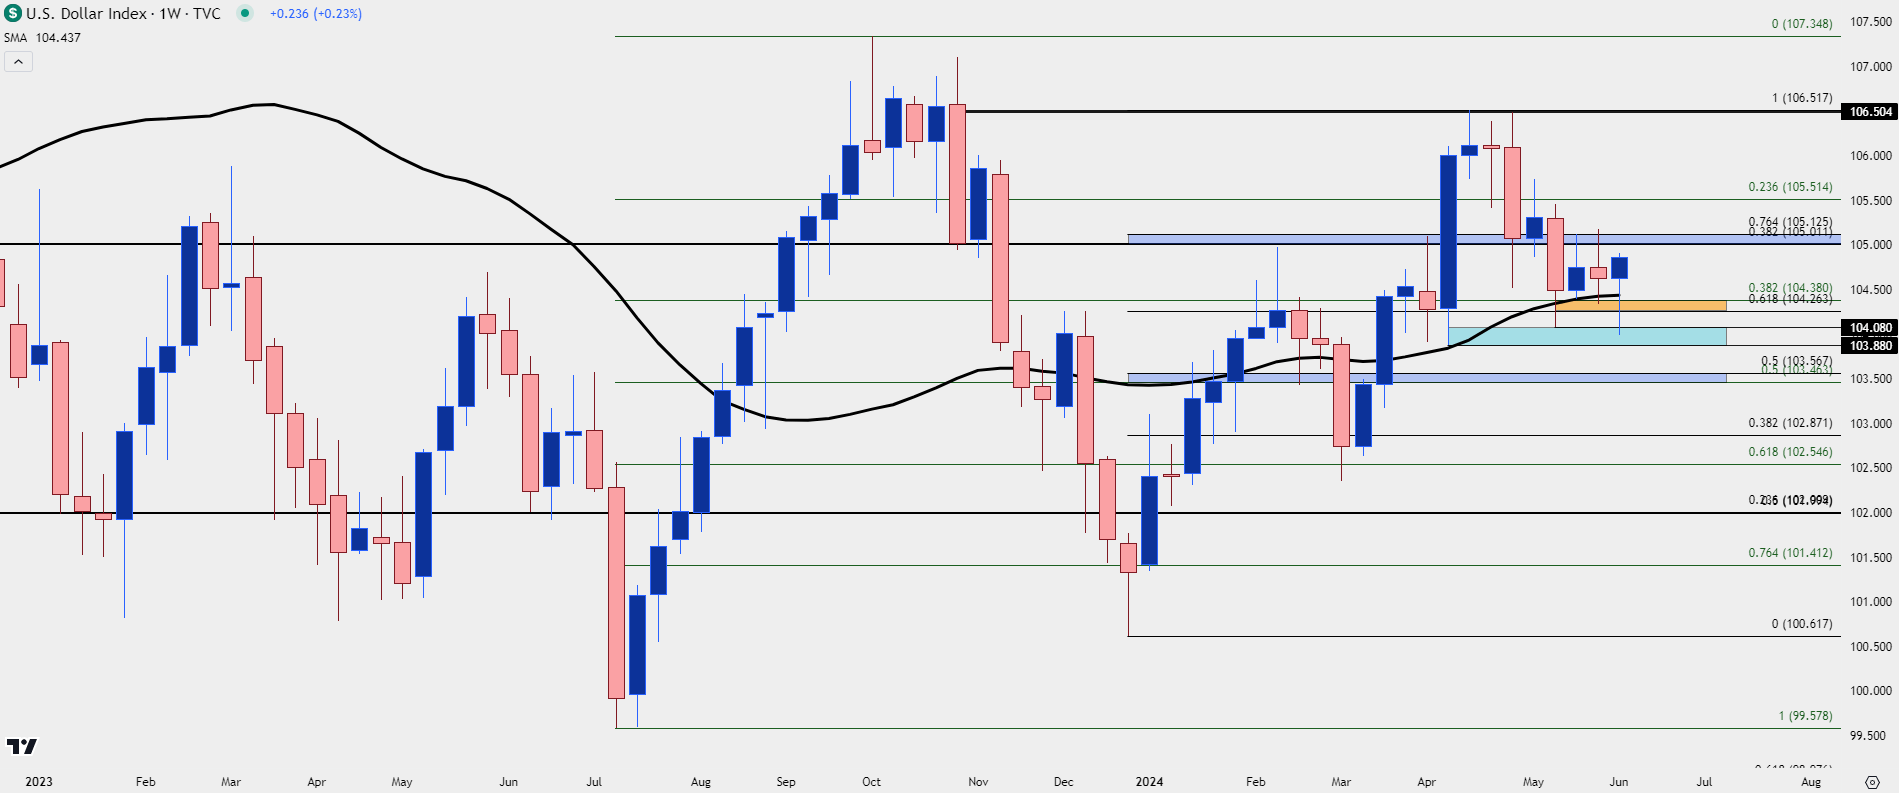 Chart prepared by James Stanley; data derived from Tradingview
EUR/USD
The ECB cut rates for the first time since 2019 in a move that was well-telegraphed. But they also talked down the possibility of another cut in July and kept the door open for September. It seemed to me that they wanted to avoid diverging too greatly from the Fed, but the big question now is whether data will allow for that and further, whether the Fed will begin to get more-hawkish in their projections next week.
EUR/USD has been strong since mid-April, just a few days after that US CPI report. Price tested longer-term range support at 1.0611 and that held the lows for a couple of weeks, with strength finally returning in early-May after the Fed and NFP.
Bulls even held a support bounce after the rate cut: But the Friday NFP report hit hard, and EUR/USD is working on its largest down day since the April 10th CPI report. It’s currently testing below the Fibonacci level at 1.0807 and there’s a couple of additional spots of support potential nearby, with the 200-day moving average and a trendline projection just below that.
EUR/USD Daily Price Chart
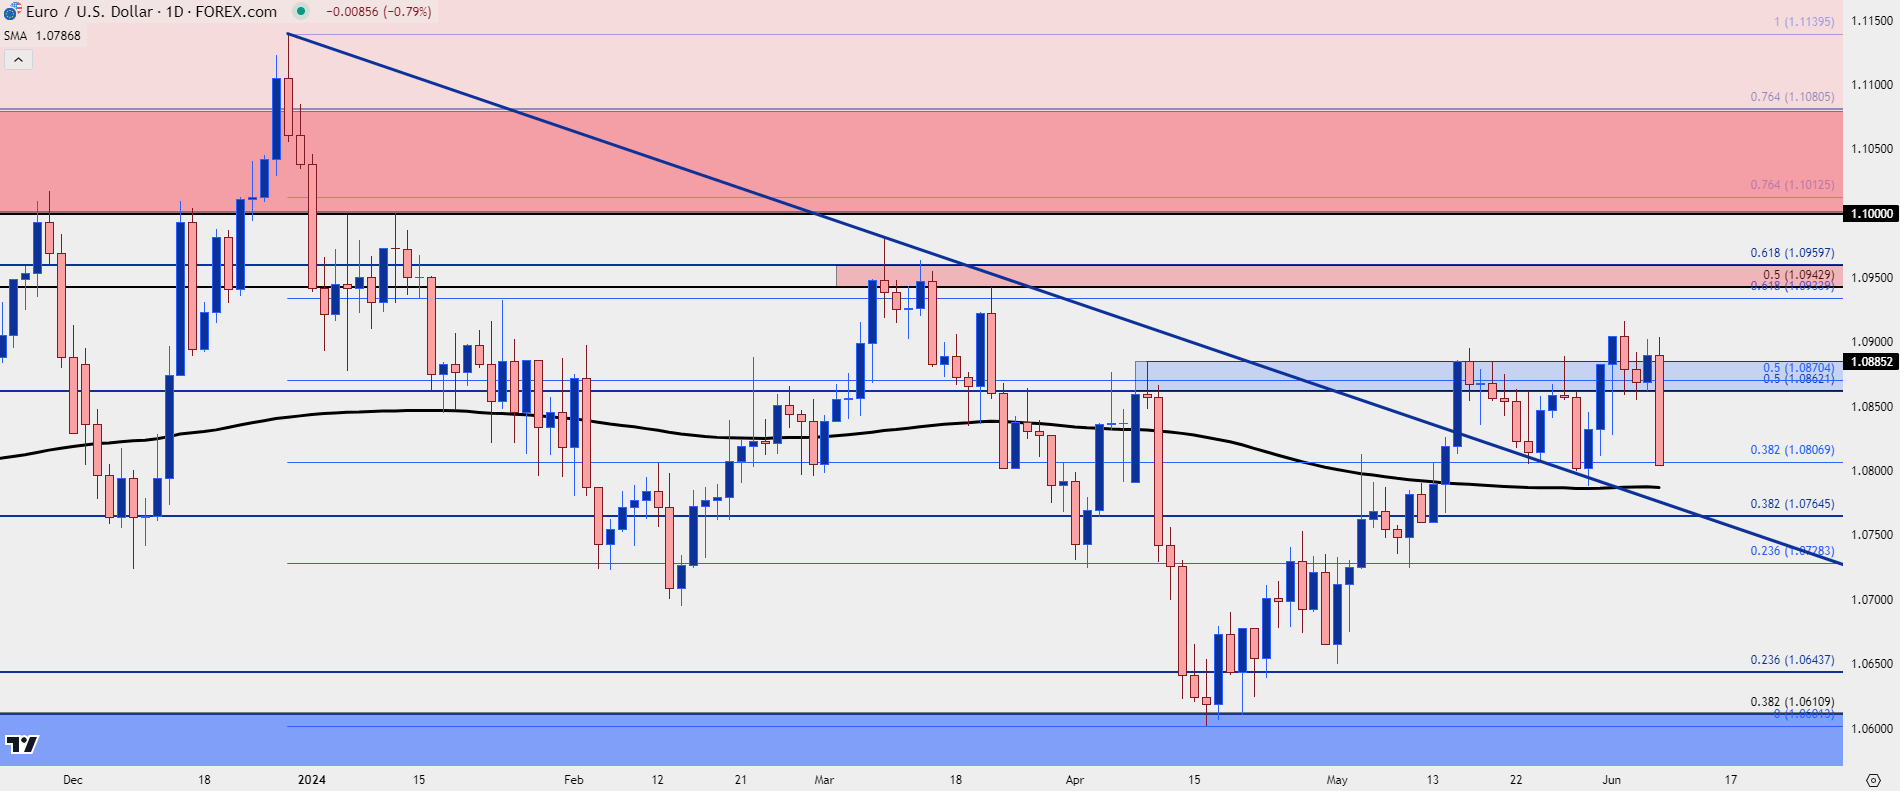 Chart prepared by James Stanley, EUR/USD on Tradingview
GBP/USD
GBP/USD set a fresh two-month-high three different times in the past week. But the 1.2800 level remained a spot that bulls could not leave behind, and as USD got jolted on Friday by the NFP report, so did GBP/USD.
The pair is now nearing support taken from prior resistance, in the same zone of 1.2692-1.2710 that’s been helping to hold the lows for three weeks.
For USD-weakness scenarios, for traders that want to look for USD-strength being faded, GBP/USD can remain as one of the more attractive major FX pairs on this basis of continued higher-highs and lows from the daily chart. I’ve been following this in webinars since early-May and the pair’s price action keeps the door open for continuation, at this point.
GBP/USD Daily Price Chart
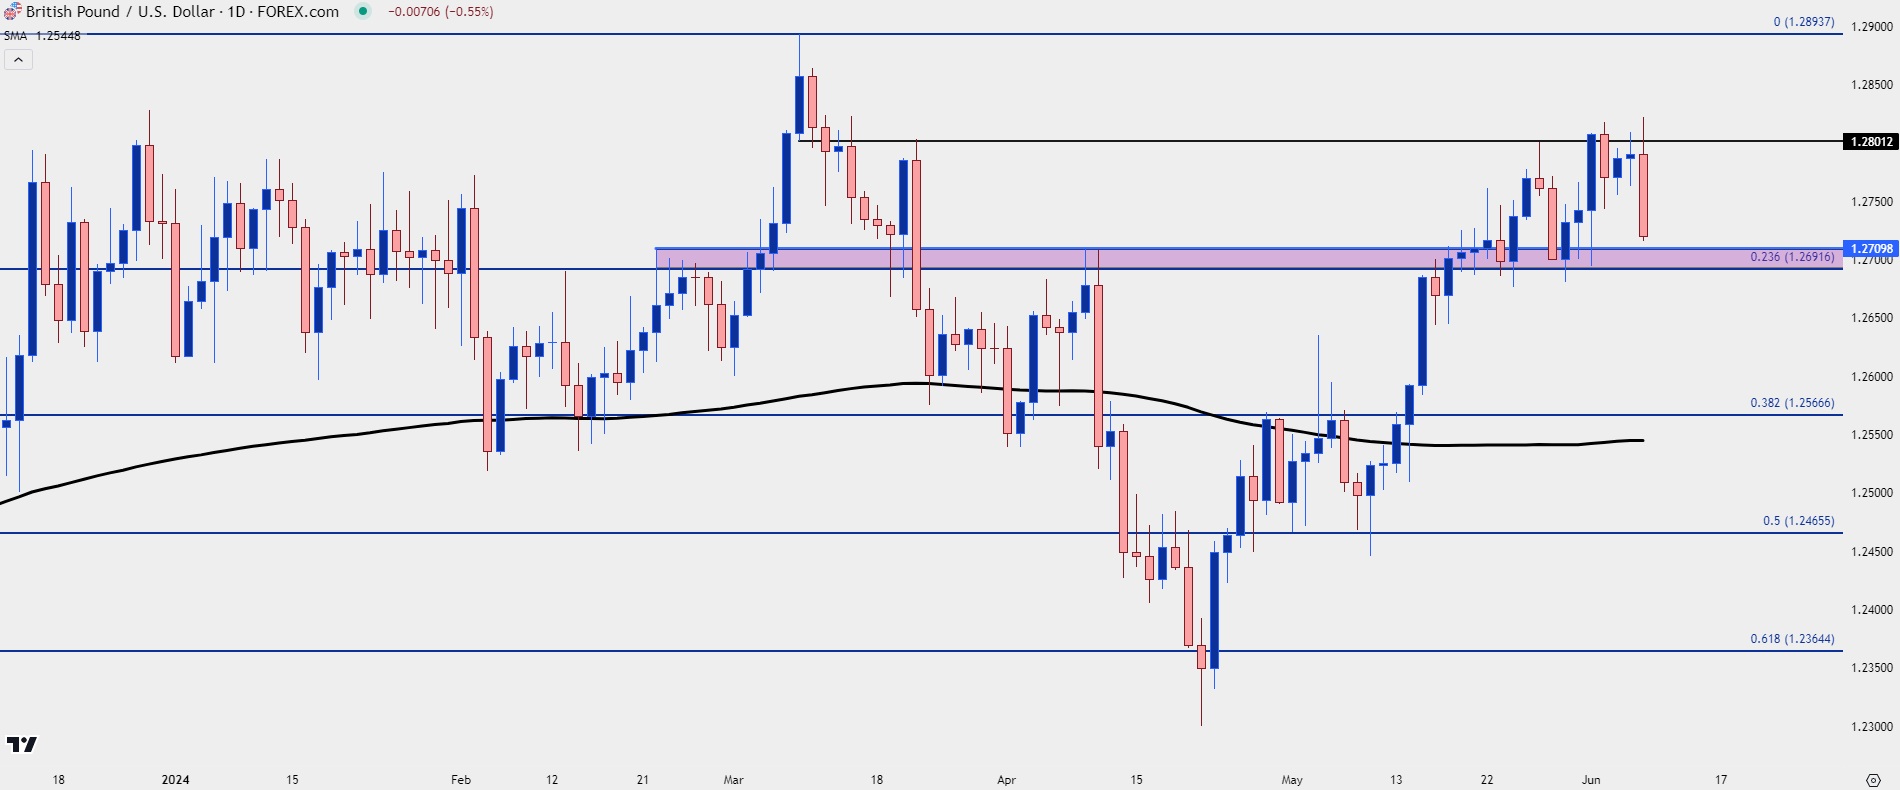 Chart prepared by James Stanley, GBP/USD on Tradingview
USD/CAD
On the other side of the US Dollar, for those looking at bullish continuation scenarios in the Greenback, USD/CAD can remain of interest. I’ve been tracking this setup in webinars of late for USD-strength scenarios and the pair pushed a breakout this week on the combination of a Bank of Canada rate cut and the strong NFP report.
If the Fed does take on a more-hawkish tilt next week, that would further expose divergence between the two economies and can give bulls another reason to push the trend forward.
In USD/CAD price action, it was the hold of higher-lows in late-May and then again on Monday that stuck out. Monday printed a doji with a higher-low and that was followed by strength on Tuesday to complete a morning star formation. Price is currently holding just inside of the monthly high, and there’s now higher-low support potential at prior resistance around the 1.3700 level.
USD/CAD Daily Price Chart
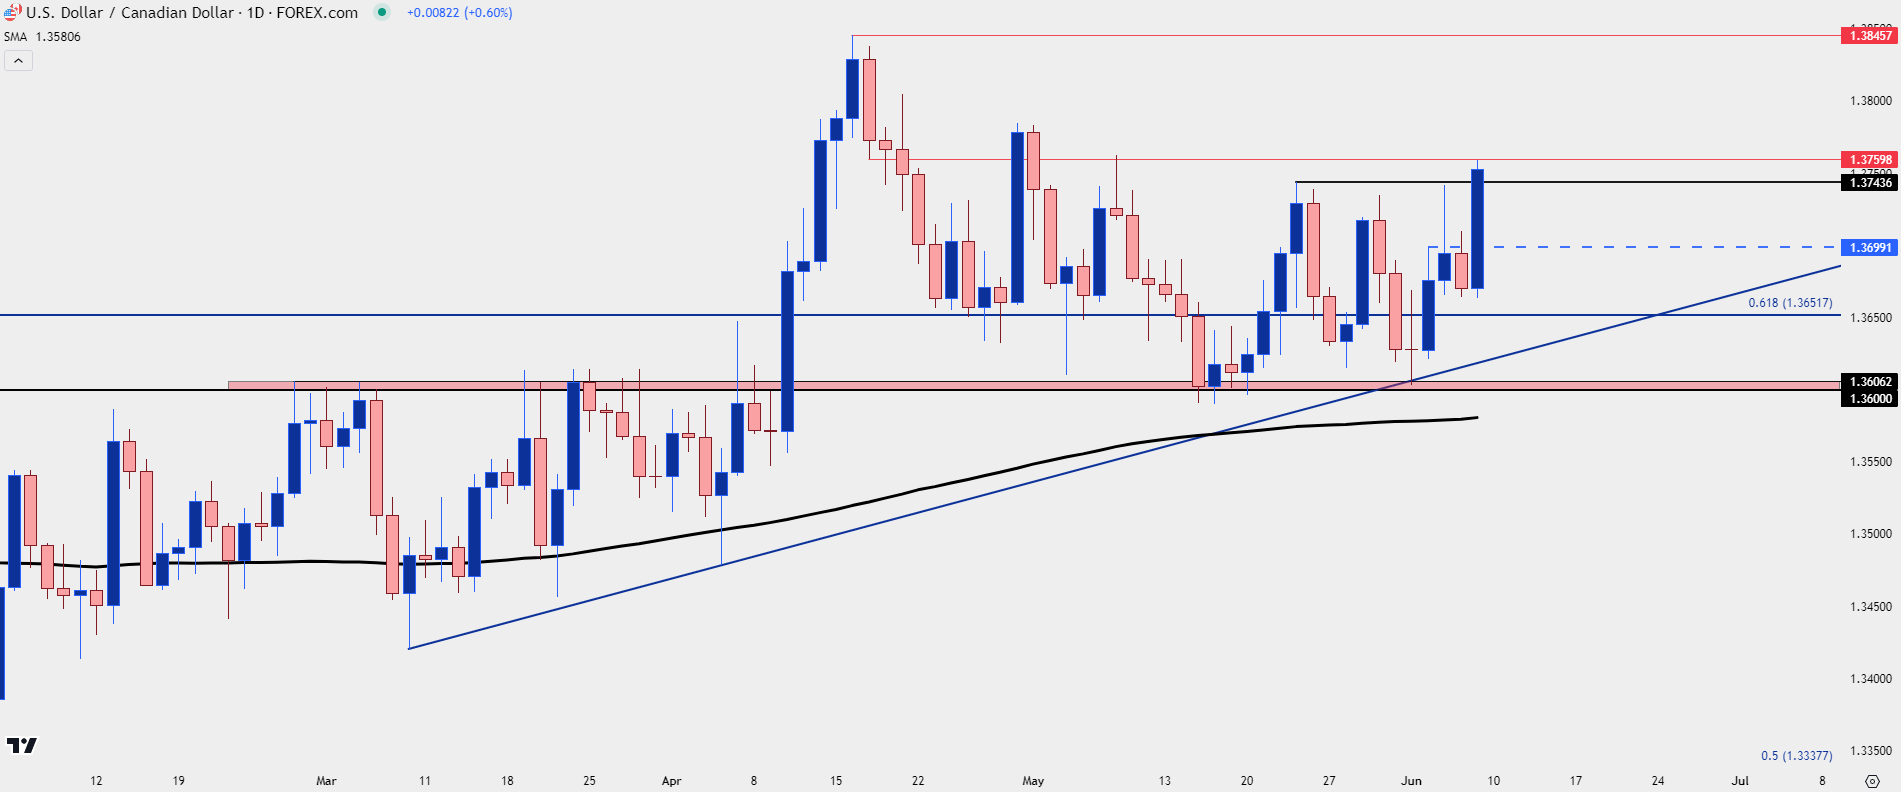 Chart prepared by James Stanley, USD/CAD on Tradingview
Gold (XAU/USD)
Gold was enjoying a positive week through early-Thursday trade. But that’s around the time that the 2378 resistance level came into play and despite numerous tests from bulls to take that level out, they failed to do so, and bears took over in early-Friday trade. This was the same resistance zone that I had warned of in the Tuesday webinar, and it made a large impact on the weekly bar for spot XAU/USD.
The NFP report gave sellers another shot in the arm, and they were able to drive all the way down to the monthly low, at which point the sell-off has stalled.
Gold (XAU/USD) Four-Hour Price Chart
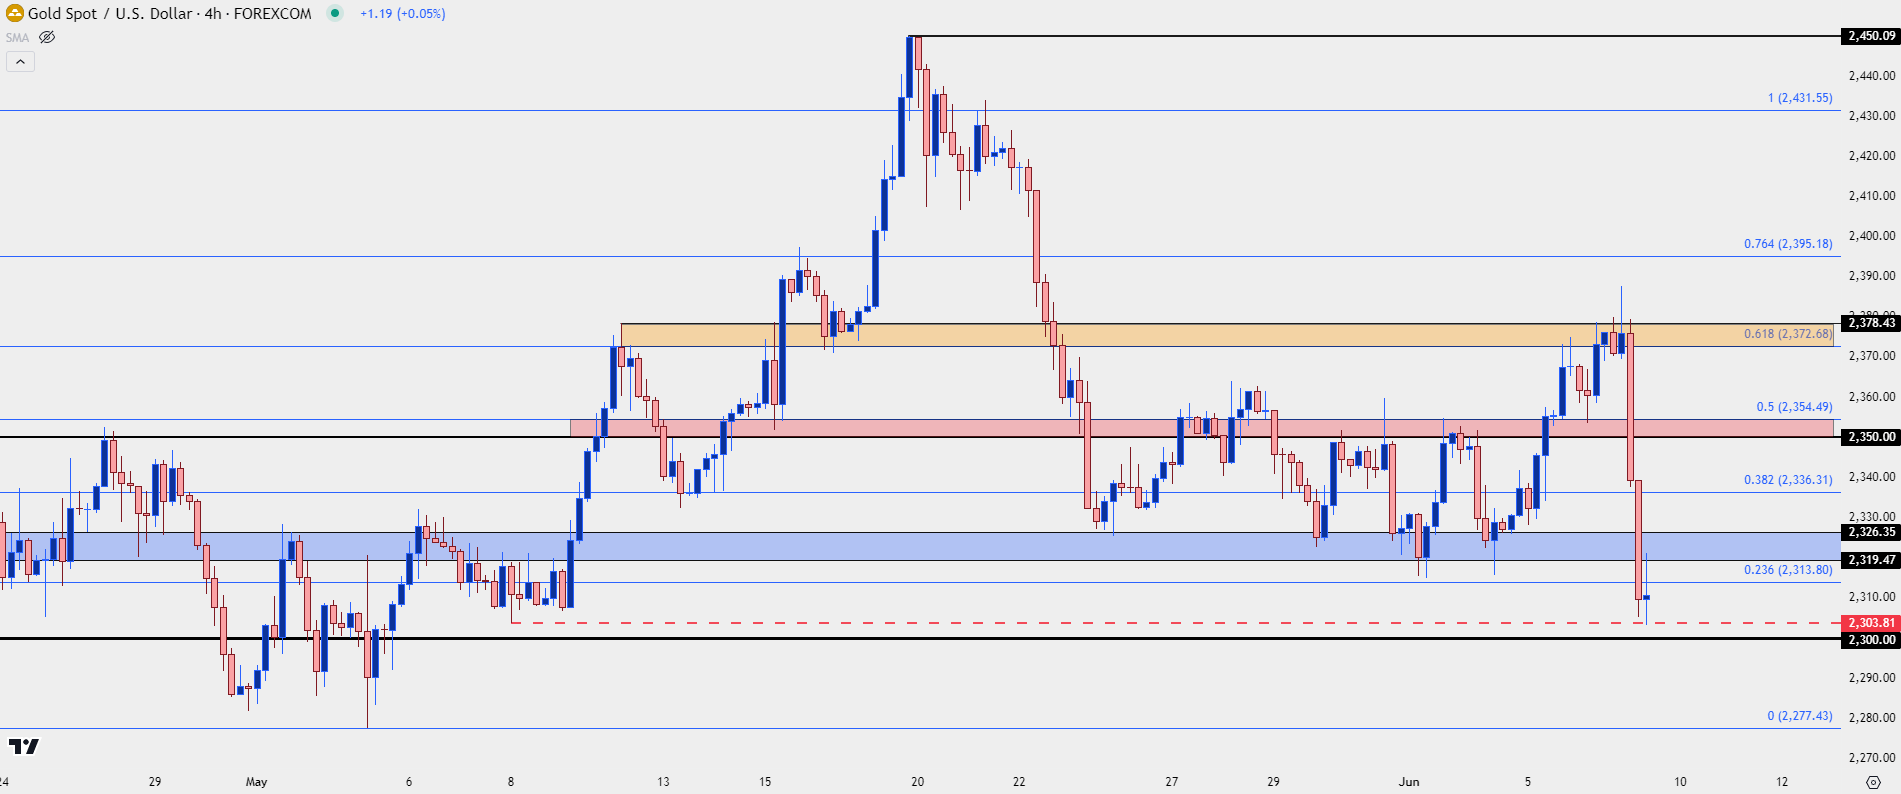 Chart prepared by James Stanley, Gold on Tradingview
Gold Support
Taking a step back to the daily chart shows that this isn’t the first time sellers have tested in the 2300 area. And so far, that’s been a big spot for swings as there’s been only one single daily close below the 2300 psychological level since the early-April breakout, and that was the day before the May 1st FOMC rate decision.
So, if the Fed gets significantly more-hawkish in their forecasts next Wednesday and this may even need the door opening to possible rate hikes, that support could be vulnerable. But if the Fed responds in the way that’s become typical, with a dovish appearance, bulls could have ammunition for another topside swing setup.
Gold (XAU/USD) Daily Price Chart
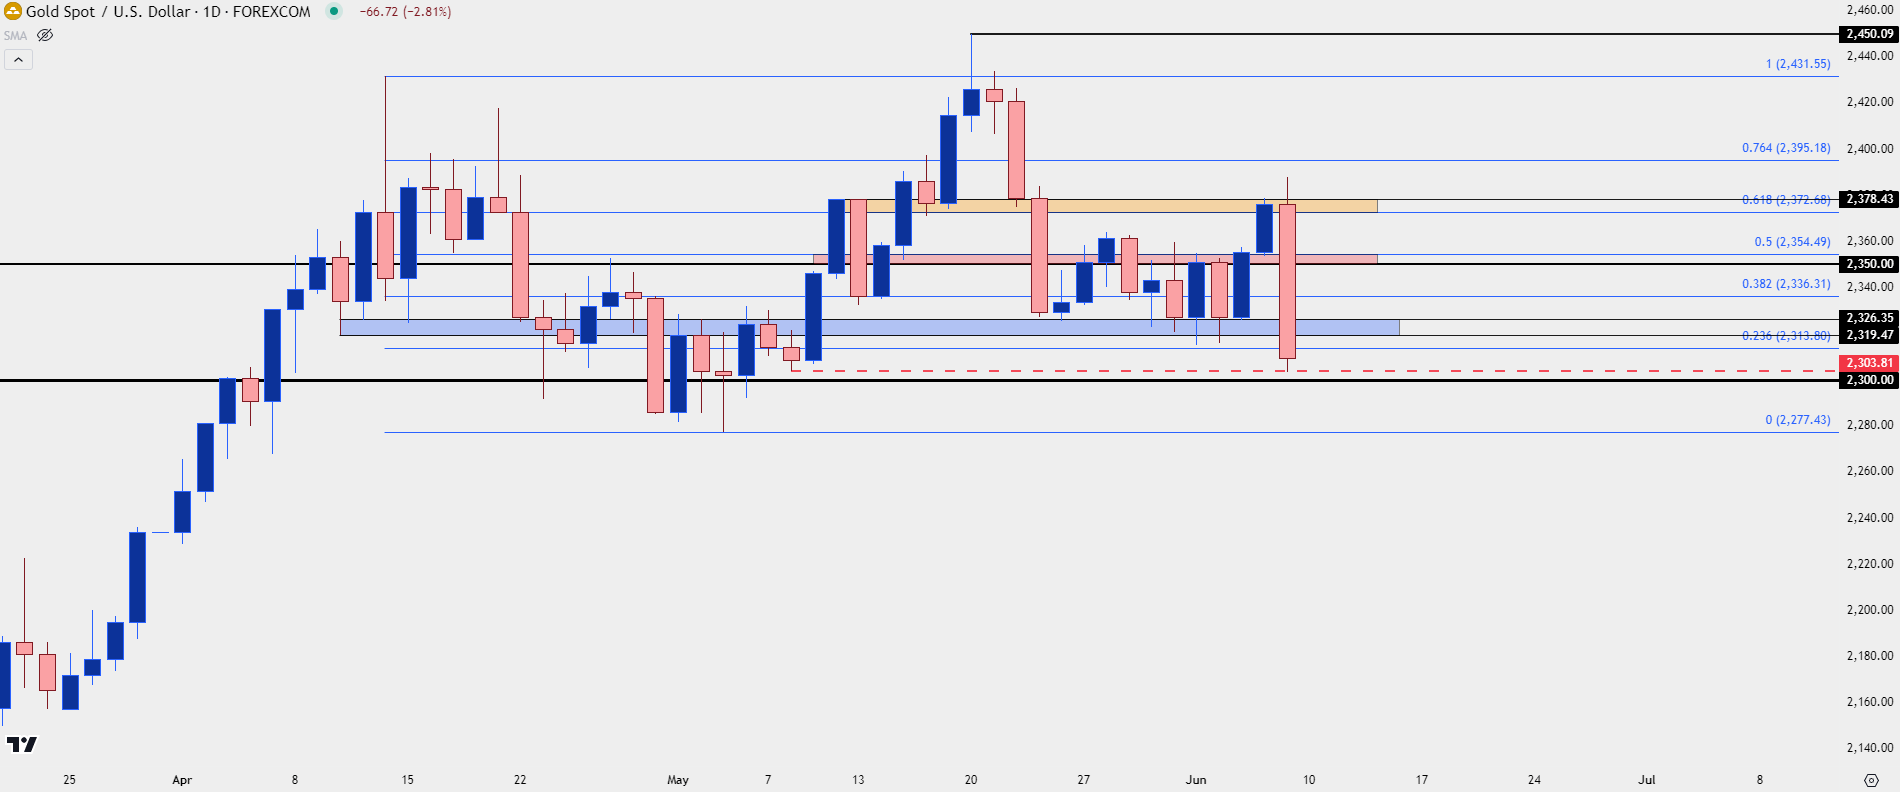 Chart prepared by James Stanley, Gold on Tradingview
--- written by James Stanley, Senior Strategist


