
US Dollar Talking Points:
- The US Dollar is re-testing its 200-day moving average after finding resistance at the Fibonacci level of 105.13 last week.
- From last week a key driver appeared, albeit temporarily. Last Thursday saw a positive jobless claims number in the morning, followed by a very strong release of PMIs out of the US. The US Dollar ran higher, Treasury rates jumped, and equities pulled back somewhat aggressively intra-day, and that was in the immediate wake of the NVDA earnings report that had propelled Nasdaq futures up to a test of the 19k level. This puts focus on the Core PCE release set for later this week, which has been a positive factor so far this year for the drive towards FOMC rate cuts.
- I’ll be discussing these themes in-depth in the weekly webinar. It’s free for all to register: Click here to register.
The 10-year Treasury is seeing yields jump back-above 4.5%, and that was the item that I led with in this webinar, sharing a bit about its correlation with equities of late. Yields snapped back aggressively after the FOMC rate decision on May 1st and caught another shot-in-the-arm on the 15th of the month after the release of CPI.
But that’s when the 4.35% level came into play and that’s been a big spot for 10-year yields going back to 2022 trade. With the 10-year jumping back above 4.5% as equities have shown symptom of stall, the natural next question is whether we’re nearing another pullback in stocks.
US 10-Year Treasury Yields – Daily Chart
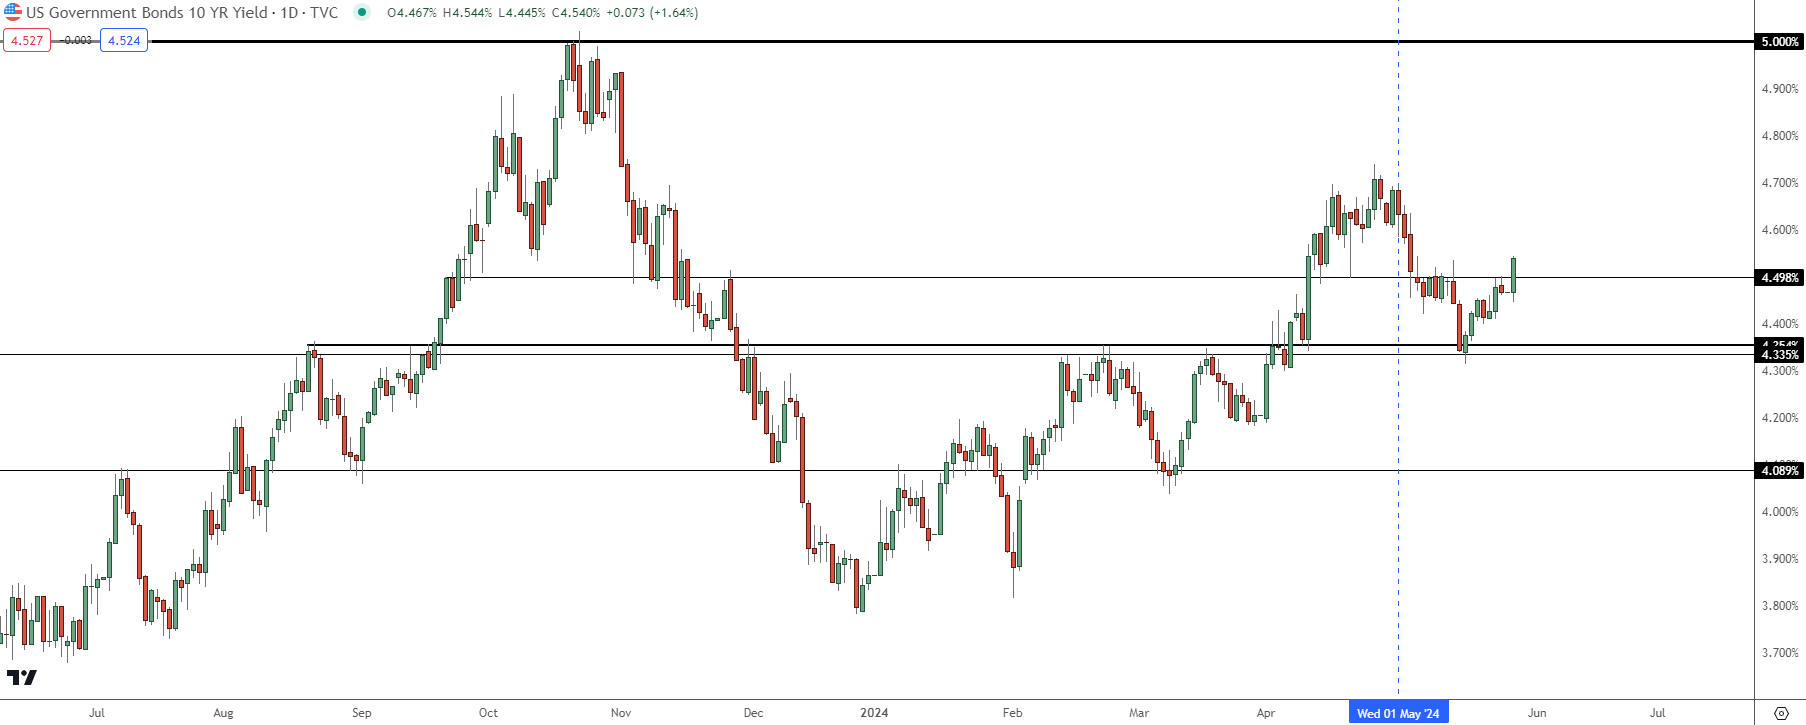 Chart prepared by James Stanley; data derived from Tradingview
Stocks
Coming into Q2 I was talking about the prospect of a pullback. There were a couple of items that I had noted but one of the more glaring was divergence between Nasdaq and S&P 500 Futures. While S&P 500 Futures set a fresh all-time-high on the first day of Q2 trade, the Nasdaq was holding below previously-establish resistance which had set up a double top formation.
With the tech-heavy Nasdaq leading the way for much of the bull run, the fact that it was looking less strong and possibly even weak, highlighted a glaring divergence among the indices. A couple of weeks into Q2, we got a strong CPI print on April 10th and that’s when equity bears started to stretch a bit.
The double top completed in Nasdaq futures right around the time that daily RSI went oversold; and S&P 500 futures held a test of 5k support after which bulls returned with aggression.
At this point, the S&P 500 is stalled in the same approximate area that had previously-held the highs at the Q2 open. This is around the 161.8% extension of the October 2022- July 2023 major move.
S&P 500 Futures Daily Chart
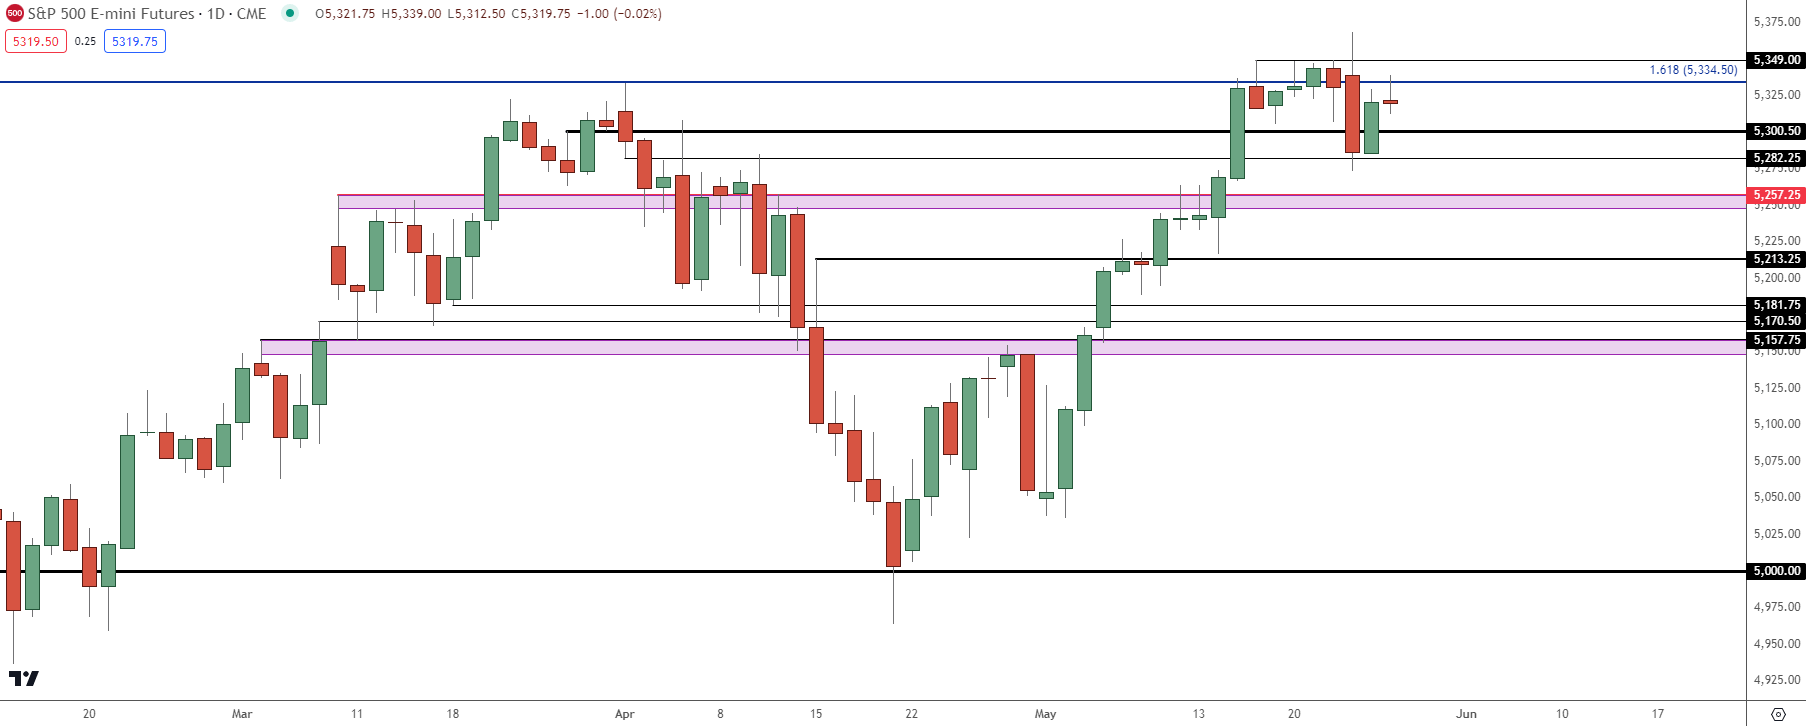 Chart prepared by James Stanley; data derived from Tradingview
Nasdaq 100 Futures
While the S&P 500 dithers near resistance, the Nasdaq has continued to show strength, setting a series of fresh ATHs last week and price making a fast push back towards the prior high.
That prior high in NQ showed right around the 19k psychological level, which came into play around the release of jobless claims last week. The strong PMI release helped to prod bears with a 400-point move, with bulls making a fast return after.
But the notable item here is that while ES has shown symptom of stall above, NQ bears have continued to push, which highlights the potential for further higher-highs as the tech-heavy Nasdaq has continued to see support from buyers.
Nasdaq 100 Futures – Daily Chart
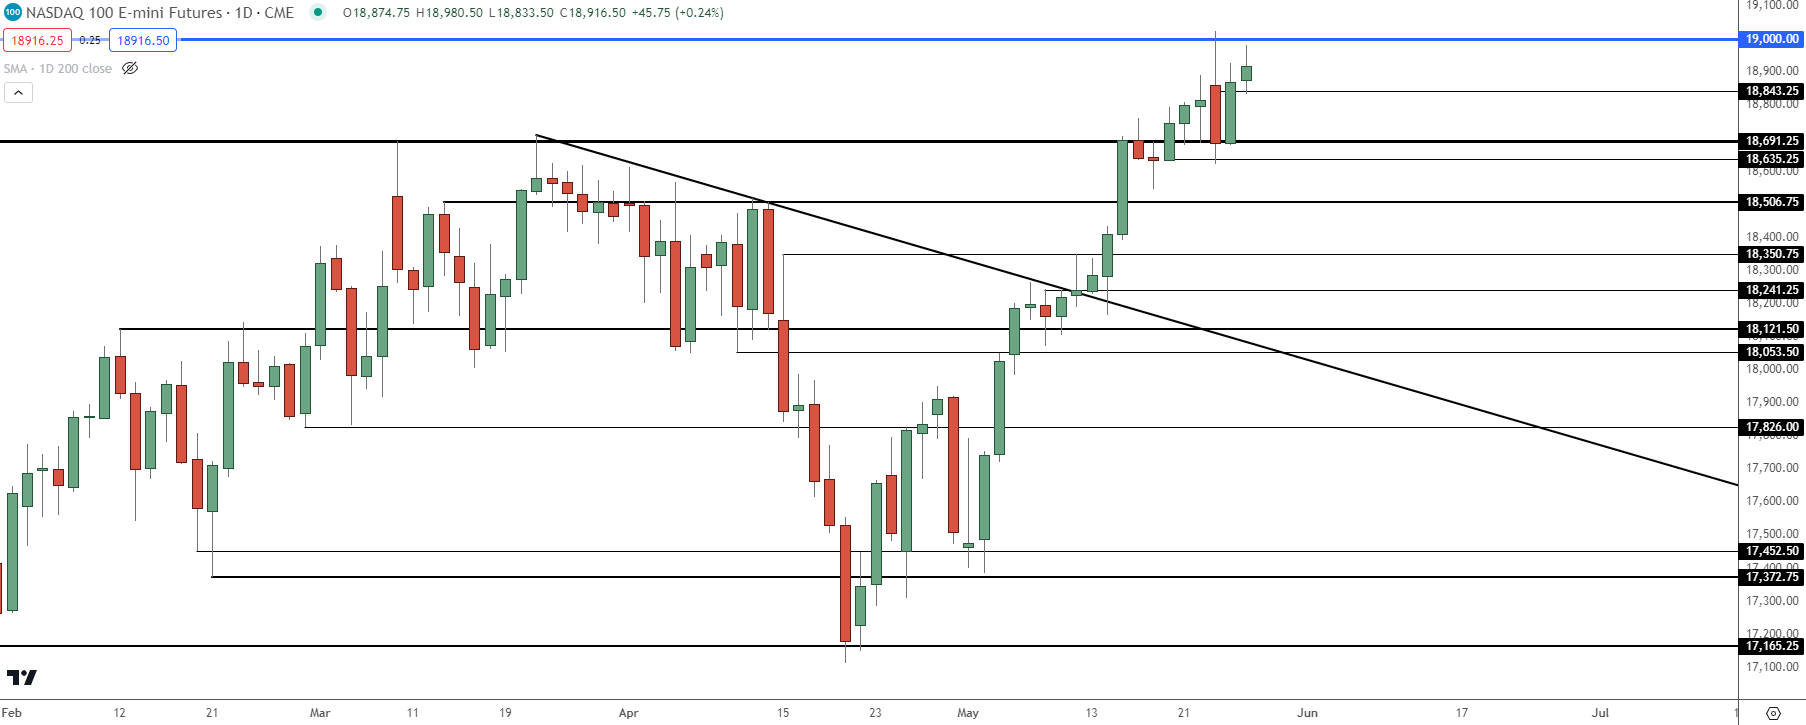 Chart prepared by James Stanley; data derived from Tradingview
Gold
Gold just had its worst week since early-December, and for Gold futures, it was the worst week in six months. Last week did not start that way, however, as spot Gold had hit 2450 just after last week’s open, after which bears made a statement. Taking a step back to the weekly, however, highlights remaining bullish structure which puts focus on the 2300 level.
In the bearish camp, there’s been a building case of RSI divergence as observed from the higher-high on price last week but the lower-high in RSI from the weekly chart.
Spot Gold (XAU/USD) Weekly Price Chart
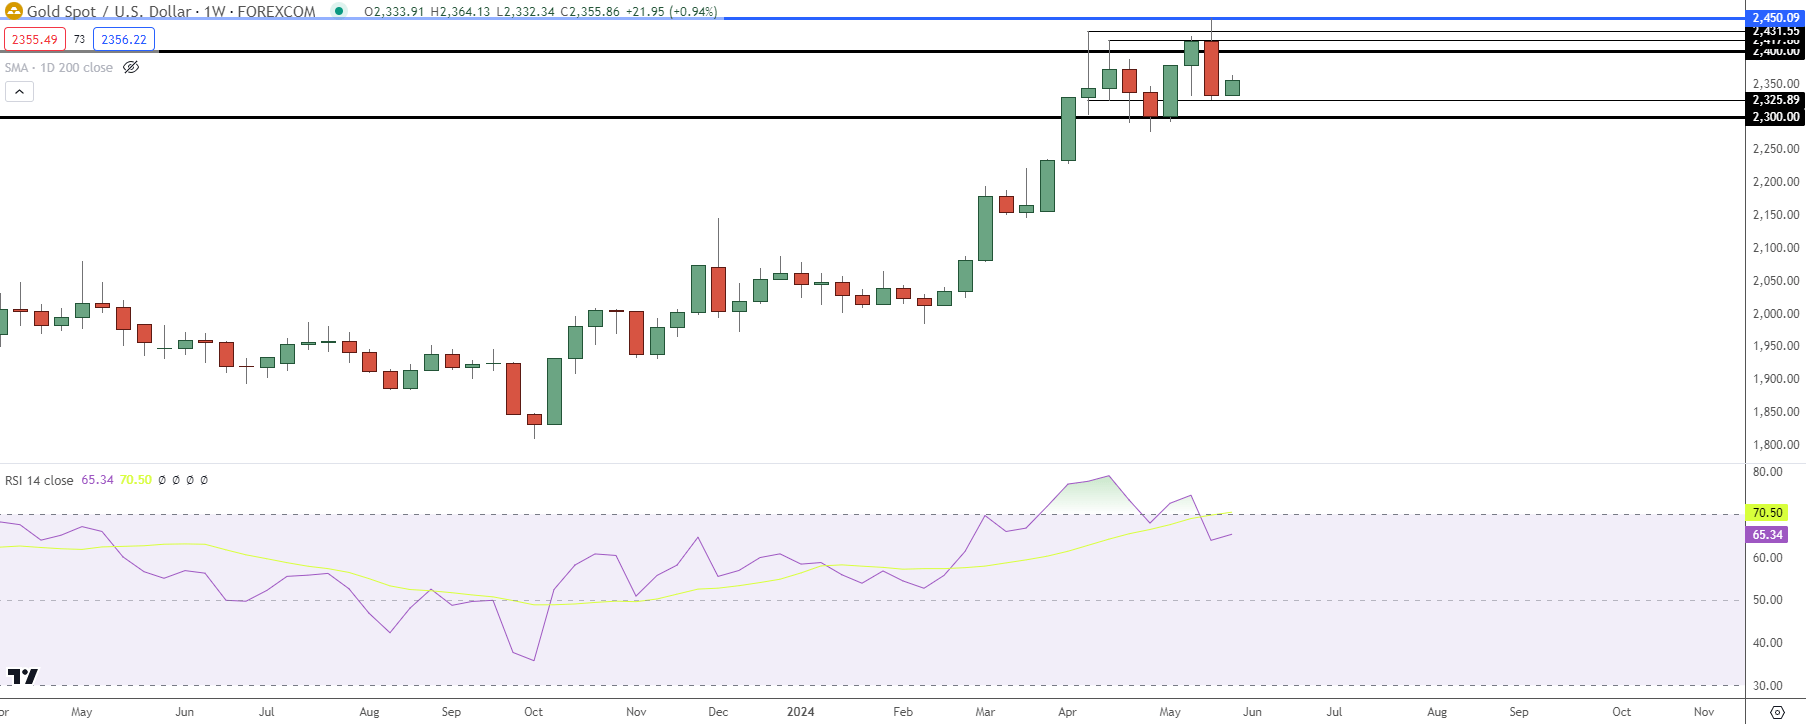 Chart prepared by James Stanley, Gold on Tradingview
Gold Shorter-Term
On a shorter-term basis, bulls have been pushing a bounce since a re-test of 2319-2326 last week. That was resistance before Gold broke out of the falling wedge formation and it came back into play last Thursday. Since then, bulls have been pushing higher-highs and lows with a current resistance test at a major spot of 2354, which is the 50% mark of the April-May pullback move.
There’s another key zone a little higher, from around 2372-2378.
Gold (XAU/USD) Four-Hour Price Chart
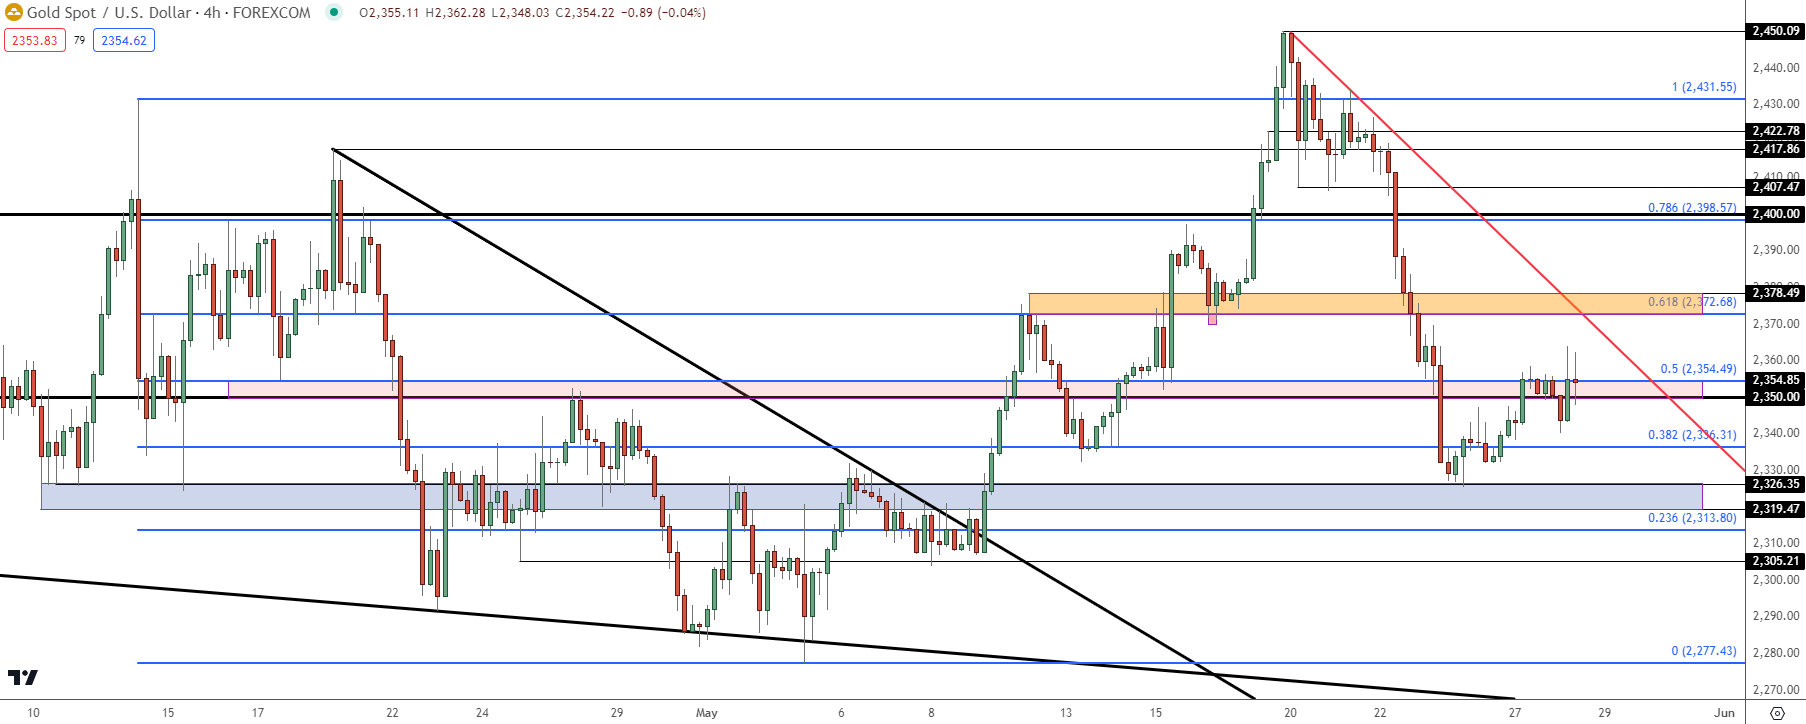 Chart prepared by James Stanley, Gold on Tradingview
US Dollar – 200 DMA Test
The US Dollar has continued the pullback and linking to last week’s session, the same spot of prior support has held lower-high resistance.
The big question now is whether sellers can stretch down to a lower-low and as of this writing, they’re caught at the 200-day moving average.
Another item of note goes back to something I had talked about last month, and that’s the fact that the prior higher-low before the 106.50 test plots at 103.92. Bulls holding lows above that level could keep alive the 2024 bullish trend in the USD.
US Dollar (DXY) Daily Price Chart
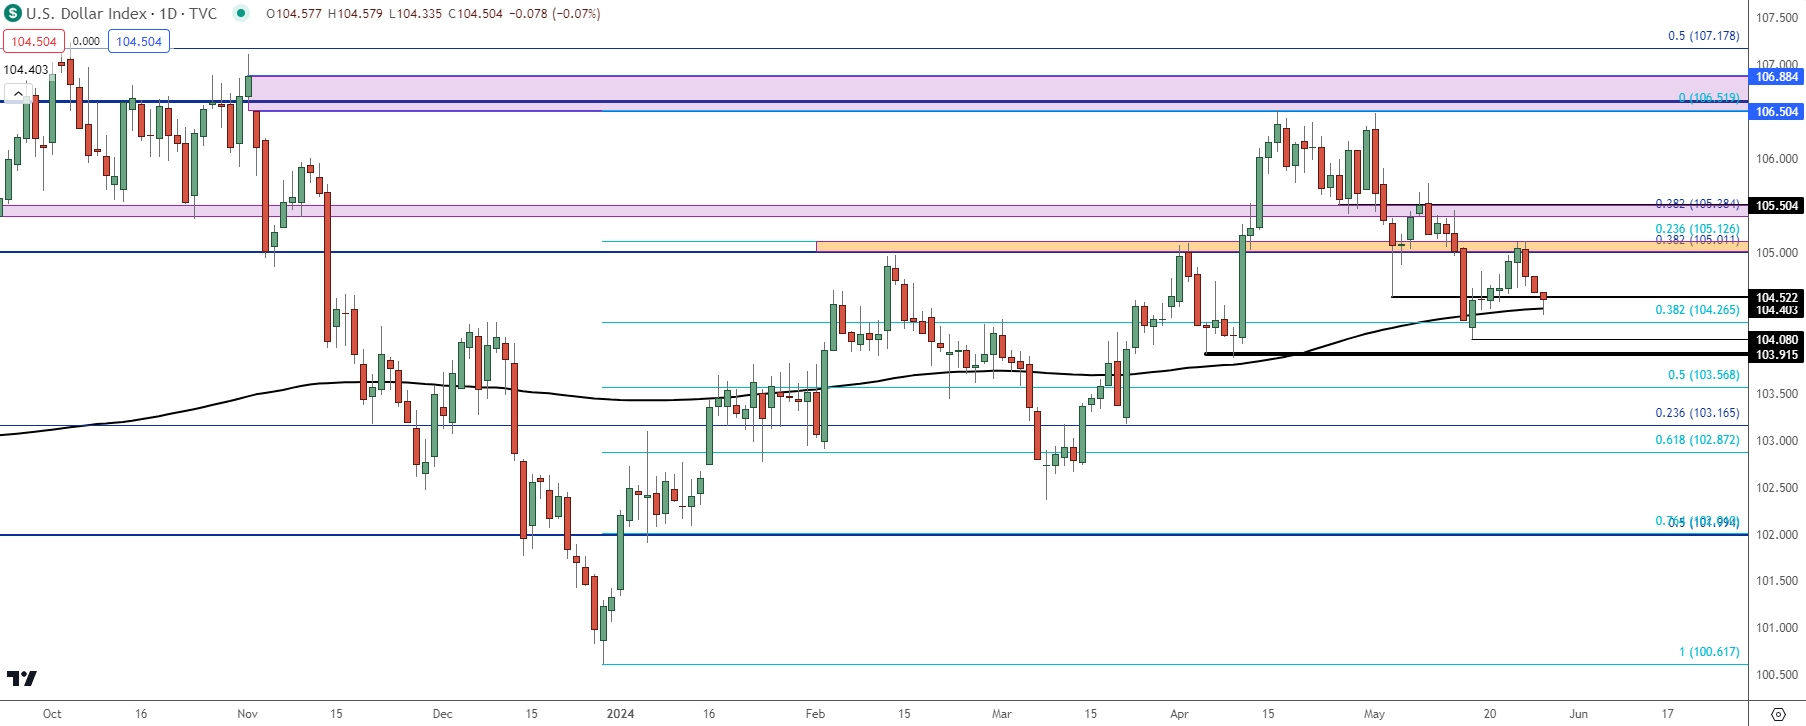 Chart prepared by James Stanley; data derived from Tradingview
EUR/USD
The Euro is 57.6% of the DXY quote, and the ECB is widely-expected to kick off rate cuts next month. But the European Central Bank no longer offers guidance on rates so markets are uncertain of what to expect after that. Thus, that uncertainty may be helping EUR/USD to hold with a bit more strength than it would otherwise.
When I looked at the pair last week it had started to build a bull flag formation. That’s since been broken through and bulls are caught at the same spot of resistance that helped to hold the advance after the CPI report in mid-May, plotted from around 1.0870-1.0877.
The bigger question is whether bulls can press above the resistance that was in-play in March at 1.0943, or the 1.1000 level that looms just above that.
EUR/USD Four-Hour Price Chart
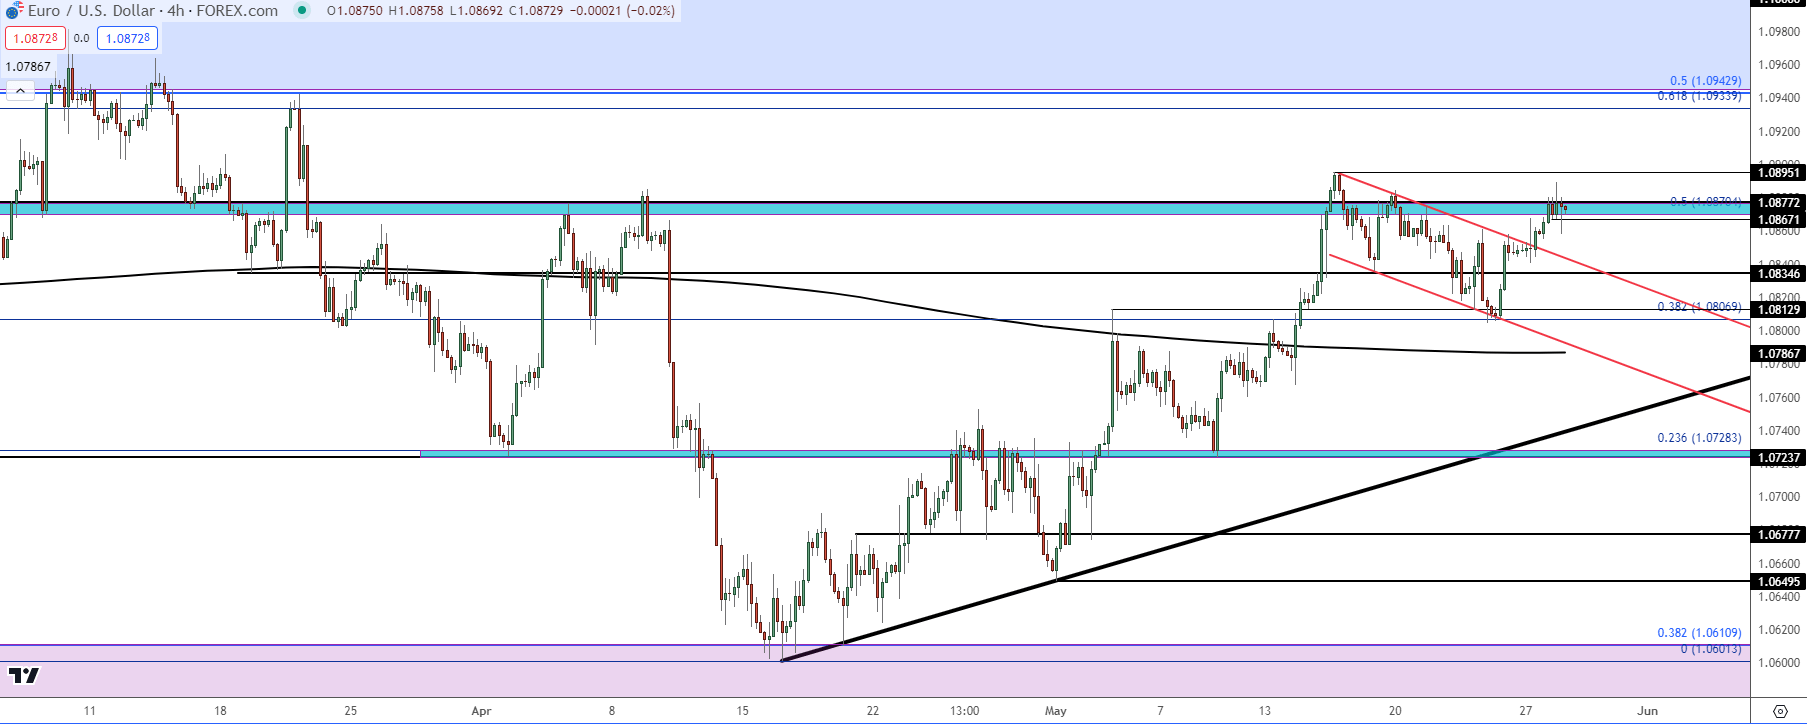 Chart prepared by James Stanley, EUR/USD on Tradingview
GBP/USD
Cable remains as one of my more attractive scenarios for USD-weakness. The pair surged on the back of the US CPI print a couple of weeks ago and then caught another bullish run last week on the back of UK CPI, which showed Core CPI as still-elevated. This brings to question rate cut potential around the UK and if we do see USD-weakness, the door is open for further gains.
From the chart, GBP/USD has just re-engaged with a level of resistance that last led into a decisive bearish move, plotted at 1.2801. Prior resistance of 1.2750 and 1.2710 and 1.2692 become support potential.
GBP/USD Daily Price Chart
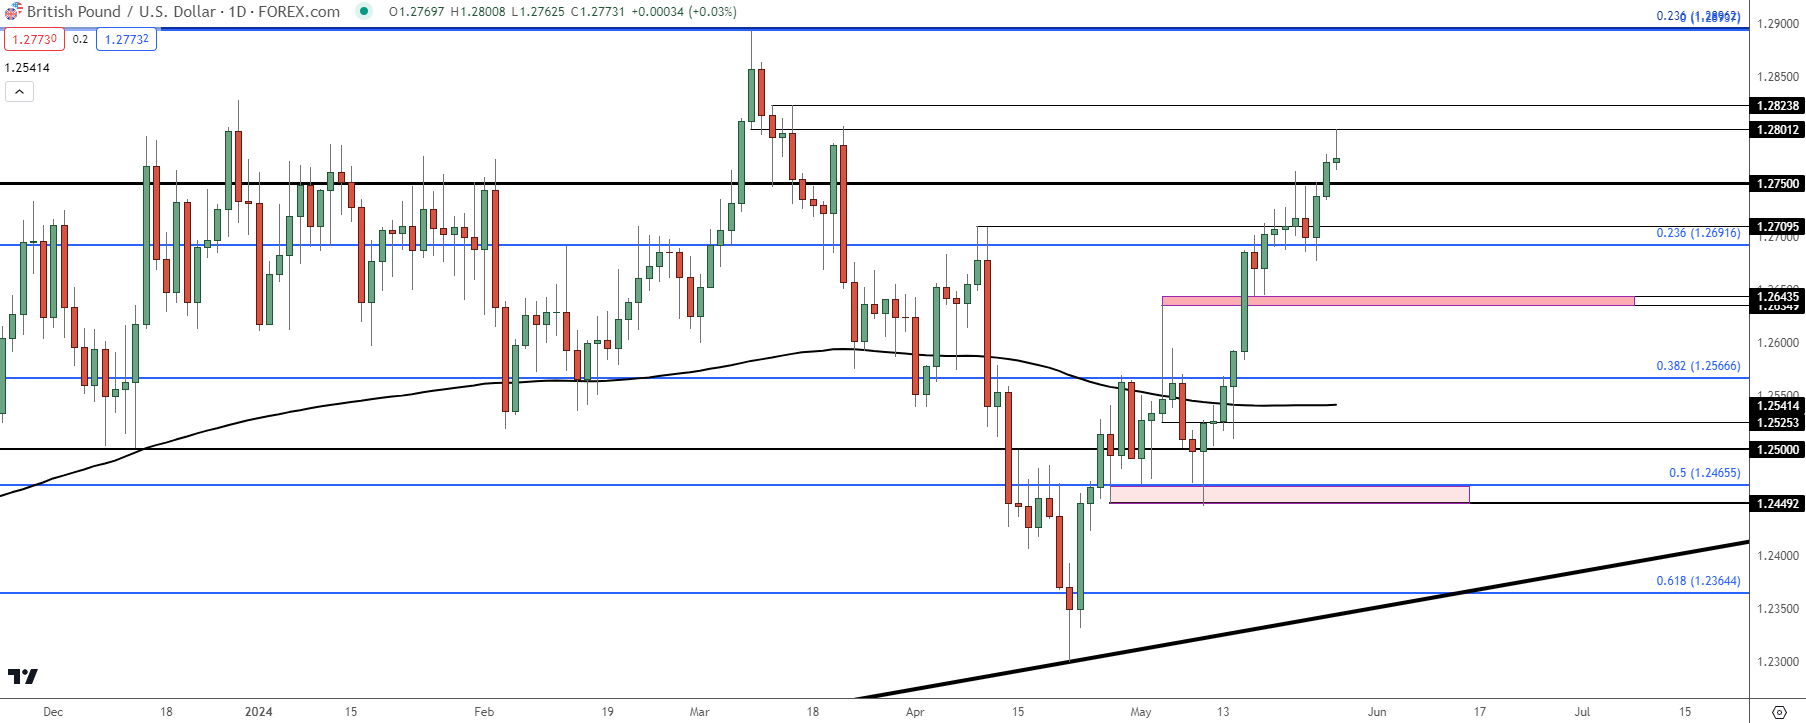 Chart prepared by James Stanley, GBP/USD on Tradingview
USD/CAD
While GBP/USD looks attractive for scenarios of USD-weakness, I think USD/CAD is attractive for scenarios of USD-strength. Like GBP/USD above, fundamentals are a factor. While the Bank of England seems further away from rate cuts than the Fed, the Bank of Canada appears to be closer than the FOMC. And from the chart, while that USD-weakness is well reflected in the GBP/USD breakout, it’s been a bit trickier in USD/CAD, which is continuing to grind support very near the lows from the past couple of weeks.
There’s also a case for higher-lows here as price had penetrated 1.3600 two weeks ago and then held 1.3600 on another test last Monday. And so far this Monday, the possibility of another higher-low as taken from support at prior resistance, plotted at 1.3614.
USD/CAD Daily Price Chart
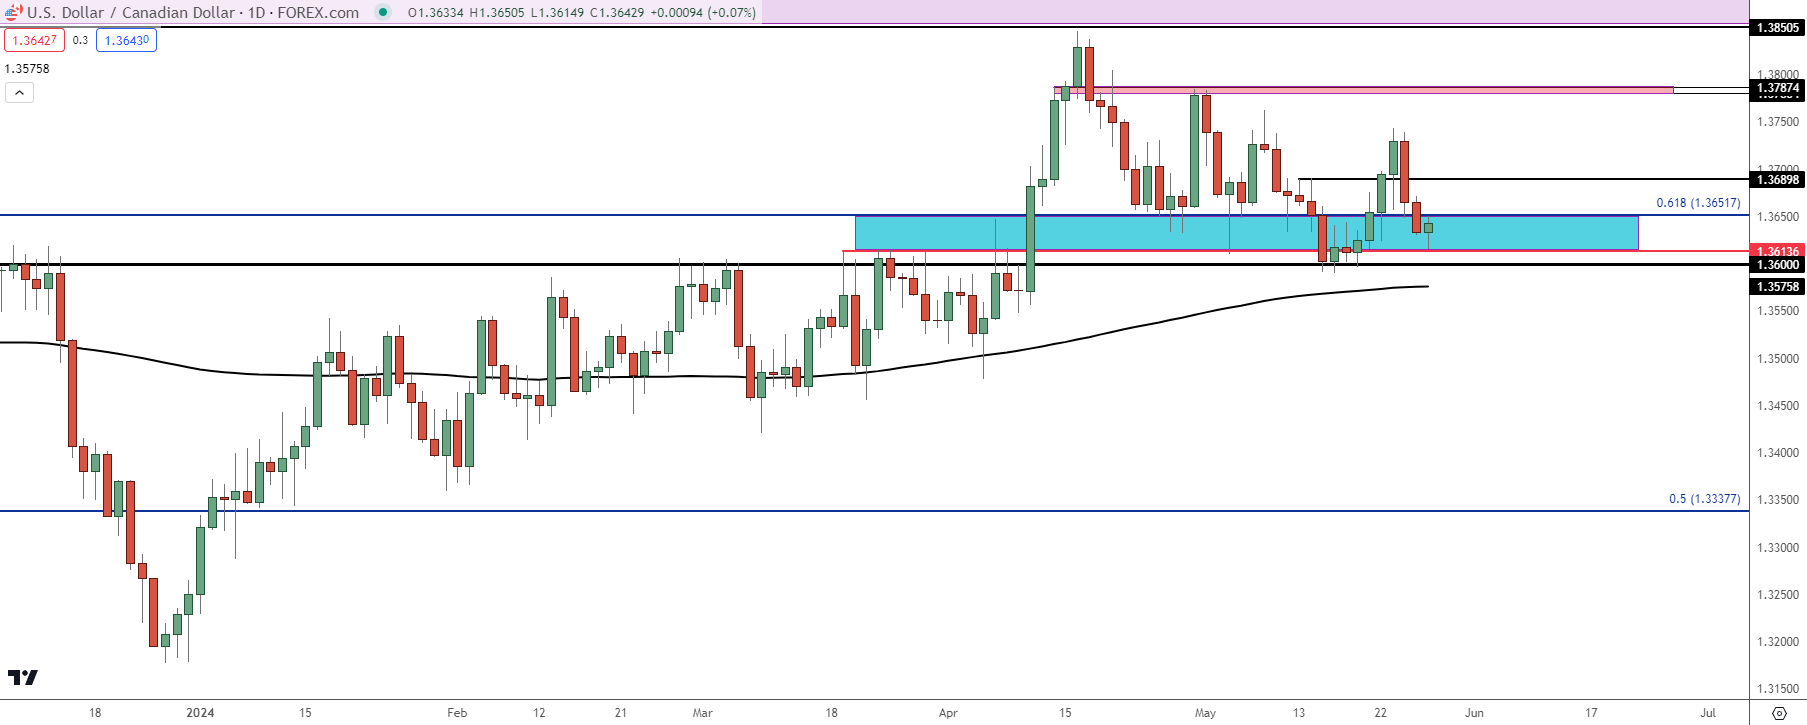 Chart prepared by James Stanley, USD/CAD on Tradingview
USD/JPY
USD/JPY has held up really well over the past few days even with USD-weakness showing elsewhere. I do still think this will continue to trade like an amplified USD, but from evidence, that clearly hasn’t been the case on the downside over the past few days.
My opinion on that is that while there’s been USD-weakness, there also hasn’t been a huge expansion of expectation for rate cuts. Falling CPI in November each of the past two years were the major factor driving USD/JPY reversal themes.
USD/JPY did catch a bearish jolt around the CPI report released a couple of weeks ago, but that merely led to a higher-low as bulls loaded the boat and drove the pair-higher.
If we do see a soft Core PCE reading in the Friday release, that could trigger similar fears as Q4 of the past two years, and that could compel carry trades to close. But, if USD strength does stick around to a degree, that continued positive rollover on the long side and continued negative rollover on the short side could continue to take their toll.
USD/JPY Daily Price Chart
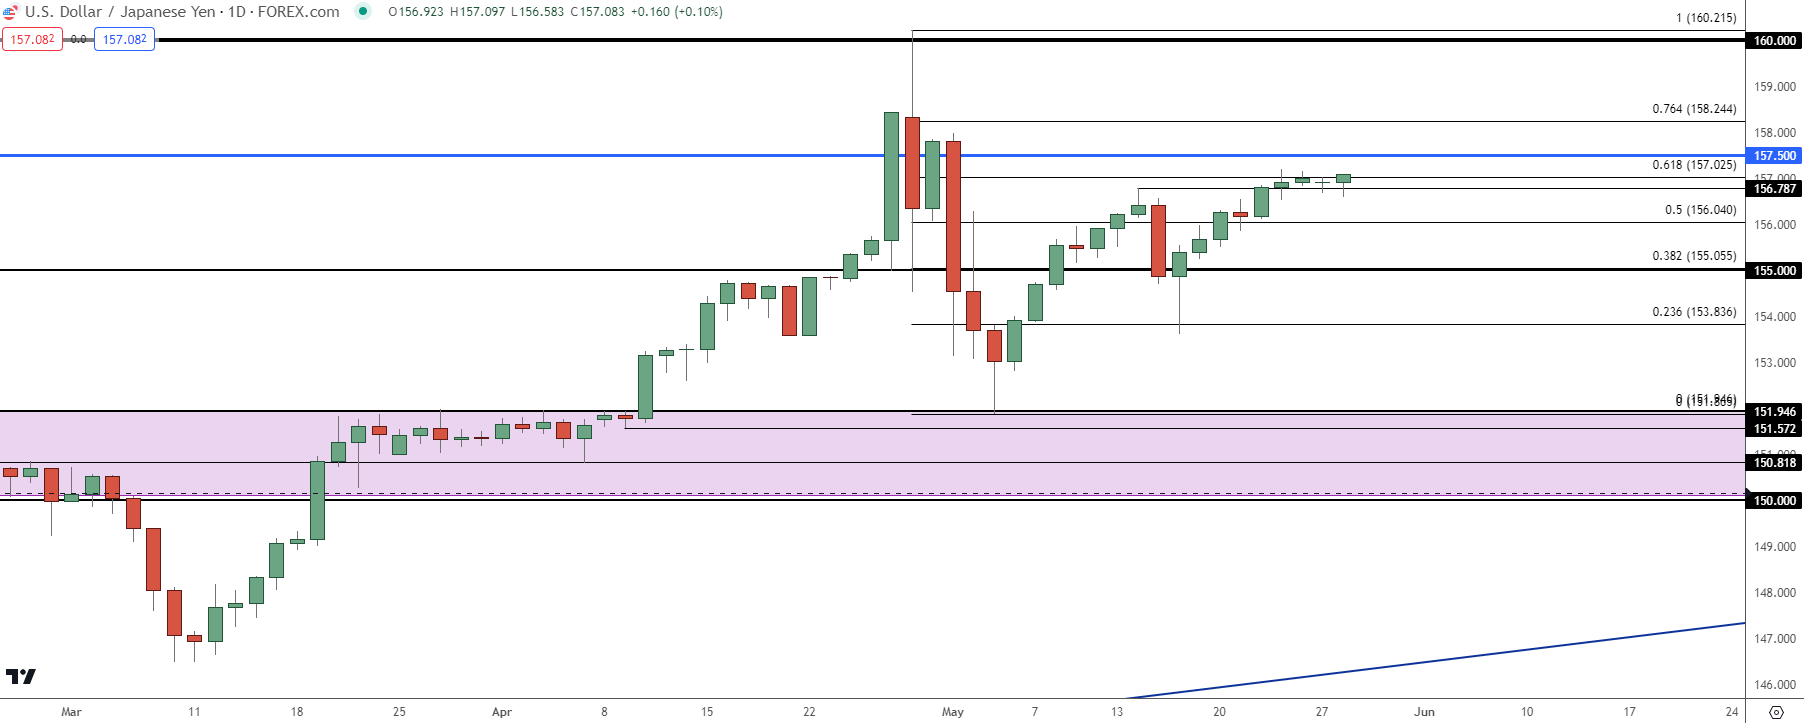 Chart prepared by James Stanley, USD/JPY on Tradingview
--- written by James Stanley, Senior Strategist


