
U.S. Dollar Talking Points:
- The U.S. Dollar sold off aggressively last Wednesday around the FOMC rate decision, but strength soon returned after a test of the 103.19 Fibonacci level, and buyers have been clawing back since Thursday morning.
- This Friday is a high-risk environment: The most recent Core PCE data point is set for release and this has been a big sticking point for the Fed. As we’ve been following, Core CPI has been very sticky around 4% and this complicates the Fed’s rate cut plans. But Core PCE has been showing more progress and given that that’s often considered to be the Fed’s ‘preferred inflation gauge,’ it seems that they’re molding expectations for policy around that data point as opposed to Core CPI. Making matters more interesting is that this Friday is a holiday in the U.S. in observance of Good Friday, which could make for an especially volatile backdrop round USD-pairs.
- This is an archived webinar and you’re welcome to join the next one. It’s free for all to register: Click here to register.
The Fed echoed their recent dovish tone at last Wednesday’s rate decision and while that prodded a quick run of USD-weakness, it didn’t last, as USD bulls returned after a re-test of the 103.19 Fibonacci level and then went to work. This led to a fast move of strength on Thursday and Friday of last week, with DXY crossing back-above it’s 200-day moving average. And, so far this week, that strength has held, as looked at in the webinar.
This continues the theme that I’ve been talking about this year where the ‘natural flow’ of the US Dollar has seemed higher; while the Fed has remained very dovish which has served to tamp down on that strength. The FOMC rate decision last week was another iteration of that theme.
As we heard from Chair Powell last week, the Fed is considering the early-year inflation data as an outlier. And as I’ve talked about on these webinars of late, there’s multiple ways of looking at inflation in the U.S. Perhaps the more popular is the CPI data that’s often discussed on the news. But, for the Fed, their ‘preferred inflation gauge’ is Core PCE. And while the two data points speak to a similar problem, they have a different underlying computation and, at times, can diverge.
That’s what we’ve seen over the past few months: Core CPI has become sticky around the 4% level. But Core PCE has continued to fall, and this puts attention on this Friday’s release when we get the most recent data point for that series. The expectation is for Core PCE to hold at 2.8% which, if so, would be the first month that it has not gone down since August of last year.
Below, I’m looking at each of those data points, with CPI in blue and as you can see, that’s been flattening quite a bit more than the Core PCE represented in orange. Making matters even more interesting is the fact that this release is set to take place on a holiday, as this Friday is Good Friday in the United States and this can lead to a low-liquidity backdrop as that data print hits headlines.
U.S. Core CPI (blue) v/s Core PCE (orange)
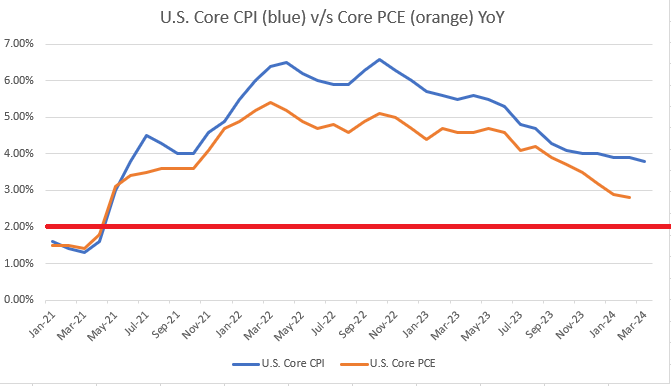
Image prepared by James Stanley
As I had looked at ahead of last week’s rate decision, the big item of focus was the Fed’s projections. The major question was whether they would pare back their expectation for cuts this year to two from three. That did not happen and as of this writing, markets are expecting three cuts by the end of 2024.
But there are now only six rate decisions left for this year and cutting three times in six meetings would be a fast pace, particularly if data holds up as well as it has. So, any data items that we get that continue to show strength could bring on a bullish reaction in the U.S. Dollar as rate cuts get priced-out, to a degree.
Rate Probabilities for FOMC by End of 2024
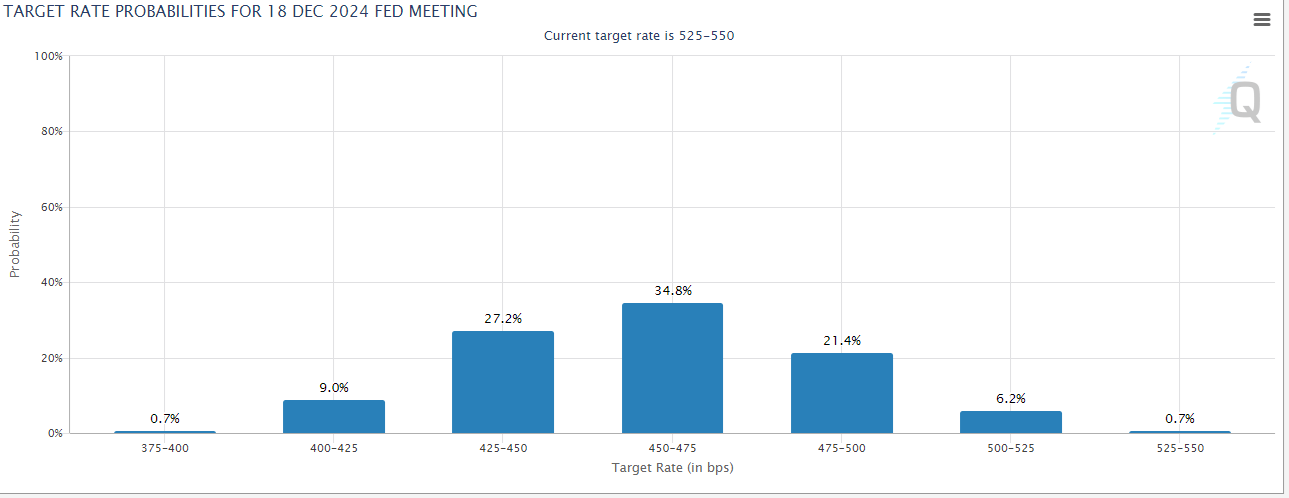 Image prepared by James Stanley; data from CME Fedwatch
U.S. Dollar
At this point the U.S. Dollar remains above the 200-day moving average and as I had noted in the webinar, EUR/USD was also above its 200-dma at the time and it was unlikely that this would last for long. But that becomes a key point of potential support for DXY and overhead remains the same resistance that stifled bulls in February, right around the time the Austan Goolsbee comment came in dismissing the CPI print from the day before.
That zone runs from 104.78 up to the 105.00 handle, with each of those levels derived from both prior price action and Fibonacci levels.
U.S. Dollar Daily Price Chart
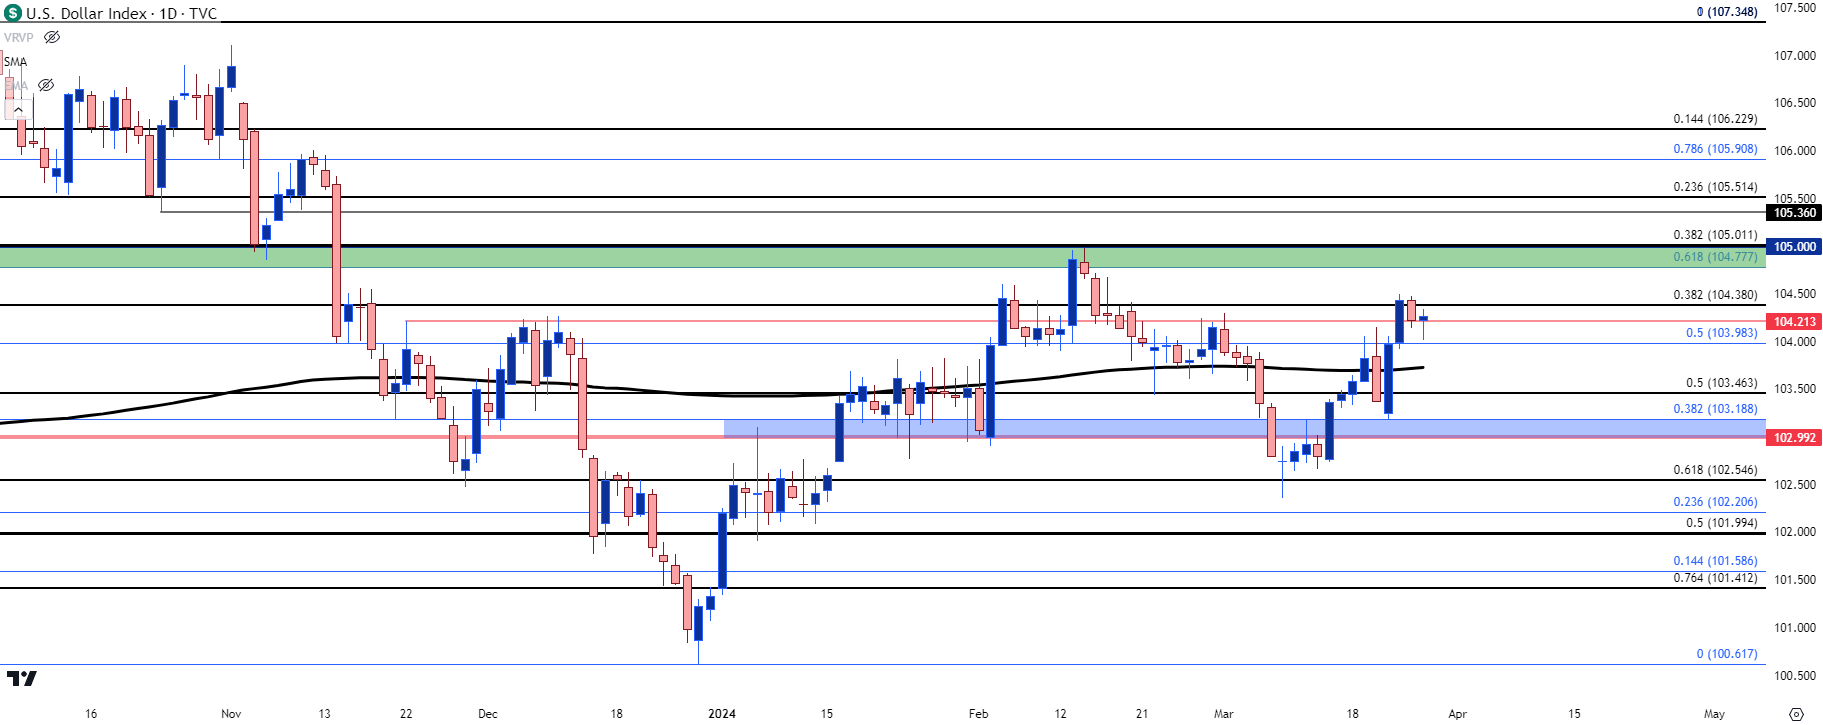 Chart prepared by James Stanley; data derived from Tradingview
EUR/USD
At the start of the webinar, EUR/USD was holding above the 200-dma and there was even a possible higher-low support show there. But, as I shared, it was unlikely that both USD and EUR/USD would remain above their 200-day moving averages for very long, especially considering the fact that the USD is represented as the counter-currency in the EUR/USD quote.
Last week saw resistance hold right at 1.0943, which is a 50% marker from the 2021-2022 major move and sellers have been stepping in since then.
It’s important to note – on a longer-term basis this remains in a range, and that’s a relevant fact when setting expectations and targets. But the other side of that is some considerable prior structure that can be used for setups.
Below the 200-dma, there’s a spot of prior support around the 1.0790-1.0795 area, and below that another from 1.0750-1.0765. If bears can test through there, then we have the 2024 low that plots at prior swing high around 1.0695 and, longer-term, there’s a zone running from 1.0611-1.0638 that remains of interest.
For resistance: 1.0862 has so far held the highs today and above that are areas of interest at 1.0886-1.0900 and then the 1.0943-1.0960 zone.
EUR/USD Daily Price Chart
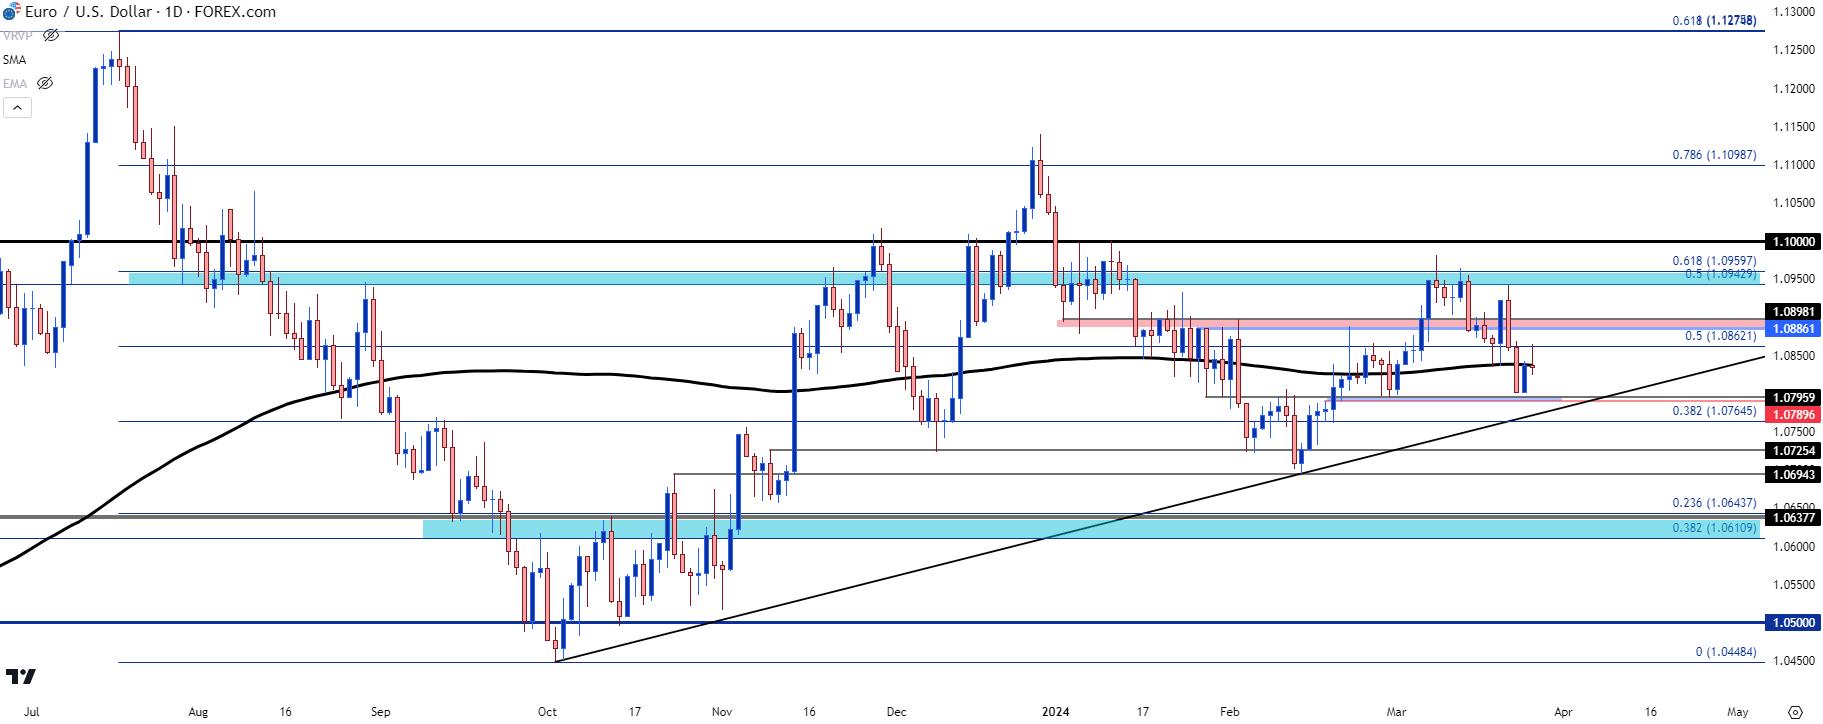 Chart prepared by James Stanley, EUR/USD on Tradingview
USD/JPY
I had published a couple of articles recently on this topic and the question that I’m asking is whether the Finance Ministry is going to continue to defend the 152.00 level or whether they’re going to take a step back. The logic being that the BoJ has hiked rates and there’s change starting to show on the monetary policy front, so perhaps there could be a more sustainable way to handle the problem in the not-too-distant future, especially with the potential for the U.S. to be moving into a cutting cycle later this year.
But, from the chart, there’s a bullish backdrop here as shown by an ascending triangle formation. Horizontal resistance shows right around that 152.00 level that the BoJ has defended in the past. There’s probably a host of stops sitting above that resistance, and I used an example on gold for how a touch of a fresh high around a contentious level could lead to a fast breakout type of scenario as those stops (on shorts) get triggered and push more demand into the market. And given the breakout to fresh multi-year-highs, it might not seem the most amenable spot for bears to step in. That low liquidity can lead to an even sharper move higher as buy orders aren’t offset by sell orders, and this is somewhat of the story of the 145 level in USD/JPY back in 2022.
The Finance Ministry simply waited and intervened after a breach of the 150.00 level shortly after. If USD strength does persist, then they will likely need to act again to keep bulls from forcing the breakout.
On the other side of the argument – if the Core PCE report comes out very soft on Friday, alluding to a continued fall in inflation with that data point, then USD/JPY could fast become one of the more interesting bearish USD-setups as that was a major factor to pullback/reversal scenarios in each of the past two Q4s.
USD/JPY Weekly Price Chart
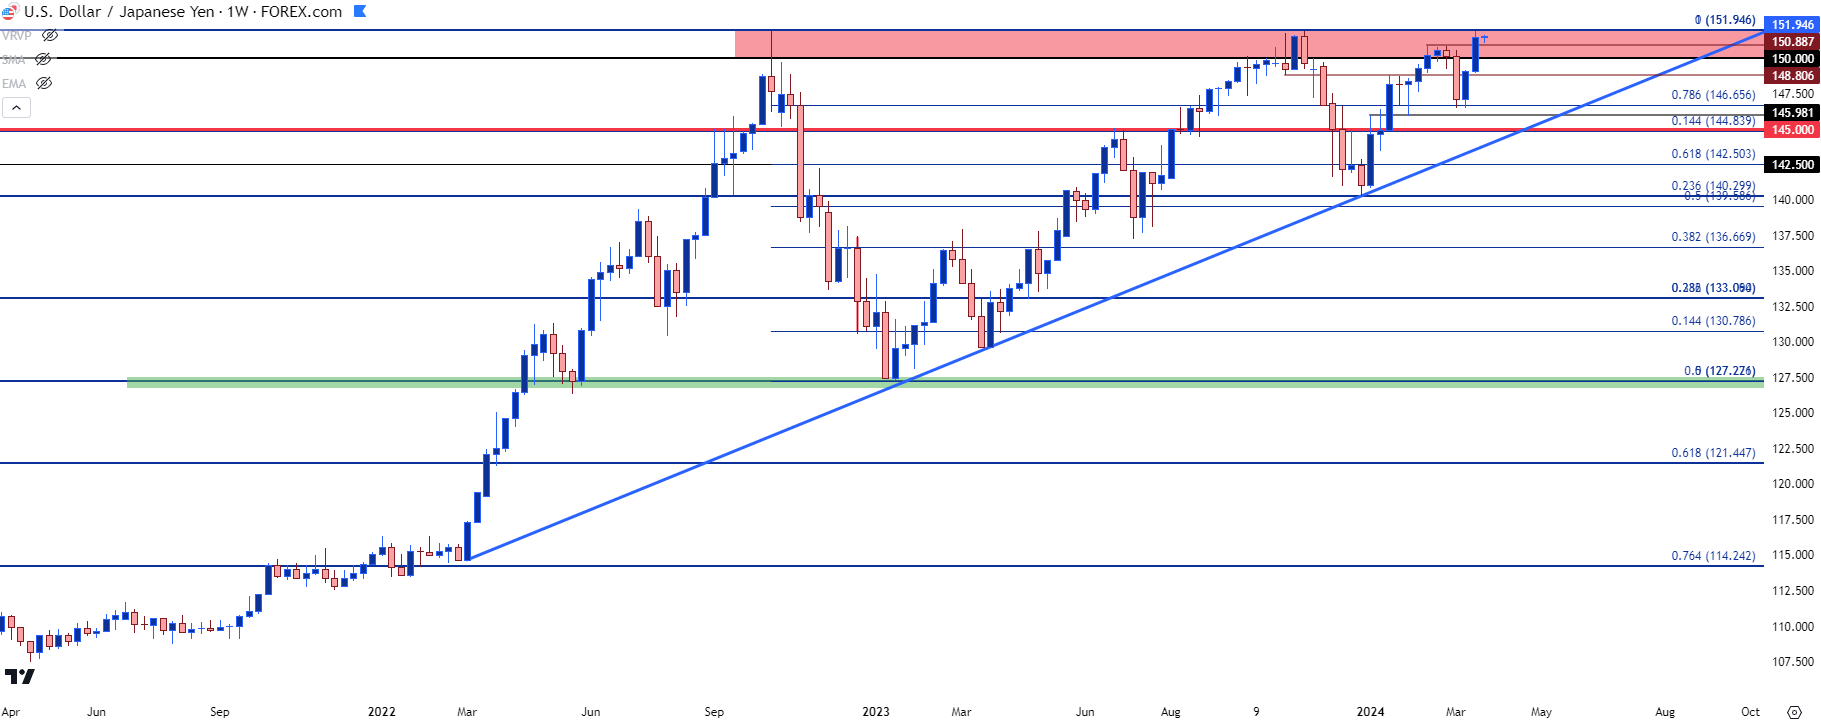 Chart prepared by James Stanley, USD/JPY on Tradingview
XAU/USD (Gold)
Last week ahead of the FOMC, gold had built a descending triangle formation with support taken from the December swing high. In the webinar, I talked about that December breakout setup and the fact that it showed just after the Sunday open highlights how forceful a move can price in with a low liquidity backdrop.
But as the Fed sounded dovish, gold bears were crushed and another bullish breakout appeared with spot gold putting in its first ever test of the $2,200 level. Bulls have been unable to drive beyond that price, however, the levels that I looked at last Thursday remain in-play, with the $2,172 spot currently confluent with a bullish trendline as it tests the lows.
XAU/USD Gold Four-Hour Price Chart
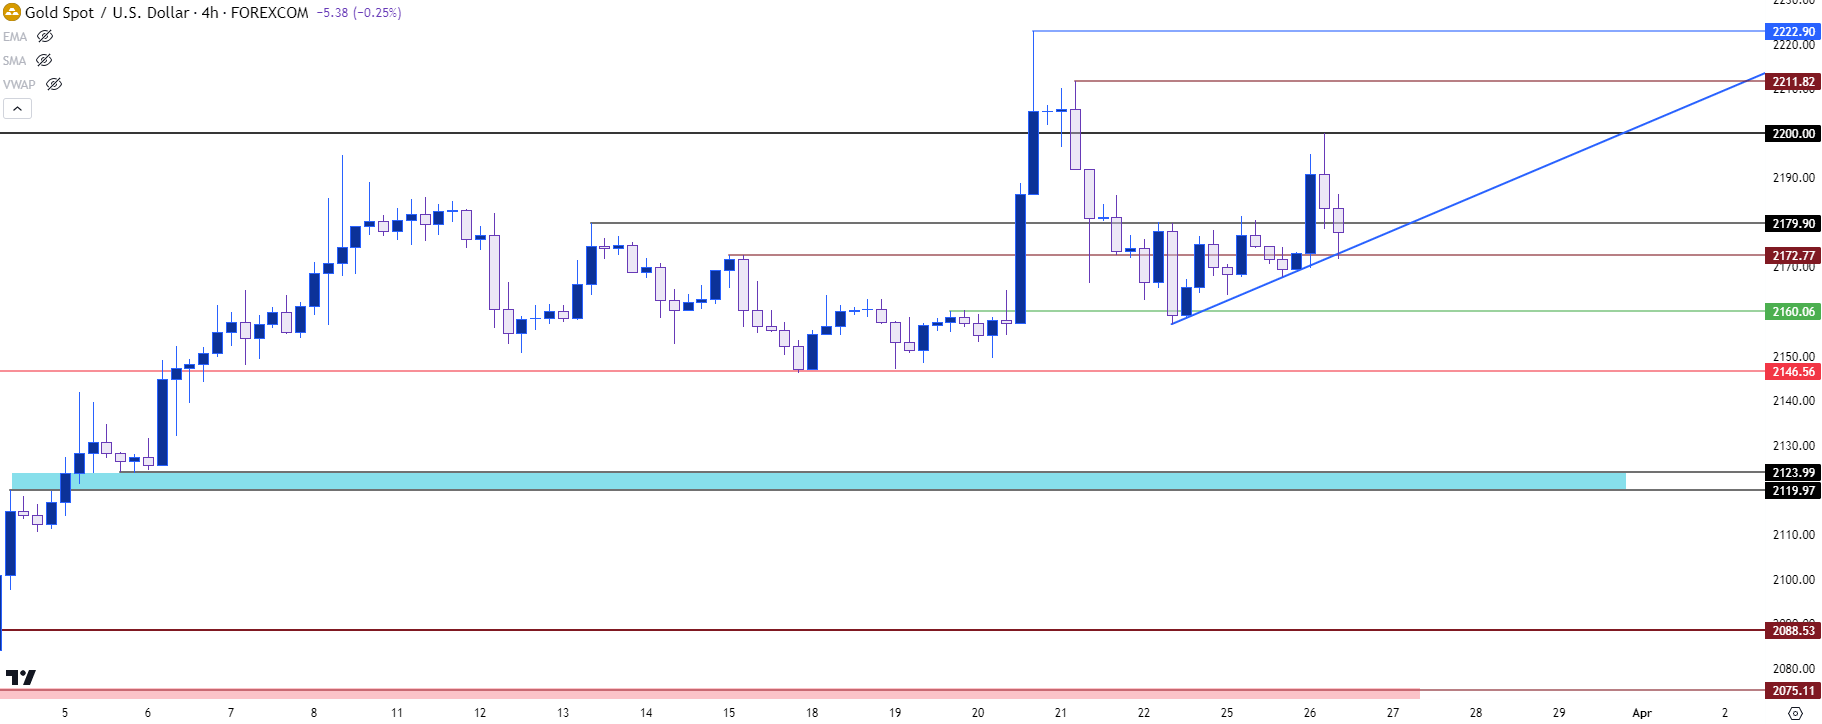 Chart prepared by James Stanley, Gold on Tradingview
Notably, the prior swing high was a lower-high and it held right at $2,200, which indicates that there may be more profit taking for longs and this puts focus right back on that $2,146 level that had held the lows going into FOMC. If bears can push below that, there’s additional support potential around $2,120-$2,124 and then that prior zone of range resistance around $2,075-$2,082. Interestingly that prior resistance that held for three and a half years hasn’t yet been tested for support since the breakout earlier this month.
Gold Daily Price Chart
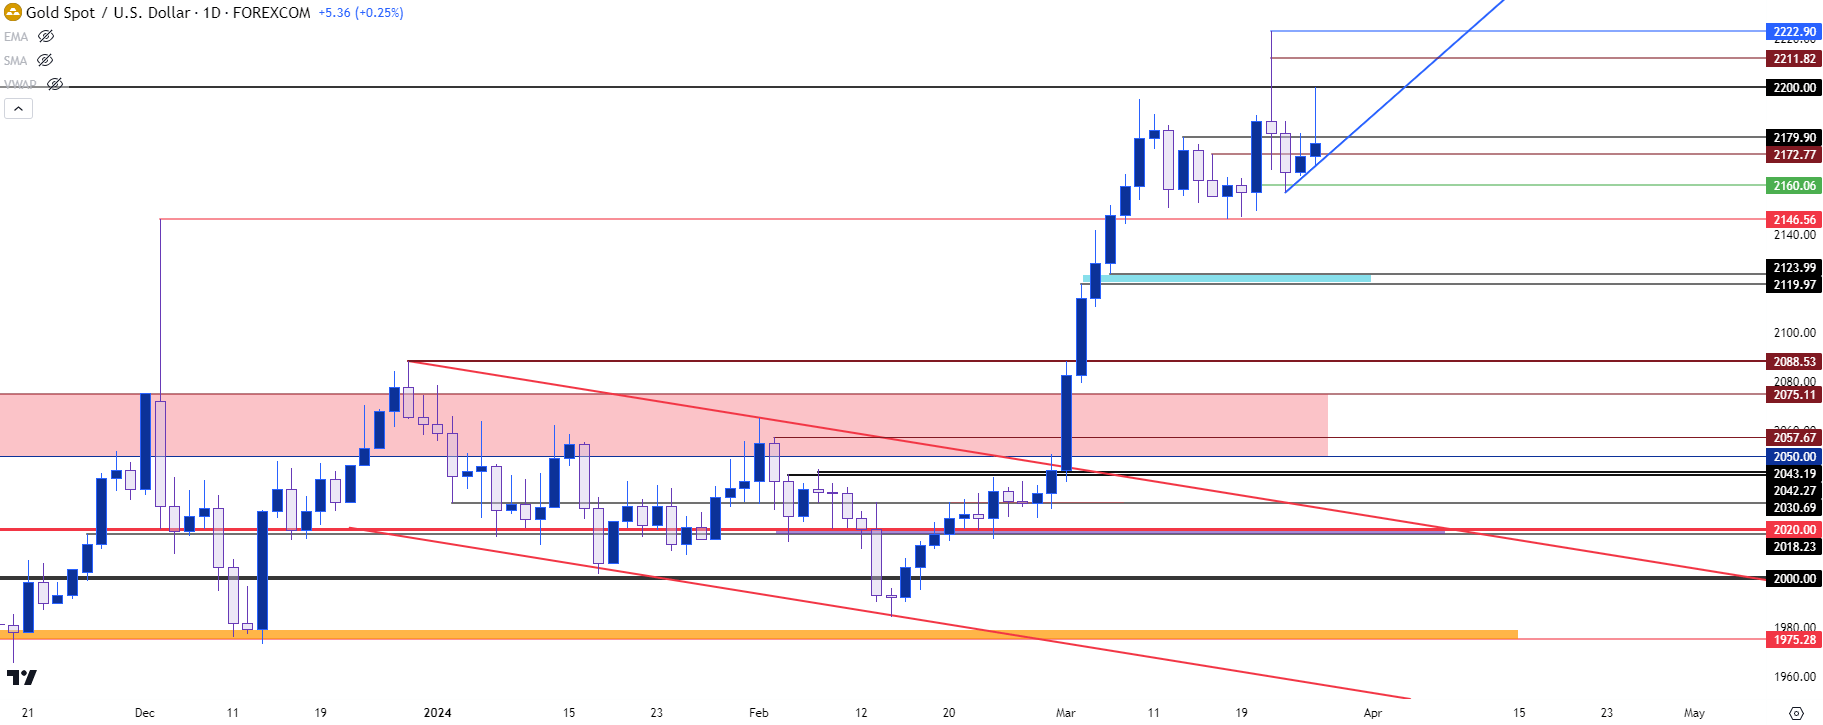 Chart prepared by James Stanley, Gold on Tradingview
USD/CHF
While the Fed talks up possible cuts even with data remaining strong from a number of fronts, the ECB and BoE are both in a similar dovish posture. But neither seem ready to cut just yet. Meanwhile, the Swiss National Bank made that move last week and I had looked into the USD/CHF pair in last week’s webinar. At the time, there was a 200-dma support test to go along with a bull flag formation.
That led into a strong bullish breakout after the SNB cut rates last week and this may actually retain USD/CHF as one of the more interesting bullish-USD setups. At this point, the pair has pushed quickly through the .9000 psychological level and that becomes a spot of interest for higher-low support, with .8970 and then .8920-.8924 below that.
USD/CHF Daily Price Chart
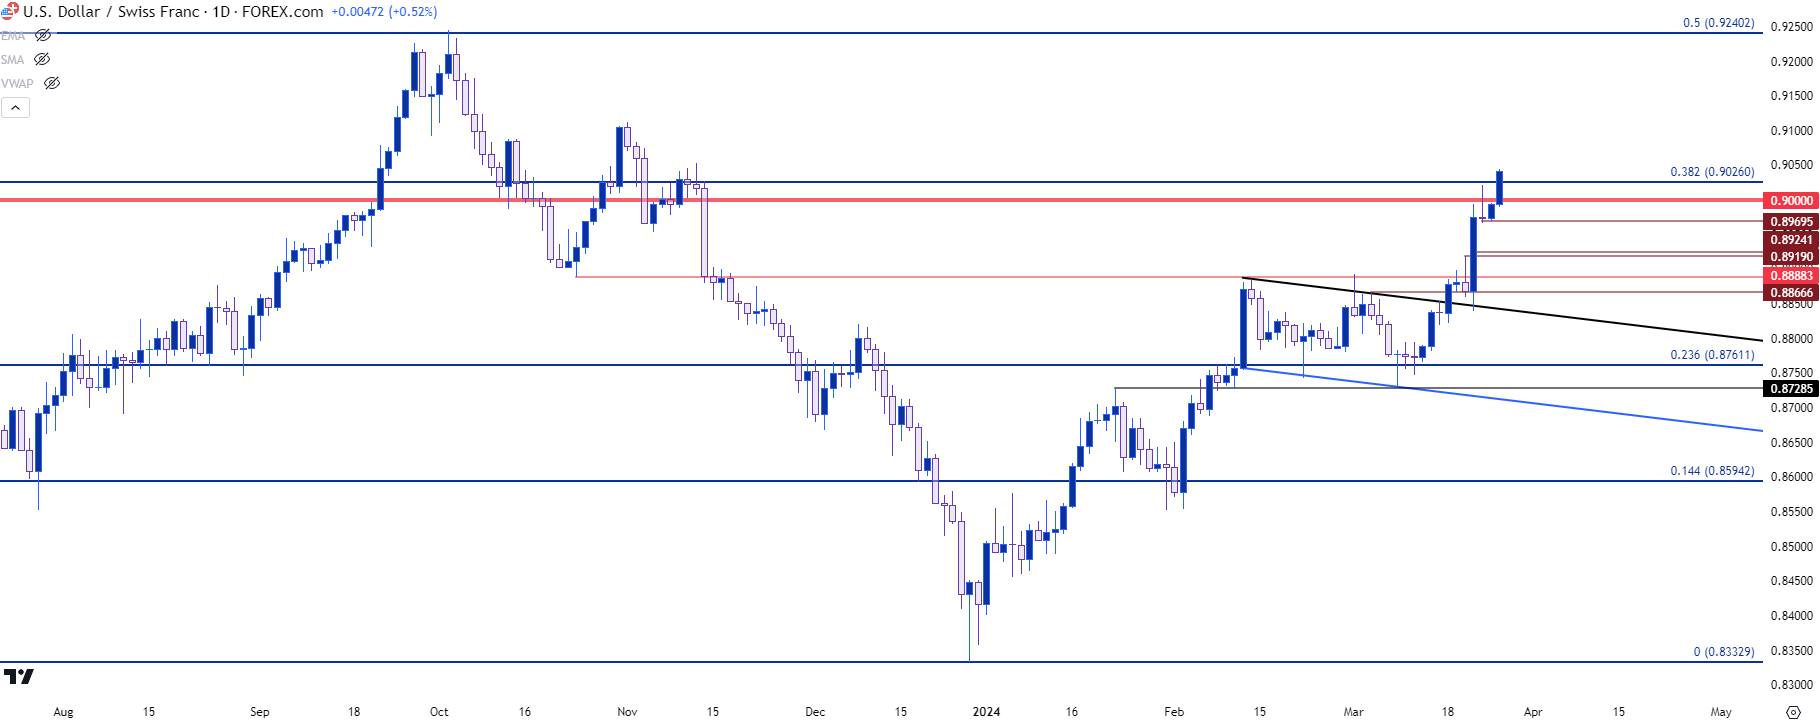 Chart prepared by James Stanley, USD/CHF on Tradingview
--- written by James Stanley, Senior Strategist


