
US Dollar Talking Points:
- The US Dollar put in a massive move last week on the heels of the CPI print. I had looked into that ahead of the release in the prior webinar, and then I wrote about it afterwards in the U.S. Dollar Price Action Setups article.
- The big question now for USD continuation is counterparts, and whether EUR/USD can push down to 1.0500 range support and whether USD/JPY can extend the breakout beyond the 155.00 level.
- U.S. Treasury rates are running higher and stocks are pulling back, which I had looked at in the Q2 Forecast for equities. The big question now is whether bears defend higher-lows in the S&P 500 or Nasdaq 100, both of which have some bearish context to consider.
U.S. Dollar Breaks Out on Another Hotter-than-Expected CPI Print
Last week’s big driver was the Wednesday CPI print, which, once again, saw Core CPI print above the expectation. That’s the fourth consecutive month for that and it’s also the seven consecutive month of Core CPI sticking within a 0.2% band of the 4% level. That’s far above the Fed’s 2% target and when combined with continued strength in the labor market, it further brings to question the expectation for rate cuts to start at some point this year.
Near immediately after that CPI print, expectations for a cut in June were priced-out; and as I had looked at last week, that would mean only four more rate decisions in 2024 and if the Fed was going to push three cuts in four meetings, that would seem like emergency-level monetary policy, and that didn’t really fit with the backdrop of Core CPI holding near 4% while the unemployment rate remained below 4% for the longest stretch since the Vietnam war.
At this point, markets are expecting two cuts by the end of 2024, which is one less than the Fed had forecast at the March meeting. But even that comes with some consequence as the election in November could give the appearance that the Fed is meddling in politics so, deductively, July would probably need to be that lift off date if the Fed is going to cut more than once this year.
FOMC Rate Expectations into End of 2024
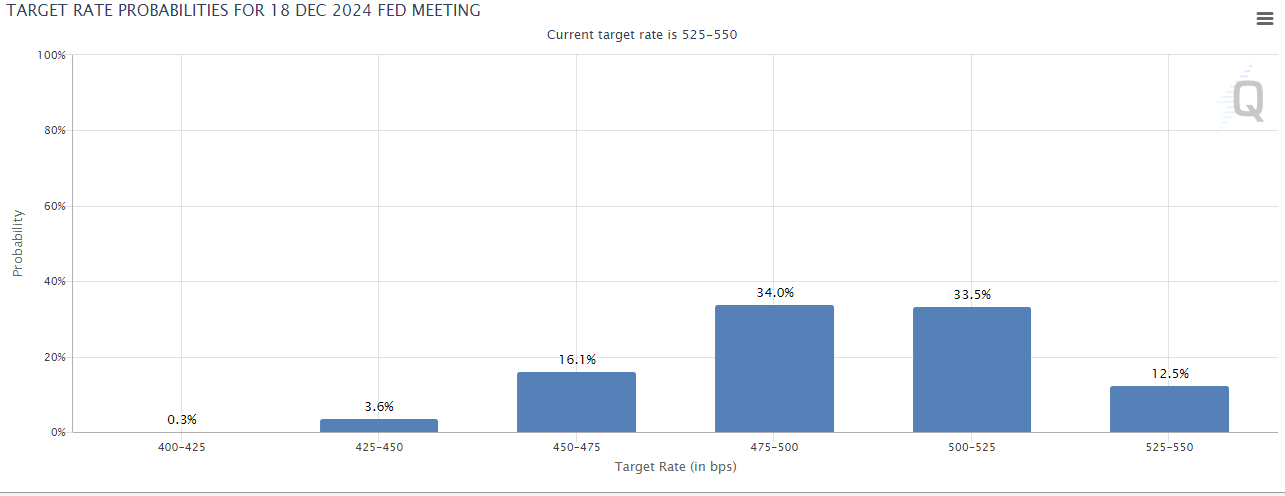 Chart prepared by James Stanley; data from CME Fedwatch
The U.S. Dollar
In last week’s webinar I had noted that a third run at 105.00 in DXY could see a different outcome. That’s a significant level for DXY as it had already held resistance twice in 2024 trade, and that’s after showing as the initial lower-low during the Dollar’s breakdown in Q4 of last year.
The third run at 105.00 cut right through the level and bulls continued to push thereafter, with another lift last Thursday morning around the ECB rate decision.
At this point, the US Dollar is nearing an important long-term level at 106.61, which is a longer-term Fibonacci level that helped to hold the highs over a couple of months last year. RSI on the daily chart is well into overbought territory – which does not preclude continued strength higher. But it does provide important context that the move may be getting crowded already. And there’s a significant resistance level nearing around 106.61, which is a long-term Fibonacci level that held the highs four a couple of months last year until DXY began to reverse.
U.S. Dollar Weekly Price Chart (with Daily RSI)
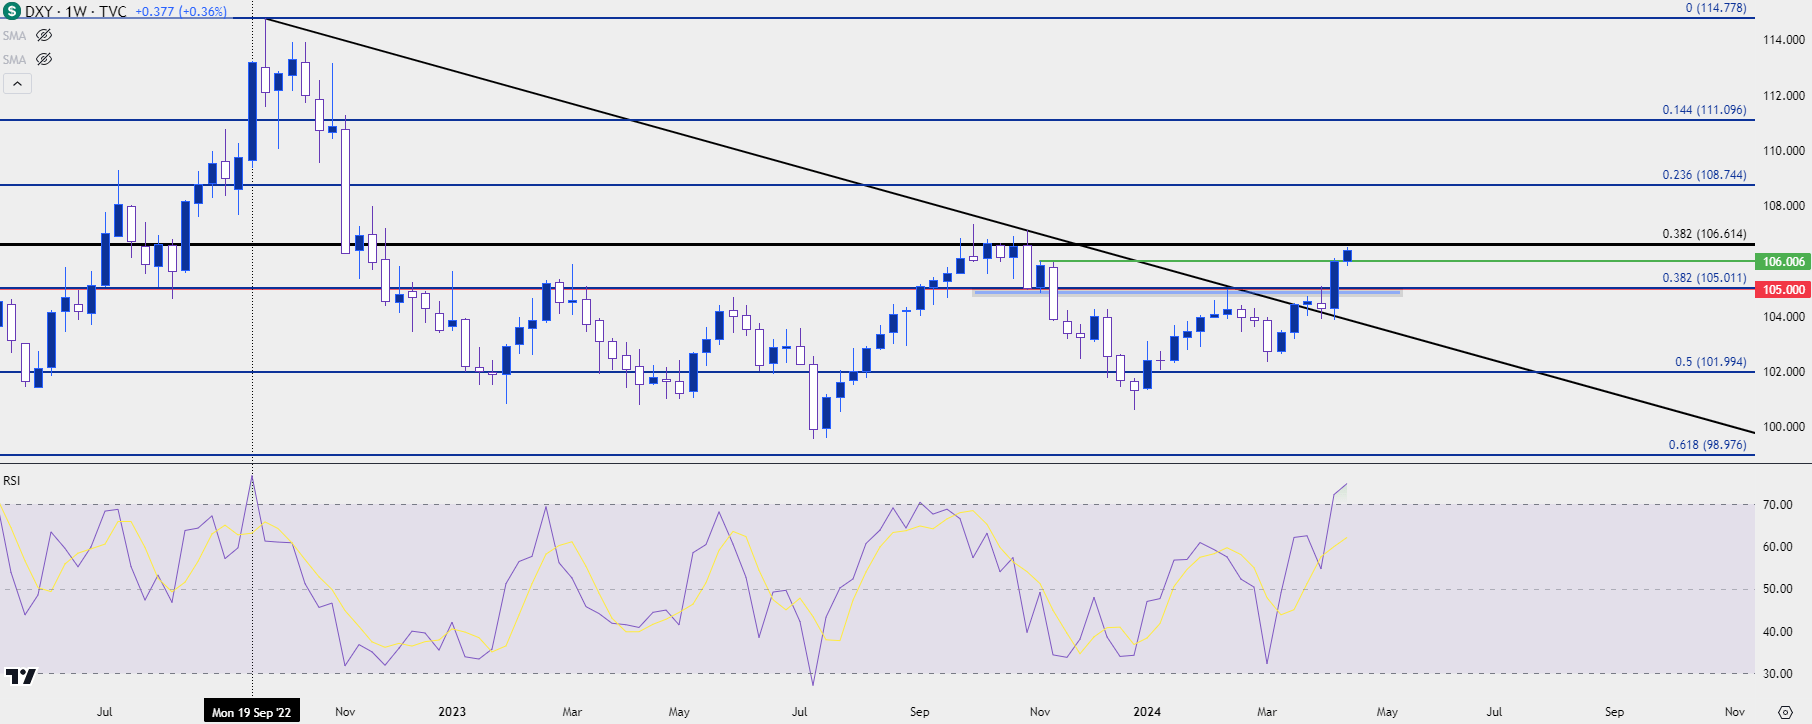 Chart prepared by James Stanley; data derived from Tradingview
EUR/USD
Given the Euro’s 57.6% allocation into DXY, themes and trends around the Euro can have a massive impact in USD price action and that’s what we saw continue last Friday, as rate expectations were shifting to the expectation for the ECB to cut before the Fed.
But, for both the ECB and the FOMC, it would seem that stability in the exchange rate would be a desired trait for both economies, and I dug into that yesterday in the Euro article. The big question now is whether the trend that’s started to get priced-in could allow for breach of the range that’s held in EUR/USD for more than 15 months now.
At this point, support is showing at the 38.2% Fibonacci retracement of the 2021-2022 major move. That same move had a 61.8% retracement that held the high last year, and the 50% mark of that same study was helping to cauterize resistance in March. With the 38.2% level now in-play, the big question is whether it can produce a bounce and, if so, whether bears use that as a lower-high to make a push down to range support at the 1.0500 handle.
EUR/USD Weekly Price Chart
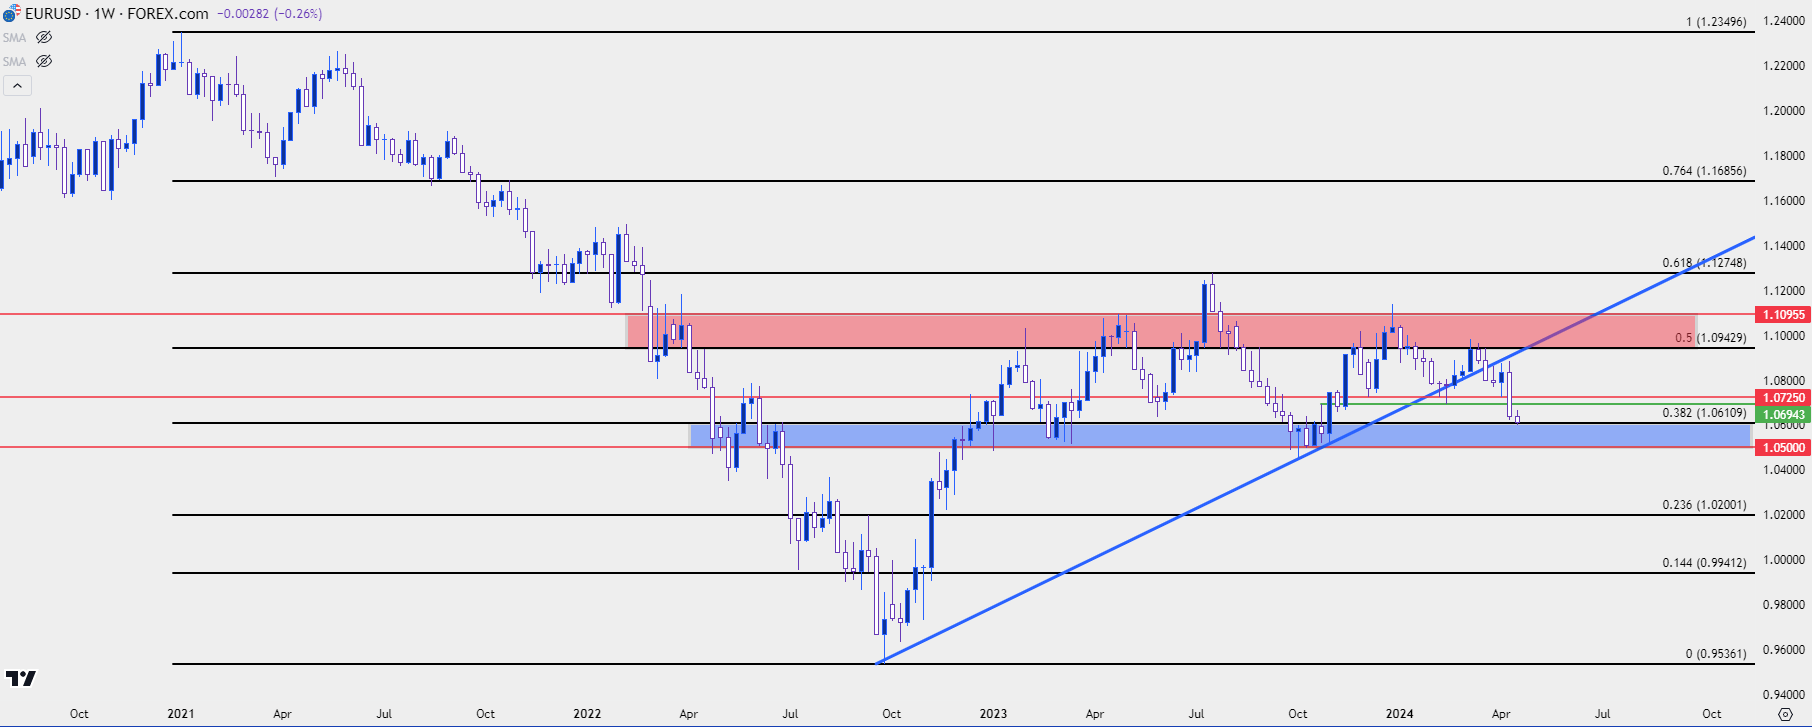
Chart prepared by James Stanley, EUR/USD on Tradingview
USD/JPY 155.00, 160.00
I had looked into this one last week and I had also looked at this back in March, just after the BoJ rate hike. As I said back in March, “there’s probably some stops sitting above 152.00. Stops on short positions are buy-to-cover order logic, which means an influx of demand could hit the market upon that print of fresh highs. That could lead to a continuation in the move, and this is one of the reasons that a well-defended resistance level yielding to breakout can often push into a sharp topside move.”
When the pair did not break down after that rate move and price pushed right back to resistance at 151.95, a counter-scenario had started to build. And with a well-defined resistance level such as we had at 151.95, there were probably some stops sitting above that level. And if those stops on short positions got triggered – that could lead to an influx of demand. Stop orders are usually ‘at best’ execution, which means those stops being triggered and coming into as market orders could get slipped as there were probably few, if any, sellers looking to fade a fresh high in USD/JPY right as the break was happening.
Since then, the pair has continued to push higher and the 155.00 level that I had mentioned over the past couple of webinars is now already almost in the equation. We’ve heard more of the verbal threats behind intervention but, at this point, bulls have continued to push, and price has continued to trend-higher. So, this sets the stage for the BoJ/Finance Ministry to try to set another line-in-the-sand and, logically, psychological levels become points of interest.
If the 155.00 level doesn’t hold, the 160.00 level comes into play and that had helped to set the high back in 1990, right around the time that the Nikkei had topped. And this helps to illustrate a relationship, along with a possible reason why Japanese policymakers may not be so hasty to intervene. On the below chart, I’m looking at the USD/JPY spot rate going back to 1987 as the blue line, and the Nikkei as the orange line.
Both markets bottomed in 2012 and that’s when Shinzo Abe’s ‘three arrows’ approach took over, and the arrow from that which seemed most effective was the Yen-weakness aspect.
USD/JPY (blue) And Nikkei (orange) Since 1989 – Monthly Chart
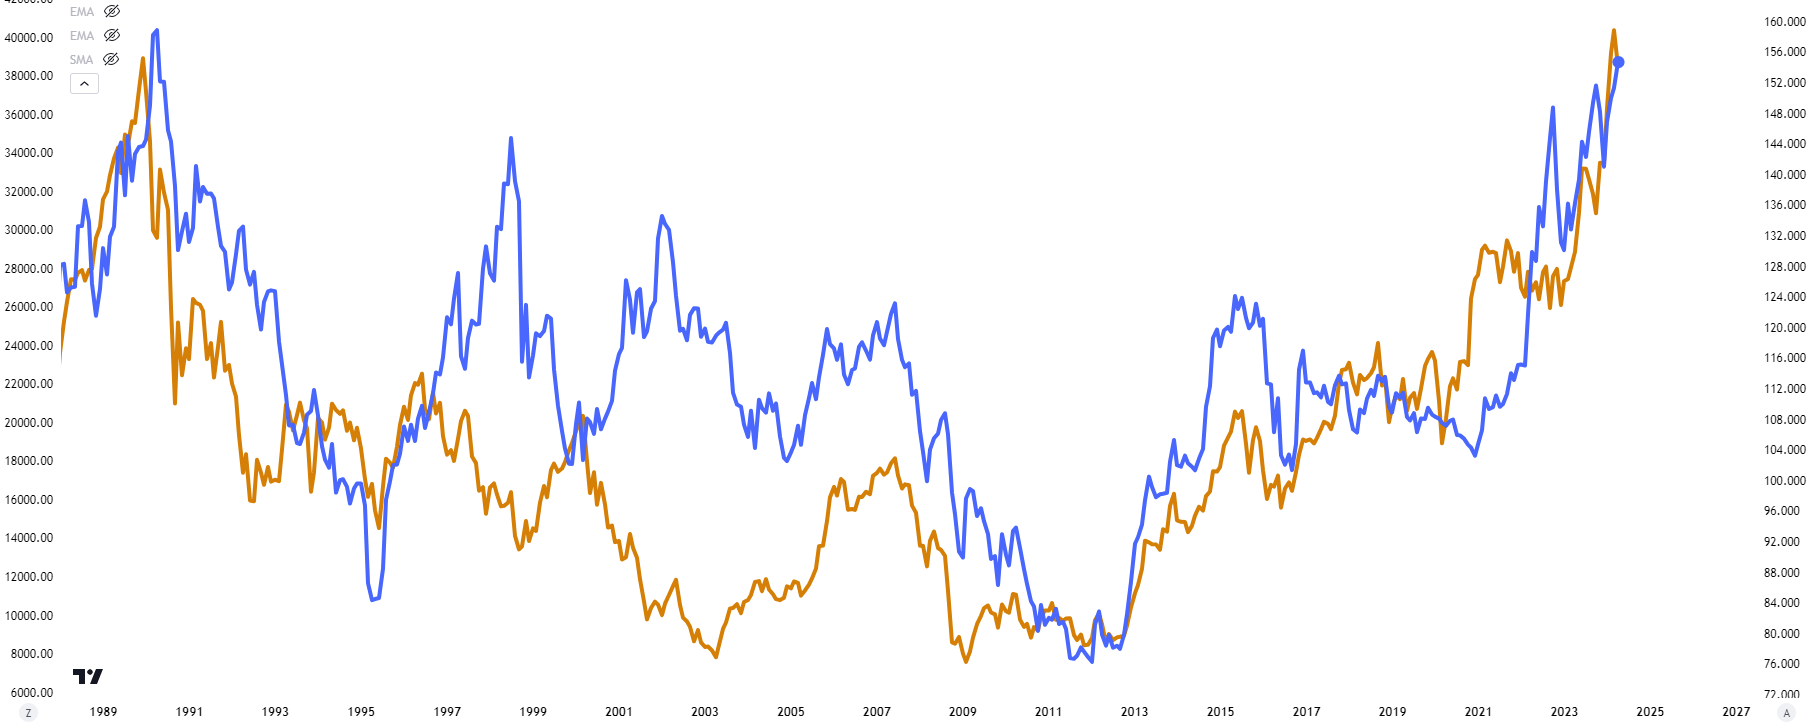
Chart prepared by James Stanley; data derived from Tradingview
Gold (XAU/USD)
Gold has continued to run-higher despite overbought conditions showing on a variety of time frames. This has happened amidst a flare in yields as well as USD, and my explanation for this is the Fed’s continued dovish talk despite the stall in Core CPI and strong labor market. This shows a Fed that really doesn’t seem to want to hike, and I think that’s playing a role in the continued breakout in Gold.
Nonetheless, the ‘why’ is less important than the ‘what’ to the trader, and the ‘what’ is pretty clear here as buyers have just continued to push. At this point, spot gold appears to be trying to gain acceptance over the next major psychological level at $2400. There’s shorter-term support structure at $2380 and $2365, after which $2350 comes into the picture and that’s followed by a support zone spanning from $2319-$2326.
Gold Hourly Price Chart
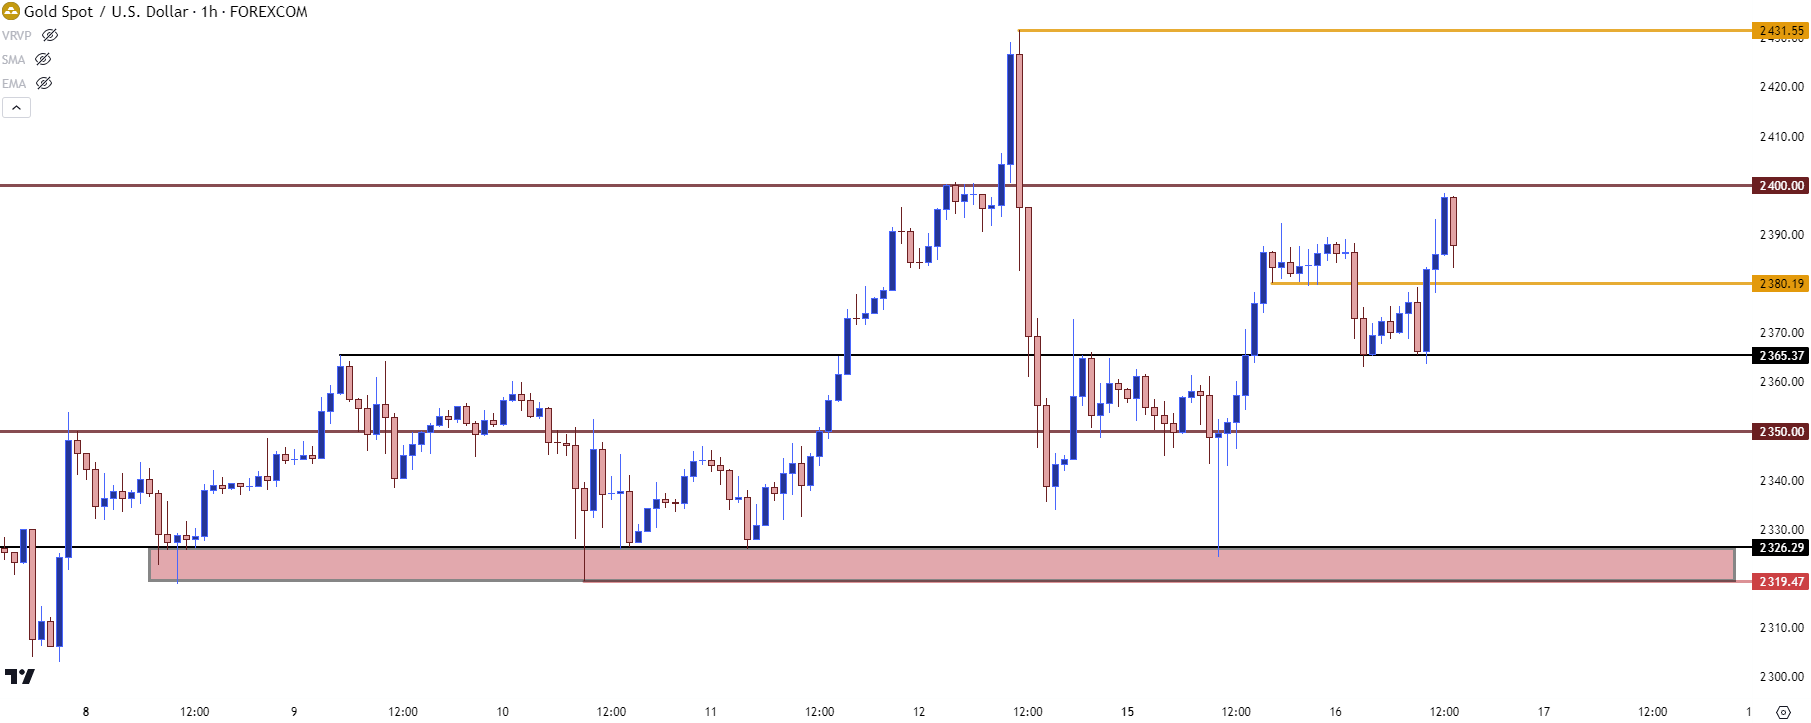 Chart prepared by James Stanley, Gold on Tradingview
USD/CAD
USD/CAD had a slow start to the year and from the daily chart, much of the price action I had looked at to start 2024 was messy, to some degree. The move has been getting clearer of late, however, and there’s been a clear divergence in the fundamental background. The BoC is talking up rate cut potential and data in Canada appears a bit more sour, which could support a dovish outlay from the Bank of Canada as the FOMC continues to see strong data out of the U.S.
The breakout in USD/CAD is now fast approaching a key point of longer-term resistance. The 1.4000 psychological level is obvious, but there’s been considerable posturing just below that, as well, from around 1.3850.
USD/CAD Weekly Price Chart
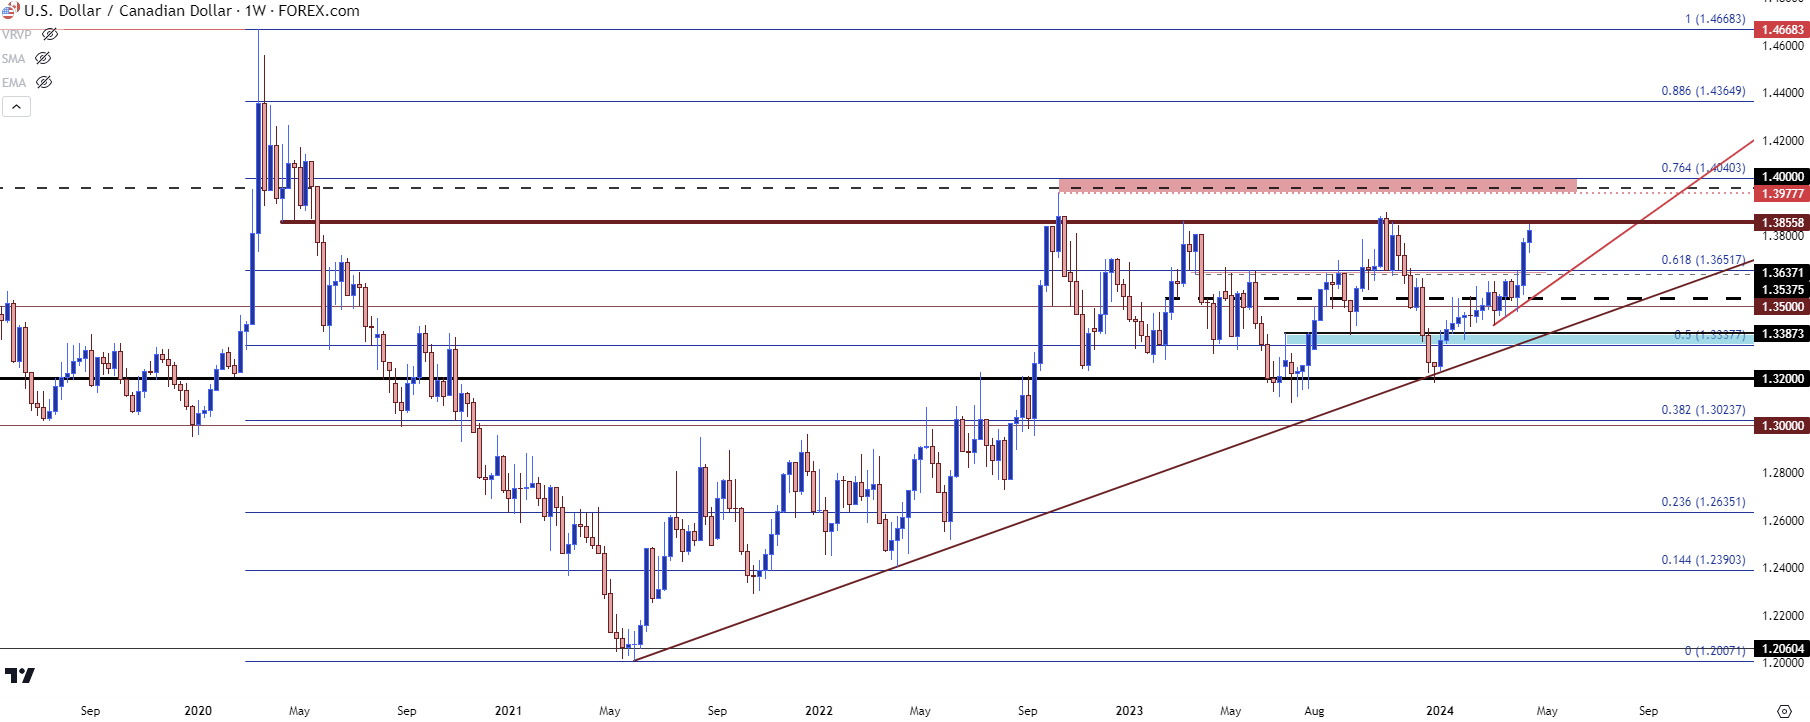 Chart prepared by James Stanley, USD/CAD on Tradingview
--- written by James Stanley, Senior Strategist


