
U.S. Dollar Talking Points:
- It’s been a big week for the U.S. Dollar as the greenback has gained 1.61% this week, as of this writing.
- The CPI print on Wednesday was a major push point but DXY got another significant push yesterday around the European Central Bank rate decision.
- For next week, Fed-speak is of consideration as we’ve continued to hear the Fed talk up rate cuts despite the continued strength in U.S. data, which likely helps to explain the massive breakout move that’s shown in Gold. Also of interest is the breakout in USD/JPY and whether the Japanese Finance Ministry orders an intervention or whether they take a more threatening tone towards currency movements.
- The Trader’s Course has been released, and is available from the following link: The Trader’s Course
- I’ll be discussing these themes in-depth in the weekly webinar. It’s free for all to register: Click here to register.
It's been a big week for the U.S. Dollar, and that phrase can be spanned across 2024 trade so far as DXY has continued to gain since setting a low on December 28th of last year.
It hasn’t been a linear path. But the U.S. Dollar broke a key spot on the chart this week and after that breakout, bulls have continued to drive the bid.
The spot in question is the 105.00 handle in DXY, and there’s considerable confluence of support/resistance at this area of the chart. I’ve been talking about it in webinars for months, even going back to last year before the U.S. Dollar had reversed its bullish trend. It’s a psychological level but it’s also the 38.2% retracement of the 2021-2022 major move. It had come into play last November when the USD started to break down, just after the FOMC rate decision at which the Fed seemingly ruled out the possibility of any additional rate hikes.
That sent the Dollar spiraling-lower into the end of the year, but it was back-in play in February, just about two months ago, fresh on the heels of another hotter-than-expected CPI print. A day later, Chicago Fed President Austan Goolsbee said that market participants shouldn’t get ‘flipped out’ about the inflation print, and that led into a reversal move that lasted all the way until the NFP report was released in early-March.
A second test of 105 failed again last week, but as looked at in the webinar on Tuesday, the response from that second test had so far held a higher-low at a key level on the chart. And as I said in that webinar, a hot CPI print could provoke a third test of 105, and that third test of 105 could very well see a different outcome given the backdrop of a higher-low.
And at this point, the U.S. Dollar is working on its strongest week since September of 2022, just before DXY had topped.
U.S. Dollar Weekly Price Chart
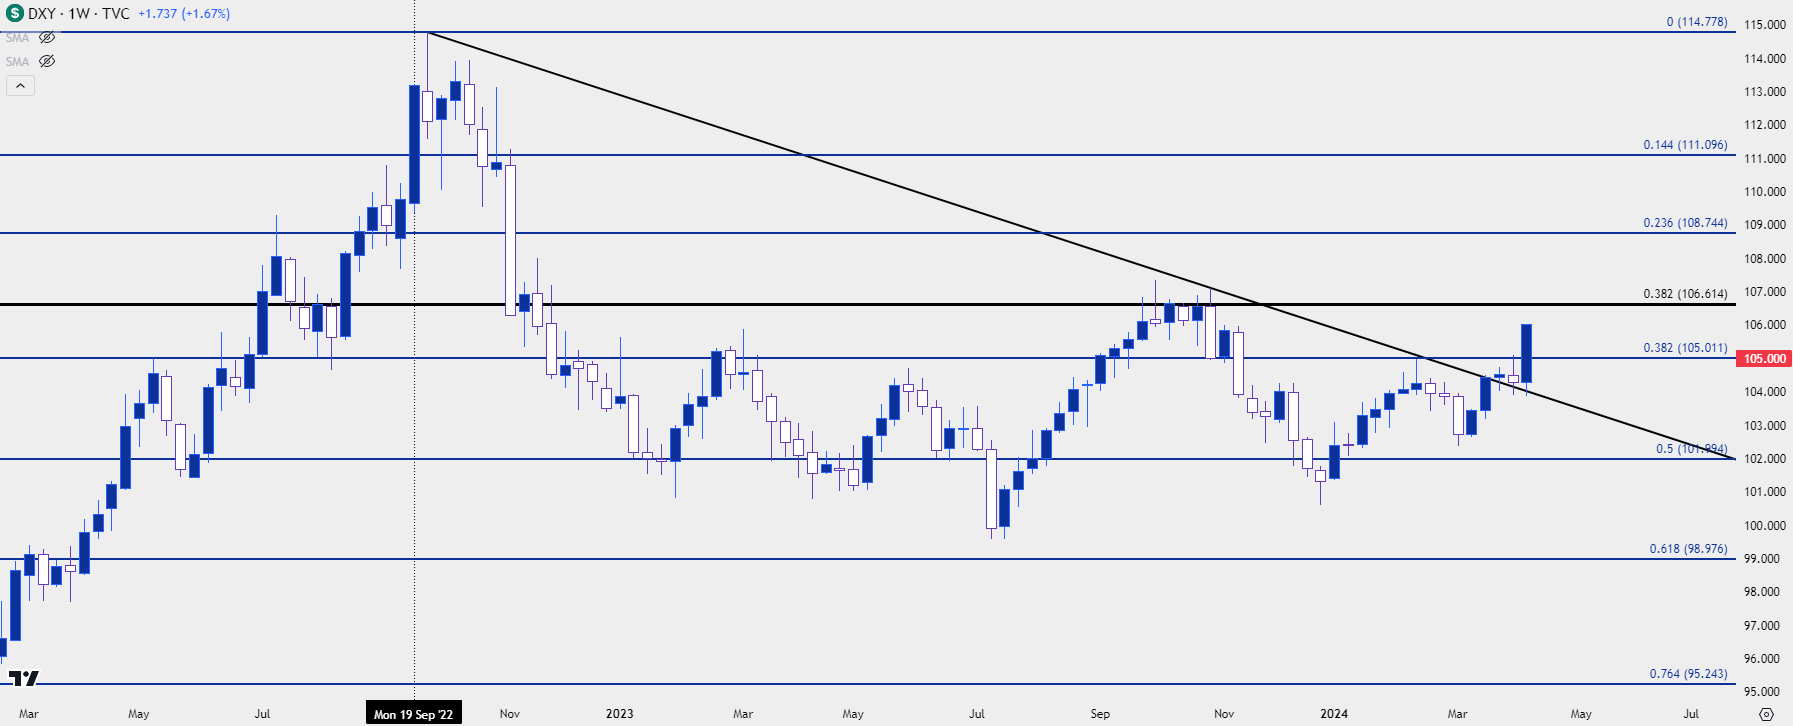 Chart prepared by James Stanley; data derived from Tradingview
USD Shorter-Term
Another phrase I’ve used quite a bit this year is that the ‘natural flow’ of the USD appears-higher, but Fed-speak has been so incredibly dovish that it’s been a major factor in the trend. Such as we saw back in February, when Austan Goolsbee seemingly shrugged off that higher-than-expected CPI print, or even a few weeks ago when he seemed to dismiss the inflation data from earlier in the year. This also echoes what Chair Powell has said on the matter and it’s one of the likely factors behind the Fed’s continued expectation for three rate cuts this year.
I talked about this yesterday and it’s starting to seem more and more like the transitory episode of 2021, when inflation continued to climb yet the Fed continued to shrug it off under the presumption that it was supply chain-related, and likely to abate on its own. That, of course, didn’t play out, and the Fed had to hurriedly hike rates in 2022; but that didn’t last for long until the bank started to forecast eventual rate cuts again which helped to bring the bid back to stocks in Q4 of 2022.
Last year saw the AI-craze and that helped to drive equity markets back-up to fresh highs; but a major component of that was FOMC dovishness and the expectation for rate cuts to begin at some point in 2024.
The data just has not worked out that way so far as the labor market remains strong as witnessed by the longest streak of sub-4% unemployment since the Vietnam war; and inflation via Core CPI has continued to hold around the 4% marker for now seven consecutive months.
This speaks to the prospect of inflation entrenchment, which is a risk that Chair Powell had mentioned last year as response to slowing rate hikes. To beat inflation entrenchment, there may be the need for more hikes; but at this stage the Fed hasn’t seemed open to that idea so what we’ve witnessed over the past week and change is the simple re-pricing of that probability, as rate cut liftoff is no longer expected in June and the prospect of three cuts in 2024 trade is now very much in question.
The U.S. Dollar is a composite though, so deriving a macro theme from USD price action alone could be misleading. Because if the Euro is sinking or the Yen is sinking, that can drive the value of USD-higher regardless of rate expectations. The fact that the breakout in Gold is continuing to jump and that stocks have, so far, held support, seems to indicate that markets are not expecting that hawkish-twist from the FOMC; and this puts the focus on Fed-speak for the next week, until we get into the blackout period for the May 1st rate decision from the Fed.
In the U.S. Dollar for next week, the big question is pullback potential. The breakout this week has pushed through so many different resistance levels that there’s several possible areas of interest.
On a longer-term basis, as can be seen from the chart above, the Fibonacci level at 106.61 remains important. This is a longer-term level but when it came into play last year, it killed an extremely strong bullish trend in the USD as the currency had gained for 11 consecutive weeks until running into that level. Below that, there’s a Fibonacci level at 106.23. For support, DXY is already trading above the 106.00 handle and that was the lower-high that appeared last year before the breakdown. There’s Fibonacci levels at 105.76 and 105.51, with the latter of those prices helping to set resistance yesterday. Below that, it’s the same 104.77-105.00 zone that I’ve been harping on all year and, notably, that firm spot of resistance hasn’t yet seen a test of support.
U.S. Dollar Daily Price Chart
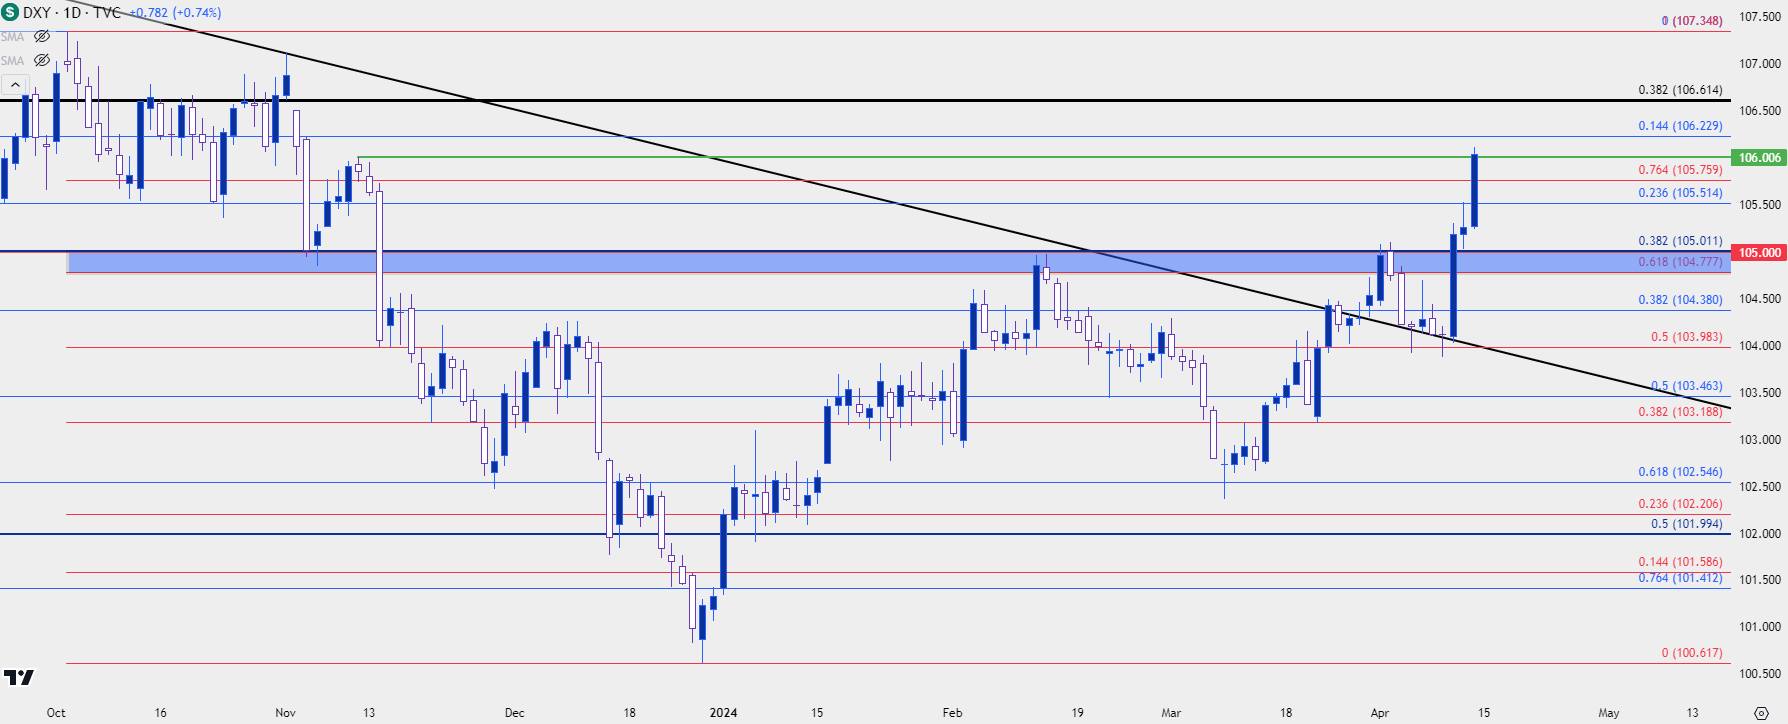 Chart prepared by James Stanley; data derived from Tradingview
EUR/USD
There was a stark trend in EUR/USD in 2021 and the first nine months of 2022 trade. This is when the Fed was gearing up for and eventually started to hike rates, and then got more aggressive with 75 bp hikes in June of 22. The European Central Bank was less-hawkish and that deviation allowed for a strong bearish trend to develop in EUR/USD. Eventually, the pair pushed below the parity level and given that we’re talking about currencies, there’s consequence to consider.
A plummeting currency value means higher rates of inflation; so, in essence, the rate hikes from the U.S. in early-2022 were serving to export U.S. inflation to Europe. That then put the ECB in a difficult spot as growth was relatively slow, but inflation was high, and the bank had little choice but to hike rates and, soon, they were hiking in 75bp increments, as well.
That’s one of the major factors that helped the U.S. Dollar to reverse in late-2022 trade, as U.S. inflation had started to slow just around the time the ECB picked up larger rate hikes. But, as EUR/USD entered 2023, a range began to appear, and that’s largely held for the past 15 months, as shown below.
The Fibonacci retracement produced by the 2021-2022 sell-off has several interesting items: The 61.8% level at 1.1275 held the highs last July before the U.S. Dollar 11-week streak began; and the 50% mark held the highs over a three-week period in March as the pair started to turn. We’re now fast approaching the 38.2% retracement of that move at 1.0611.
EUR/USD Weekly Price Chart
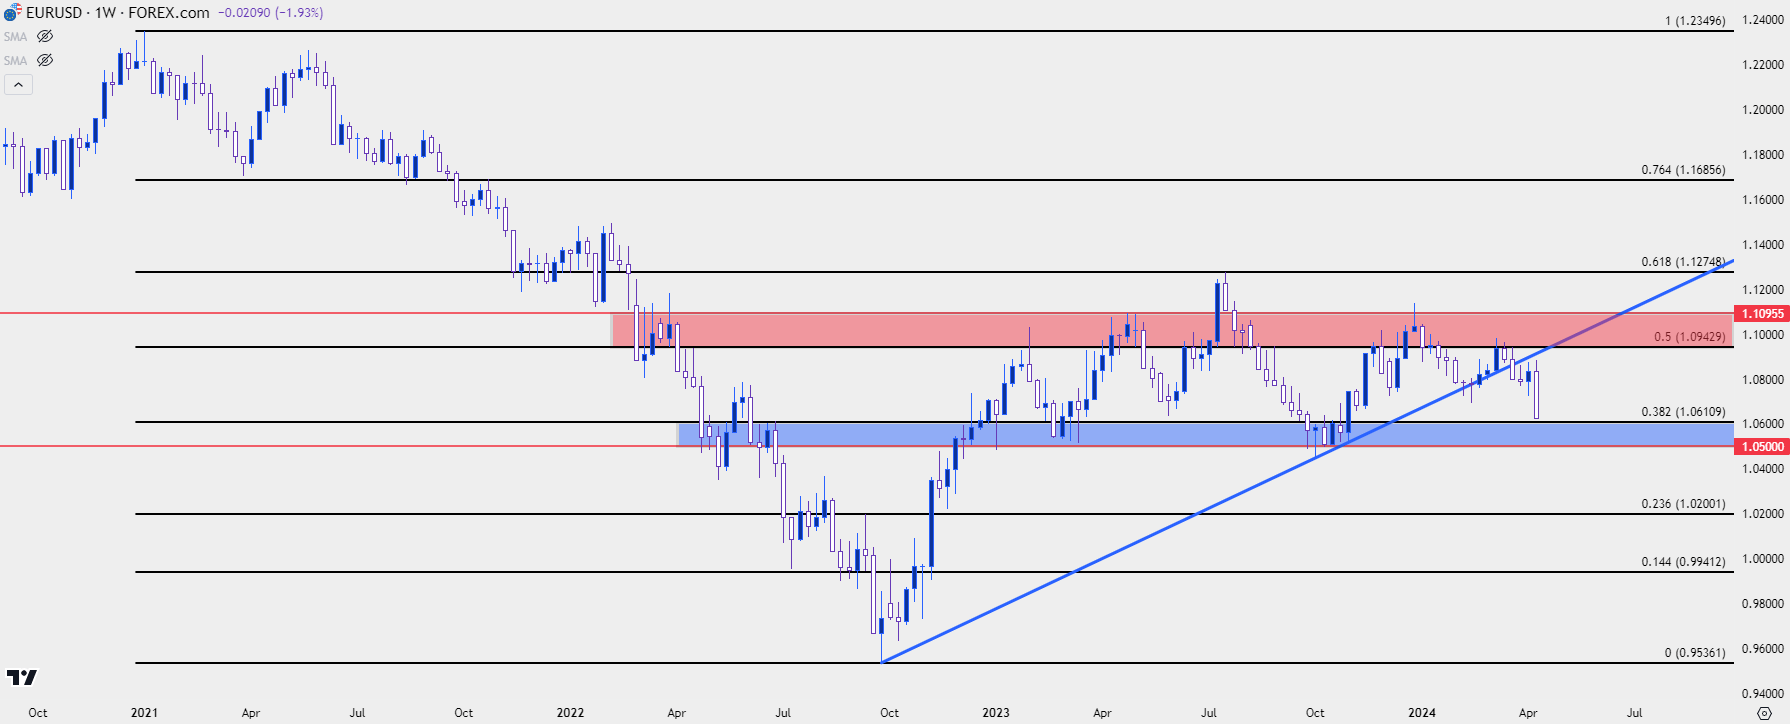 Chart prepared by James Stanley, EUR/USD on Tradingview
EUR/USD Shorter-Term
From the daily, the size of this week’s move is well-illustrated, and there’s a number of prior supports that can become of interest for short-term resistance potential. The longer-term range support noted above could serve to slow the sell-off. There’s potential for lower-high resistance at 1.0656, 1.0694 and 1.0725. If prices push above that, then the 200-day moving average comes back into the picture which currently plots around 1.0825.
EUR/USD Daily Price Chart
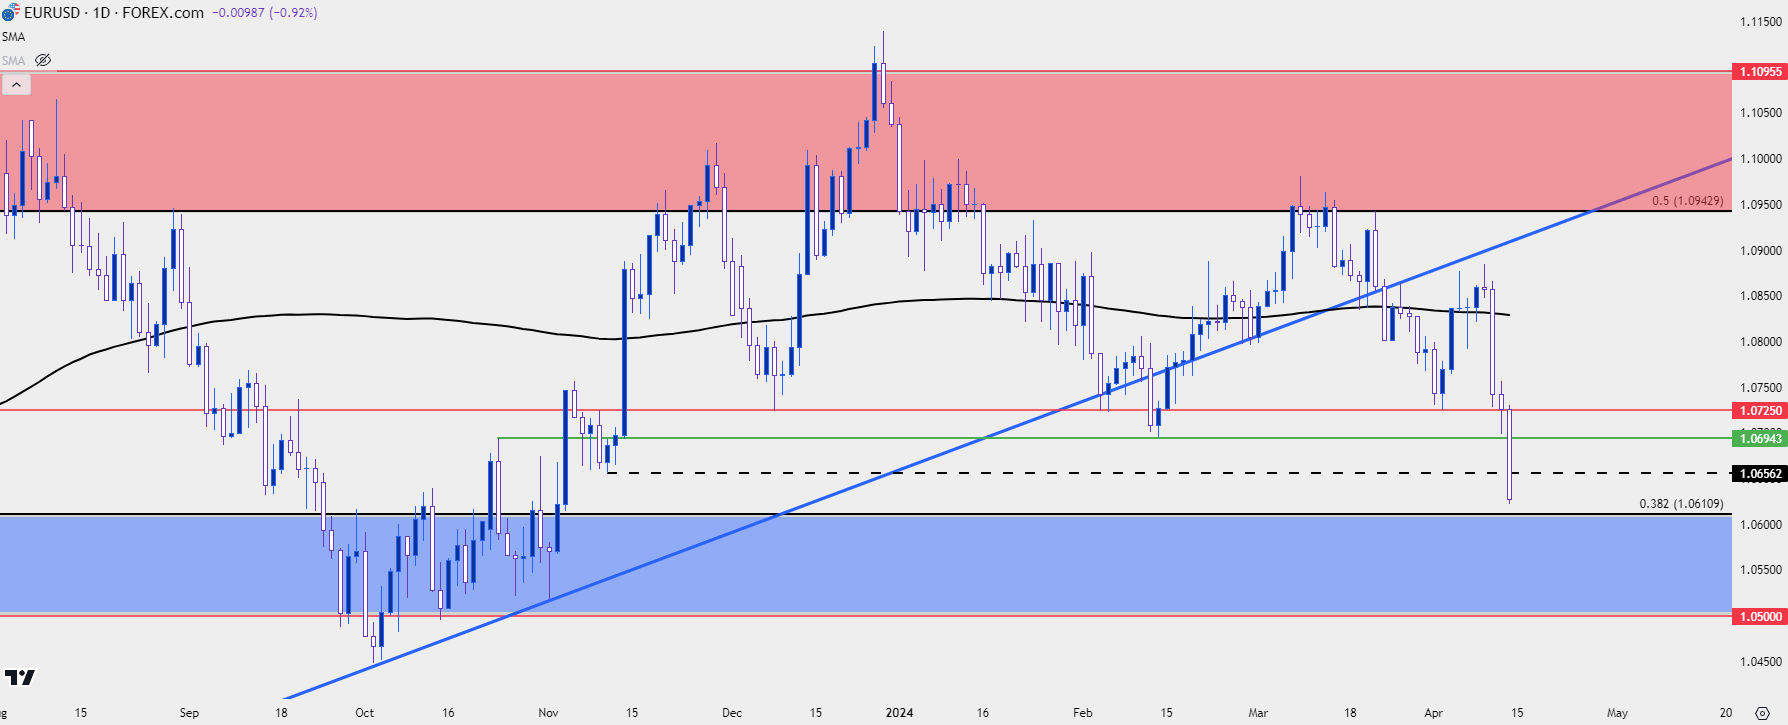 Chart prepared by James Stanley, EUR/USD on Tradingview
GBP/USD
It was a similar sell-off in Cable this week, and this comes after a resistance inflection at a long-term trendline last month. The March candlestick finished as a gravestone doji and so far in April, bears have been in-control.
GBP/USD Monthly Price Chart
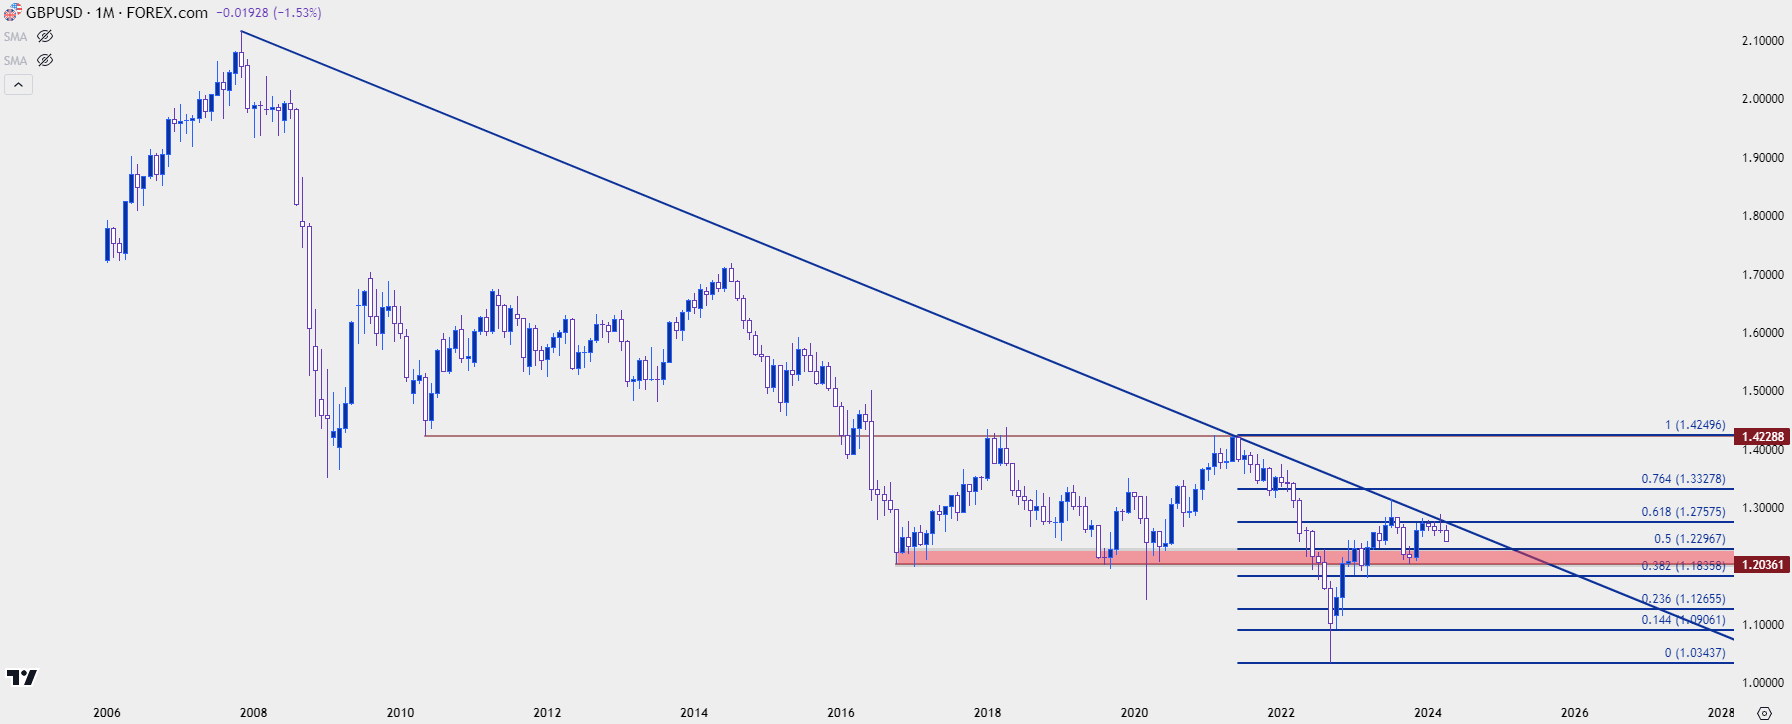 Chart prepared by James Stanley, GBP/USD on Tradingview
The big item of note this week on GBP/USD is the breach of the 1.2500 level. This price had set support on two separate occasions in December after showing as resistance in November; and so far in 2024 trade sellers seemed reticent to stretch down to the big figure. But, that now becomes resistance potential with the 1.2536 swing just above that.
GBP/USD Daily Price Chart
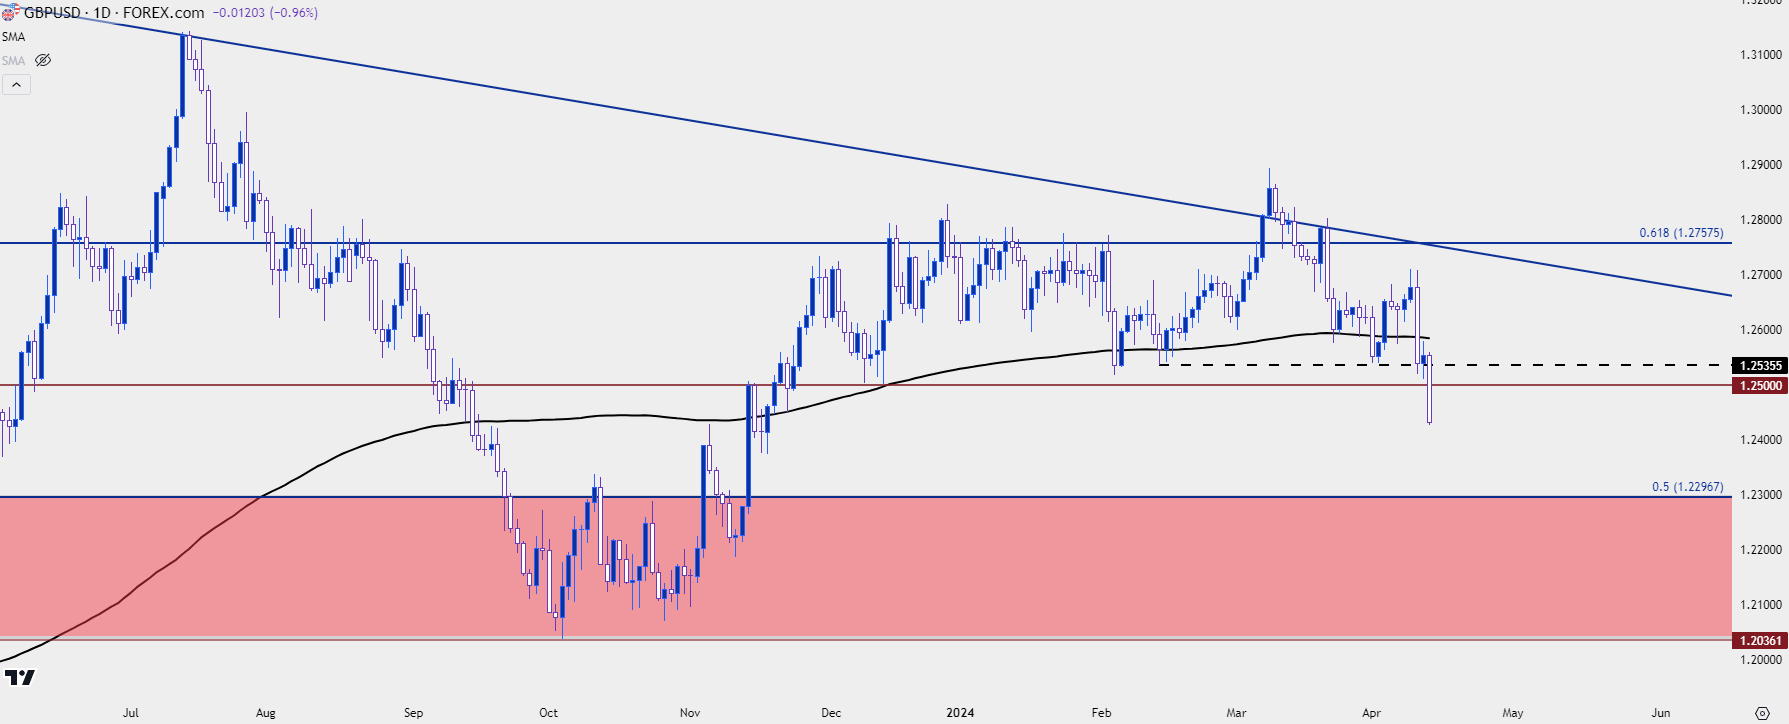 Chart prepared by James Stanley, GBP/USD on Tradingview
USD/JPY
USD/JPY finally broke out from the 151.95 level that had held as resistance for the past two years. This remains a contentious item as there’s still the possibility that the Japanese Finance Ministry steps in, but as I had discussed back in March, just after the BoJ rate hike, the build of an ascending triangle formation combined with a contentious spot of resistance meant that there were probably some stops lodged above that price.
Stops on short positions are buy-to-cover logic, and usually those are market orders to execute at the best available price, which means the possibility of slippage.
Once the level is traded through and once stops are triggered for execution, that can add demand into the market – and if there aren’t sellers standing by ready to offer liquidity, the breakout can continue to breakout, similar to what we’ve seen in USD/JPY since the CPI report on Wednesday.
The big question now is whether the factor that helped that resistance to form comes back into the equation, and that’s the potential for an intervention announcement. As I had discussed in webinars, it would not be out of the realm of possibility for the Finance Ministry to draw a line-in-the-sand a little higher, such as around the 155.00 or 160.00 levels. This would be like the 2022 episode in which 145 was the level thought to be protected. That helped resistance to hold for about a month before buyers ultimately pushed the envelope up to the next big figure at 150.00. And that level finally got the BoJ to act.
USD/JPY Weekly Price Chart
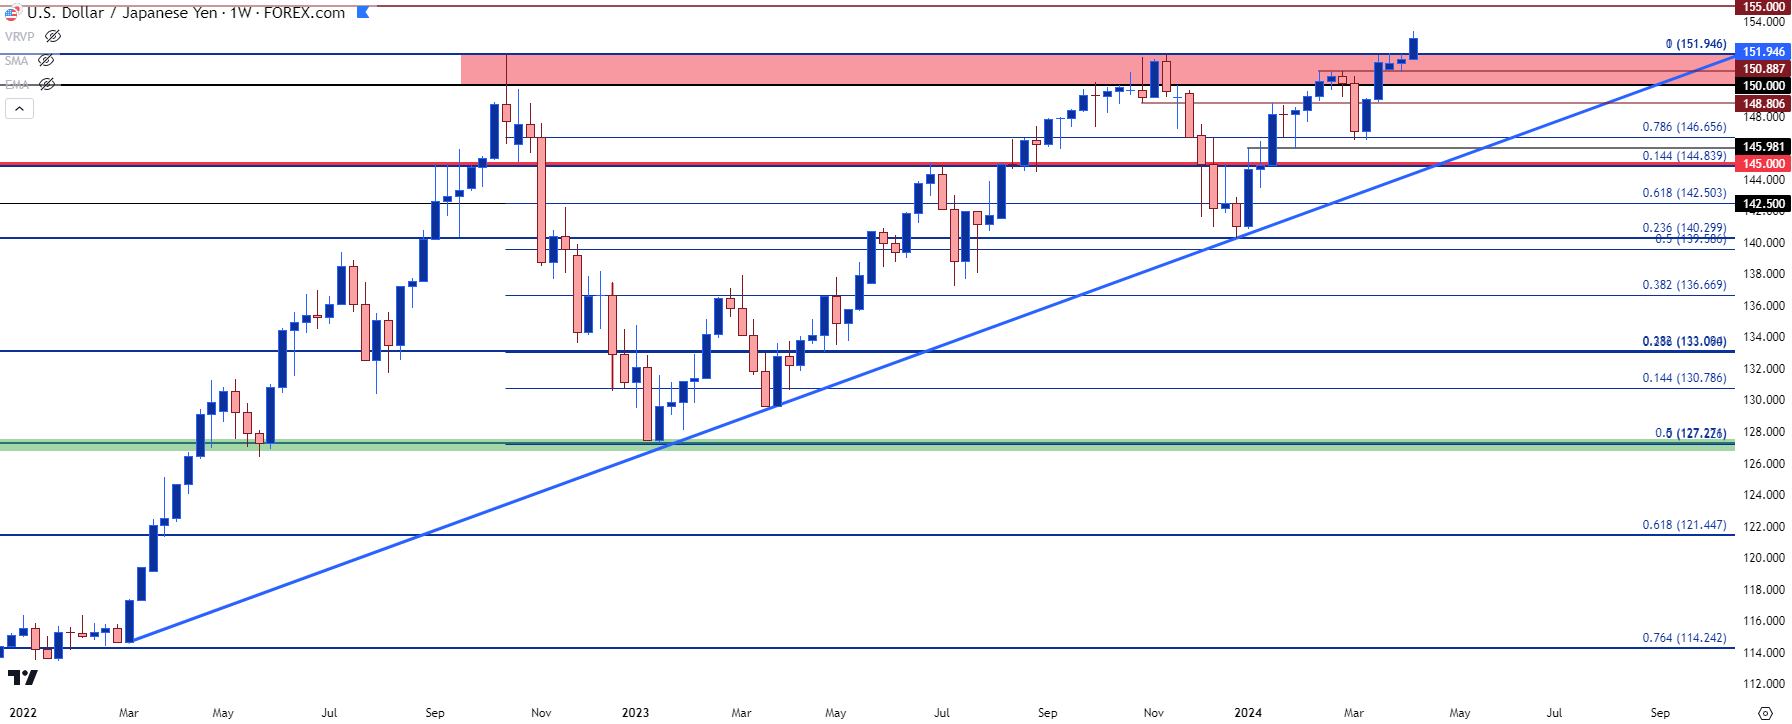 Chart prepared by James Stanley, USD/JPY on Tradingview
USD/JPY Shorter-Term
It’s important to remember that the intervention in 2022 did not reverse the trend on its own. It merely pushed bulls back to support, which held around that 145 level that was prior resistance.
What ultimately drove the reversal was the move in the U.S. Dollar, on the back of softer U.S. inflation which was showing as the ECB was increasing rate hikes. So DXY fell quickly as the Euro increased in value and that USD-weakness was a significant factor for unwinding carry trades.
A similar scenario showed last year around the same 151.95 level. In November, U.S. CPI came out softer-than-expected and the fear of a USD-reversal helped to drive a 1,000+ pip pullback in USD/JPY. But – the big difference in that episode is that the USD did not keep sliding as there wasn’t the same rate hike scenario pricing-in around the Euro that we had seen the year before.
This is what helped to build the ascending triangle, and much like we’ve seen on a shorter-term basis with DXY at 105, the third time was the charm as this year’s episode has yielded to breakout. There’s likely some motive for profit taking up here; and even if the BoJ does intervene the question remains as to whether that will merely be a pullback to a higher-low or whether it can forcefully reverse more of the move.
At this point, that 151.95 area becomes support potential, and there’s the 150.89 level and 150.00 level below that.
USD/JPY Daily Price Chart
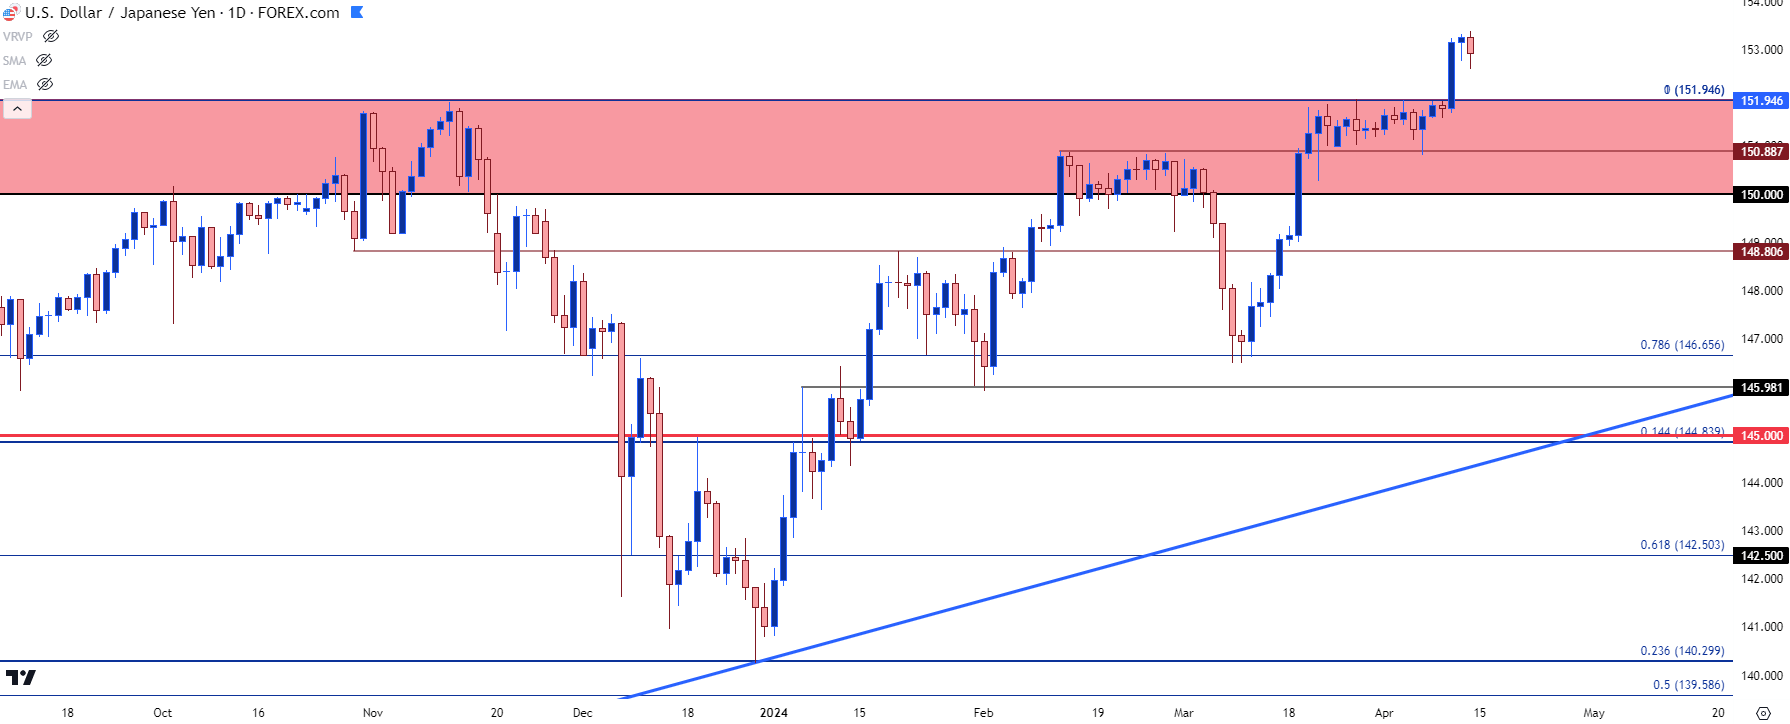
Chart prepared by James Stanley, USD/JPY on Tradingview
Gold Price Parabola
I mentioned this earlier but, in my opinion, we’re seeing a few different factors pushing gold prices higher. There is, of course, the possibility of the war bid given dynamics in the Middle East, and it seems that tensions remain high there as we move into the weekend. There remains a legitimate fear of an attack from Iran which could escalate matters into a more global affair; so likely, at least some of the strength that we’re seeing has that factor as a push point.
But that doesn’t seem to be the only driver, as the response to the CPI report has been telling. Wednesday was a red day for gold but that was a mere pullback to support. Yesterday saw a strong bid and that’s continued through Friday trade; so it seems as though there’s also a response to the Fed’s continued dovishness despite that continued strength in CPI.
From the weekly chart below, we can put the size of the current breakout into perspective, which also indicates that there’s more than just one factor behind the push in gold.
XAU/USD (Gold) Weekly Price Chart
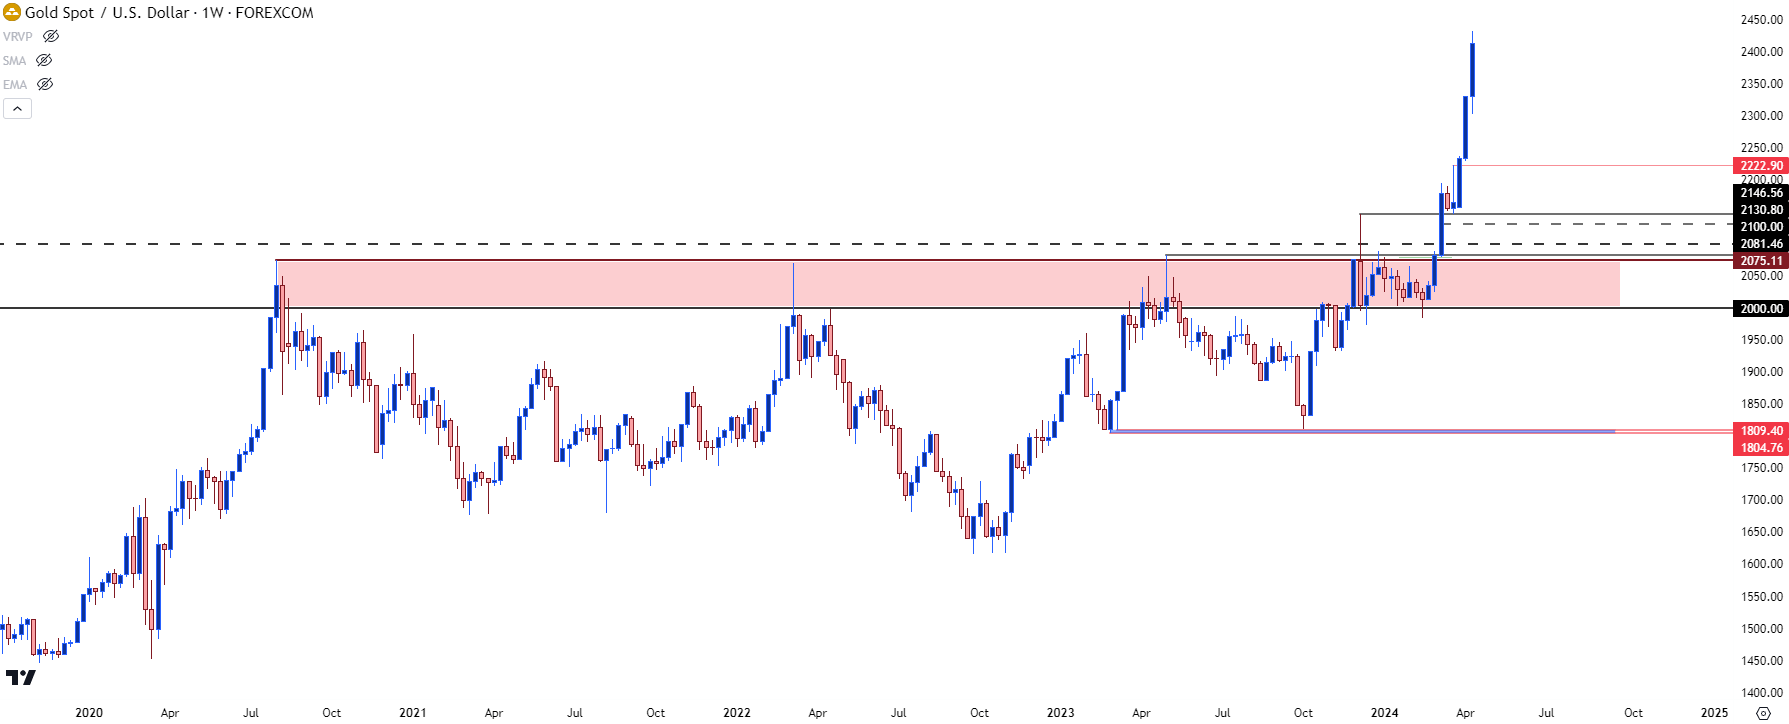 Chart prepared by James Stanley, Gold on Tradingview
Gold How High Does it Go?
This is always a difficult question with a fresh breakout to all-time-highs; but there’s often no shortage of opinions with random numbers thrown out there.
So, I want to say this up front: I have no idea how long this trend runs for and it’s massively stretched from a variety of angles. But that doesn’t mean that it has to come down. There can be opportunity for pullback, such as we saw on Wednesday after the CPI report, and at the time gold was working on the $2350 level for resistance, helping to accentuate the importance of round numbers during fresh breaks.
When a market is breaking fresh ground, psychological levels can often become a focal point simply due to a dearth of additional context. And given how strong this has run, the $2500 level could be of note. Support structure could be more clear, however, given some prior history around those prices. I’m tracking possible supports at $2,365, $2,326 and then $2,267. Below that is a zone from $2,222 up to $2,228 that remains of interest.
XAU/USD (Gold) Four-Hour Price Chart
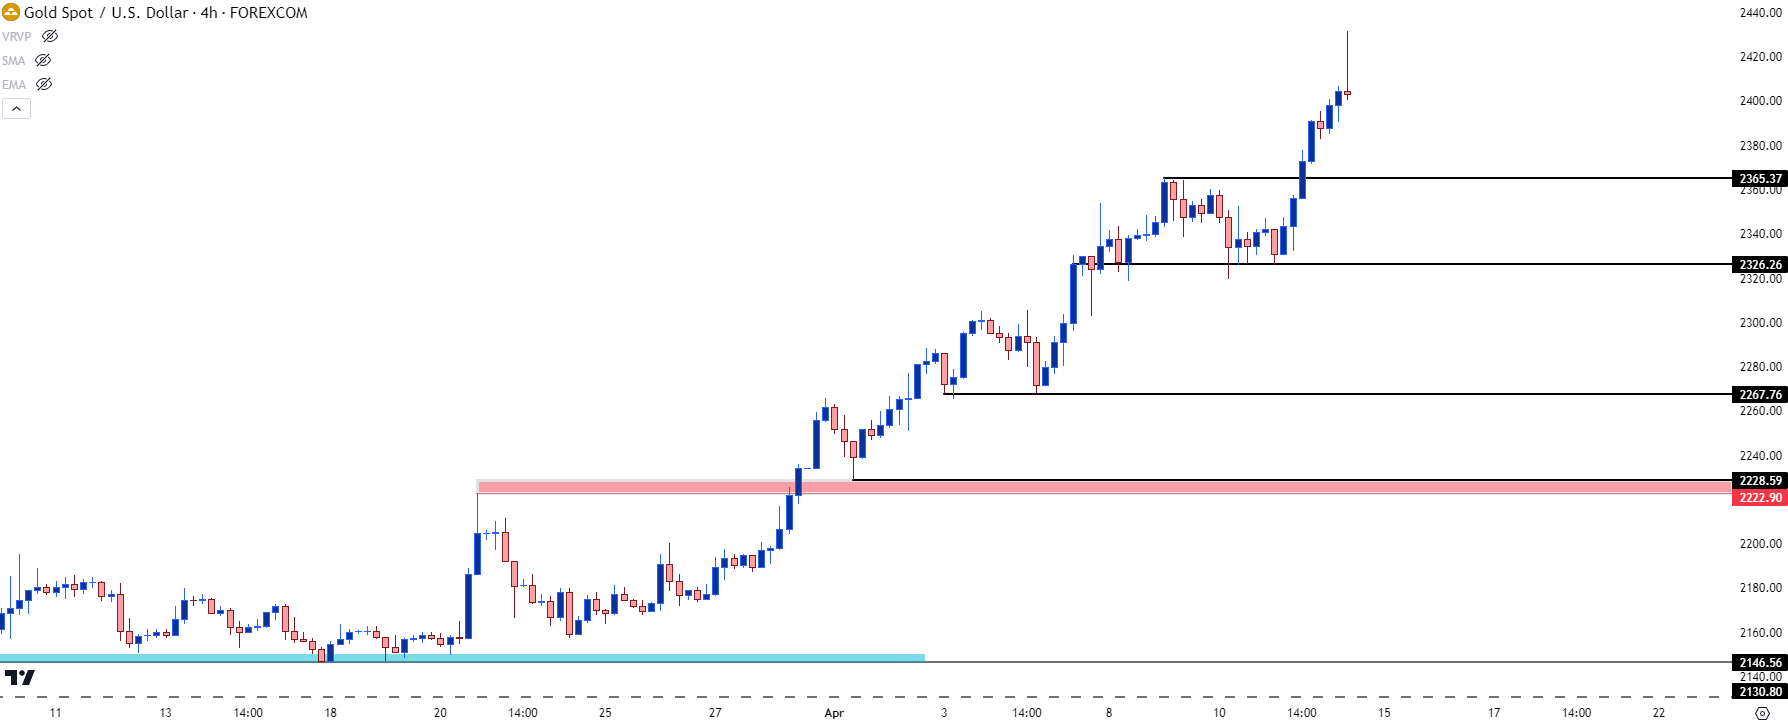 Chart prepared by James Stanley, Gold on Tradingview
--- written by James Stanley, Senior Strategist


