US Dollar Talking Points:
- The US Dollar continues to test the 105.00 level as support, which was prior resistance, following a fast sell-off last week after the FOMC rate decision.
- The longer-term range in the USD remains in-place, which begs the question as to whether bears will be able to fill that in despite the strength that’s shown thus far in 2024 trade.
- I’ll be discussing these themes in-depth in the weekly webinar. It’s free for all to register: Click here to register.
The US Dollar has moved back to the 105.00 level and, so far, that’s helped to hold support. There was penetration on Friday after the NFP report, but bulls brought it back above the big figure by the close of trading for the week, and so far, this week price has held a higher-low with bulls making a more notable appearance on Tuesday.
There is still lower-high resistance potential as taken from prior support, and that runs around the 105.38-105.50 area.
As far as drivers are concerned: There remains a plethora of Fed-speak on the calendar and that’s had a dovish lean of late, generally speaking; and the CPI release next Wednesday should be notable as that’s the next major piece of inflation data that markets will get a look at.
US Dollar Daily Price Chart
 Chart prepared by James Stanley; data derived from Tradingview
EUR/USD 200-DMA Test
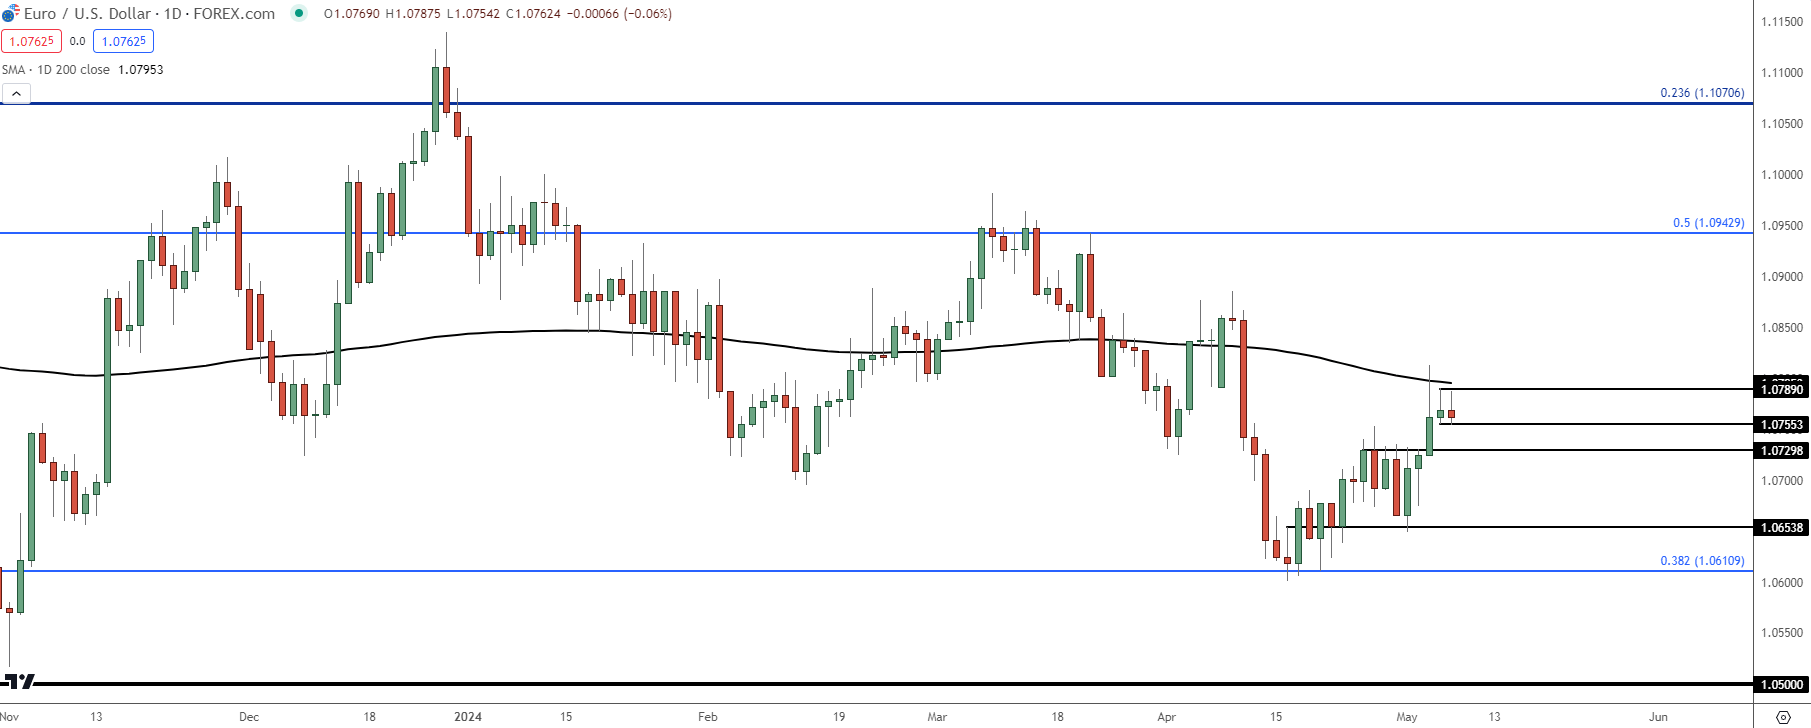
For those looking at a stronger support bounce in the USD, the below chart of EUR/USD will likely hold some interest. The pair re-tested the 200-day moving average as resistance on Friday after the NFP report, and that was the first re-test there since the breakdown in April on the back of CPI. So far, bears have been stalled and this week has seen a hold at lower-highs. But, on the other side, there’s still been a continuation of higher-lows since the Fibonacci level of 1.0611 was re-tested three weeks ago.
For next support, I’m tracking a spot of prior resistance at 1.0730 and below that, we have the prior swing-low of 1.0654.
EUR/USD Daily Price Chart
 Chart prepared by James Stanley, EUR/USD on Tradingview
GBP/USD
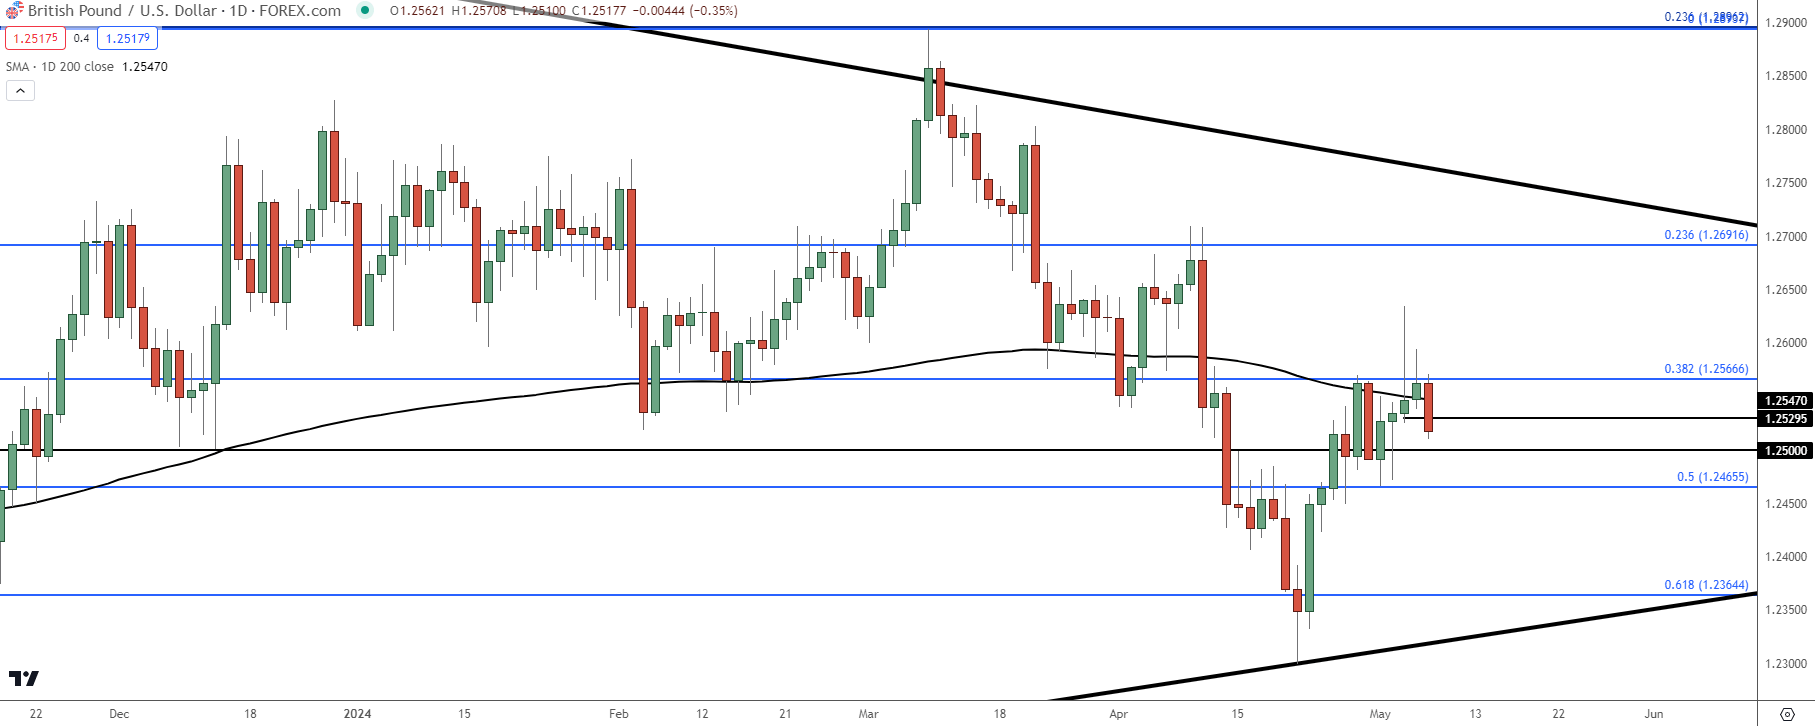
For USD-bears, GBP/USD could hold some interest. I had looked into this in the weekend forecasts with an eye also on GBP/JPY and EUR/GBP.
For GBP/USD, by simple comparison to the above in EUR/USD there’s been slightly more strength when graded against the 200-day moving average. Monday trade showed a daily close above that spot, although it couldn’t hold and price has since moved back. This puts focus on the 1.2500 psychological level for higher-low support potential, which would be above the prior swing-low of 1.2466.
GBP/USD Daily Price Chart
 Chart prepared by James Stanley, GBP/USD on Tradingview
USD/JPY
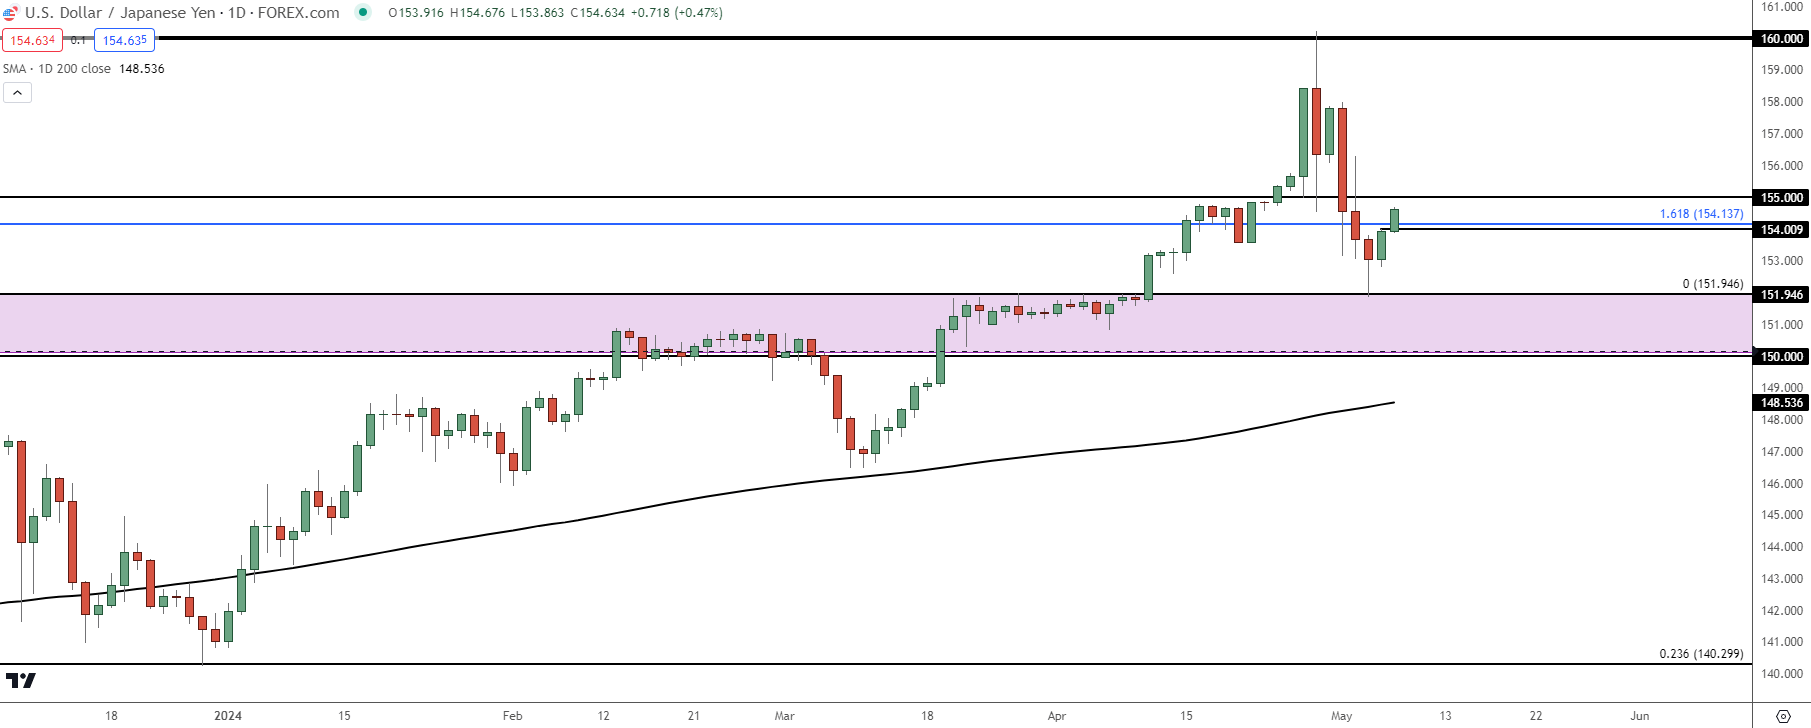
Last week saw a massive bearish outside bar print in USD/JPY; and normally those formations are an indication of a major shift in momentum. The challenge here though is that the driver of the move was largely exogenous, as the BoJ intervened at least once to temper the advance in the pair.
When the Friday NFP report hit, USD/JPY slid all the way down to the same 151.95 level that had set resistance twice over the past couple of years. That stopped the bleeding and since then, bulls have been on their way back with a procession of higher-highs and lows on shorter-term charts.
The challenge at this point is the prospect of additional intervention. There remains some question marks around the move on Wednesday after the FOMC rate decision with many making accusations of intervention, and there’s even some possible evidence in money market data. But there’s also been no confirmations of such from the Ministry of Finance and Janet Yellen raised some questions on the matter on Monday.
So, the big question is whether there’s another intervention-like move to show should price test above the 155.00 level. I had looked into this last Thursday with an eye on that 151.95 level for support; and now that the bounce is in, a hold at a lower-high like 155.00 could keep the door open for deeper pullback potential.
USD/JPY Daily Price Chart
 Chart prepared by James Stanley, USD/JPY on Tradingview
Gold (XAU/USD)
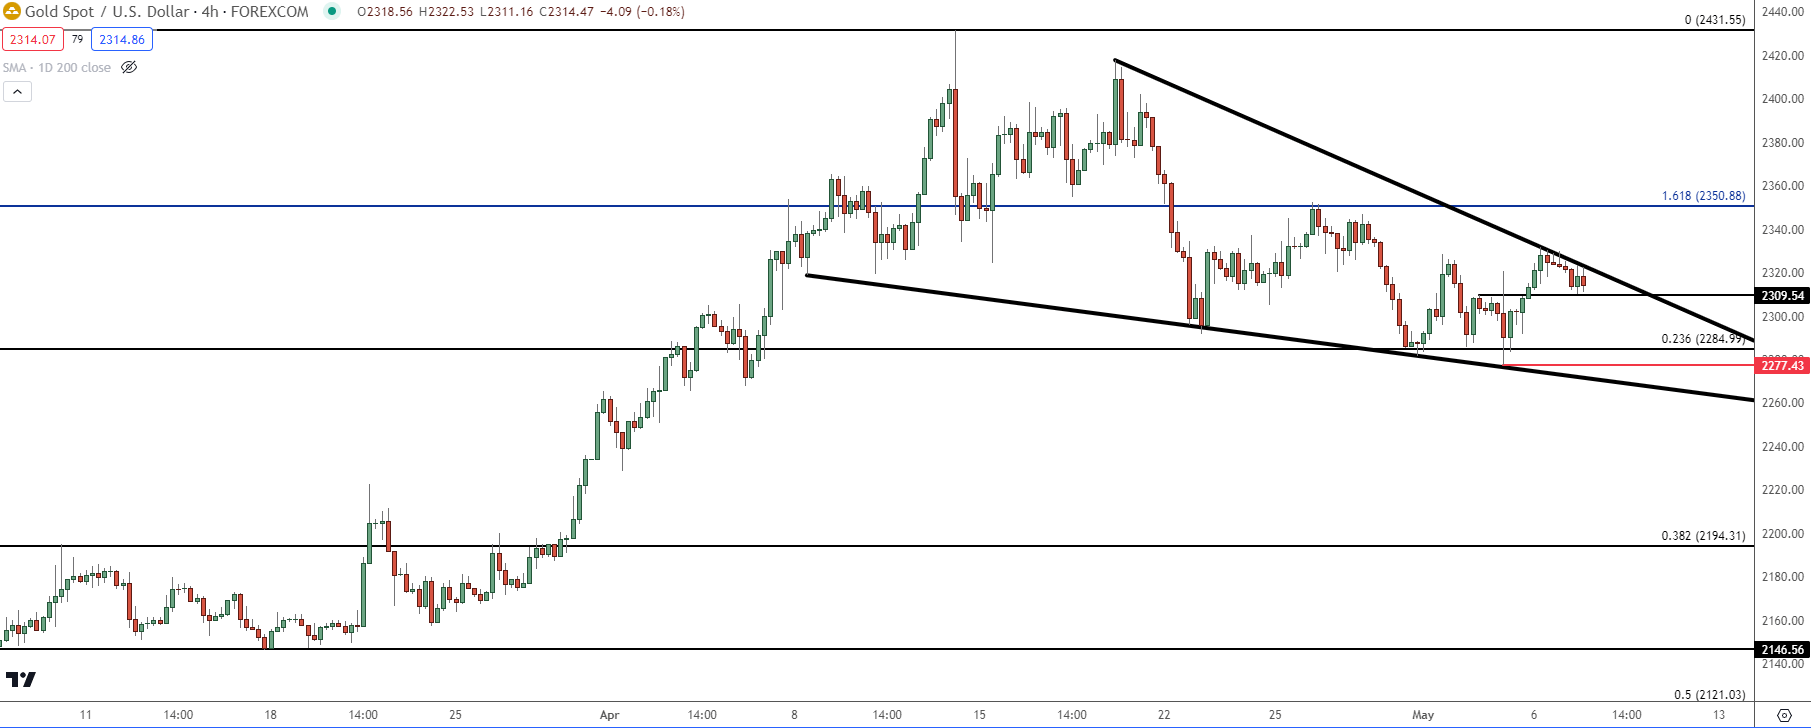
Gold has had ample opportunity to pose a deeper pullback after going into an extreme overbought position last month. But interestingly, bears haven’t been able to show much run at support which has built a falling wedge formation. Those are often approached with bullish aim, looking for breakout and in this case, it could even take on a similar role as a bull flag.
Key for this theme would be a continued hold of the 2300-2304 zone of support. There was a test there on Friday with a lower-low, but that led in to a strong ramp that continued through this week’s open.
For next resistance, the same 2350 level that’s been in-play remains of interest.
Gold Four-Hour Price Chart
 Chart prepared by James Stanley, Gold on Tradingview
--- written by James Stanley, Senior Strategist


