
US Dollar Talking Points:
- The US Dollar pulled back this week with a decisive push after the release of CPI data on Wednesday. That CPI print showed Core CPI at its lowest in three years, and this propelled DXY all the way down to the 200-day moving average for a support test.
- The USD bounced on Thursday and continued the move through early-Friday trade. The big question now is whether EUR/USD can onboard more strength which could further contribute to declines in the USD.
- I’ll be discussing these themes in-depth in the weekly webinar. It’s free for all to register: Click here to register.
US CPI was the big item from this week and the Wednesday release prodded several themes across global markets. US equities broke out to fresh highs on the back of that print, and the US Dollar broke down to fresh monthly lows, eventually finding support around the 200-day moving average which led to a bounce on Thursday. The move in the Dollar contributed to a very strong breakout in Gold and a number of major FX pairs pushed up to test fresh highs.
The month of May has so far been an encouraging one for the FOMC. It was the first day of the month that the Fed retained a relatively-dovish lean, even despite the continued strength seen in the US economy in early-2024. And then two days after the Fed meeting, we saw the first NFP headline miss since November of last year, further hitting the USD and pushing stocks higher. And then the Wednesday CPI release showed Core CPI printing in-line but at its lowest level since the release in May of 2021 at 3.6%.
Collectively this helps to keep rate cuts in the conversation for this year and the moves across markets seemed to reflect that.
But – as we’ve looked at in the past, the US Dollar is a composite, so for USD price action the key is whether we can see continued strength in constituents of the index. The Euro is a heavy allocation of 57.6% so continued Euro strength will likely be a necessary component if the USD is to continue its downward trend. The Yen also plays a large role, at 13.6%, and as I looked at earlier in the week, that can play a large factor; as USD/JPY longs fearful of a larger reversal in the USD could be compelled to close positions, which could lead to greater Yen-strength and, in-turn, USD weakness.
From the US Dollar’s weekly chart, the range that started in early-2023 remains in-play. And like I had looked at last week, there could remain bullish scope as price has so far held above the prior higher-low at 103.92. Bears had an open door to push a deeper breakdown after CPI but, instead, bulls showed up to defend the 200-day moving average.
US Dollar Weekly Price Chart
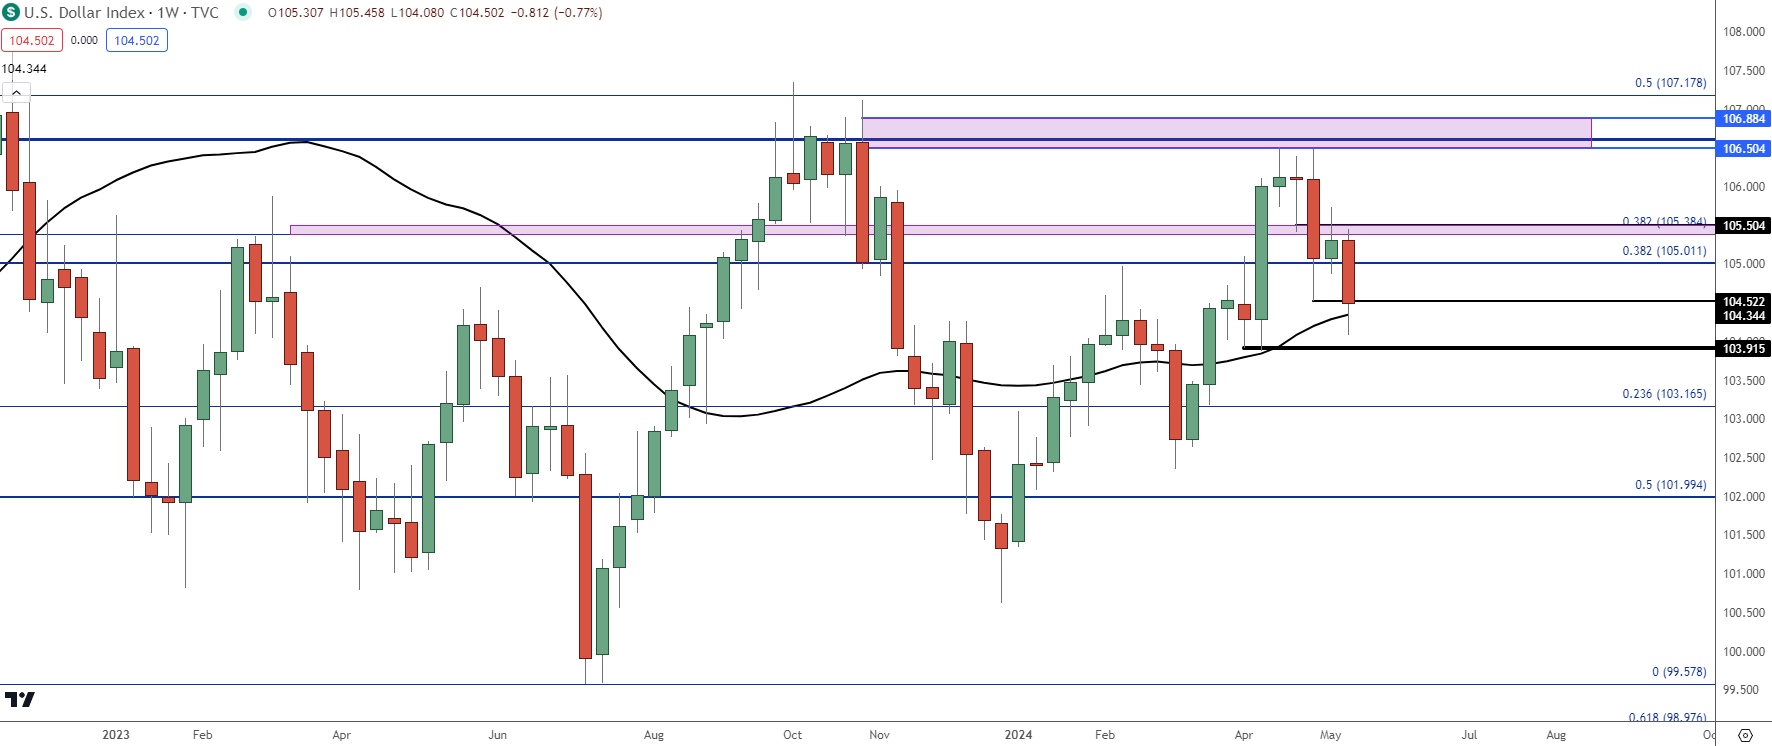 Chart prepared by James Stanley; data derived from Tradingview
From the daily chart below, near-term structure remains bearish as there’s been that pattern of lower-lows and highs, so this puts emphasis on a few different spots for early next week.
The prior higher-low of 103.92 was what led into the breakout to 106.50, so that’s what would need to remain defended to keep the door open for bullish near-term scenarios. Above that, this week’s low currently shows at 104.08 and then the 200-day moving average plots just above that at 104.35.
Sitting overhead is a large spot of possible resistance and that’s already played a role this year in multiple ways: The 105.00 level held two different resistance inflections before coming back as support after the NFP report earlier in the month. This was finally taken out on a daily close basis on Wednesday, after the CPI report, and if bulls can muster a push up to that level, it becomes potential resistance and likely a major test on the chart.
If buyers can power through that, then there’s another zone of interest that was resistance this week before the breakdown, and that spans between 105.38 and 105.50.
US Dollar Daily Price Chart
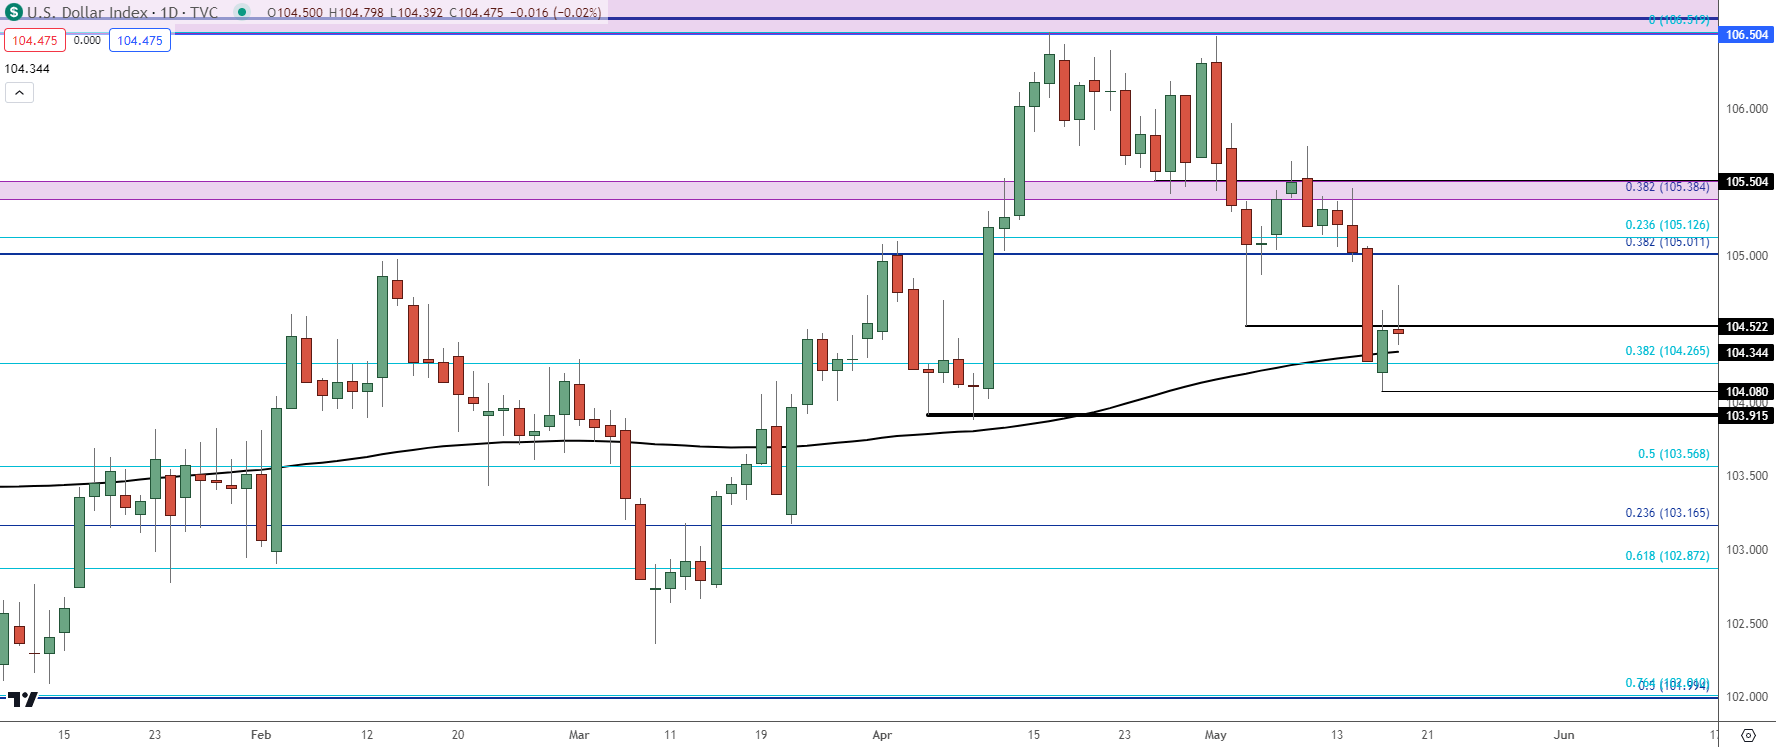 Chart prepared by James Stanley; data derived from Tradingview
EUR/USD
EUR/USD is working on its fifth consecutive weekly gain, and ever since the Fibonacci level at 1.0611 came into play in mid-April, bears have been stopped in their tracks.
The notable item in the pair for this week has been a bullish breakout of the 200-day moving average. That had held the highs on NFP Friday and that led into a cautious week last week, but there was a hold of support at prior resistance of 1.0725 that kept bulls in the driver’s seat and they continued that move with a strong push after the release of US CPI.
At this point EUR/USD is showing resistance at the same spot that I had highlighted on Tuesday, from 1.0870-1.0877. That had led to a pullback on Wednesday and Thursday but bulls again returned to hold higher-low support at prior resistance, this time at 1.0835. That illustrates buyers retaining control of the near-term trend and this keeps the door open for a re-test of the same zone that held the highs in March, plotted around 1.0943.
That’s a key price as it’s the 50% retracement of the same Fibonacci study from which 1.0611 derives (the 38.2% Fibonacci retracement).
EUR/USD Daily Price Chart
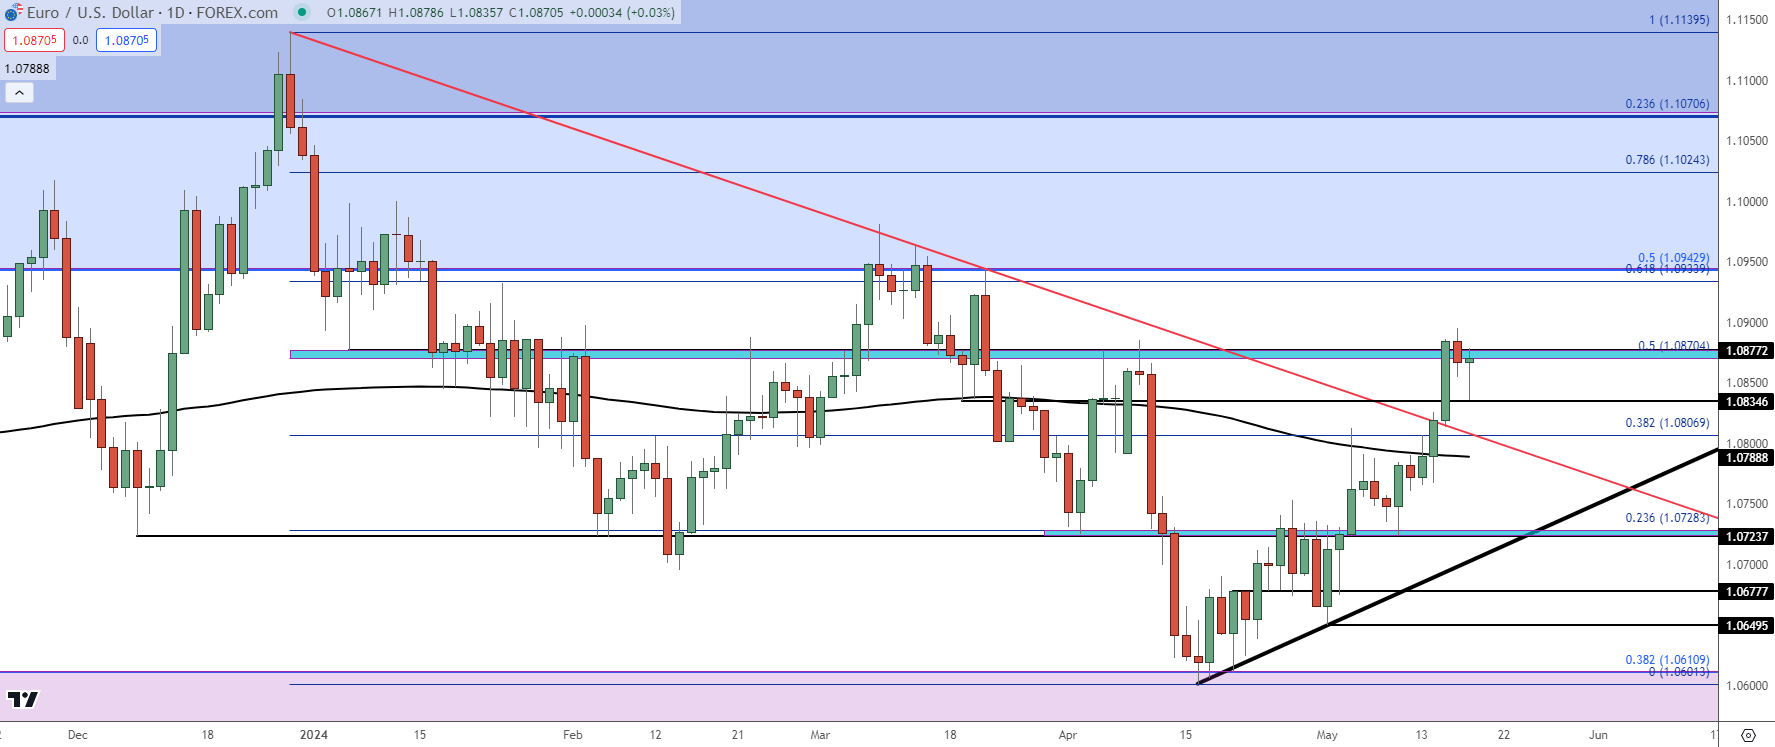 Chart prepared by James Stanley, EUR/USD on Tradingview
GBP/USD Fresh Monthly Highs
GBP/USD has been on a strong run since last Thursday’s Bank of England rate decision. The BoE meeting itself helped to prod a pullback, but the USD weakness that showed up after jobless claims that morning seemed to take over.
That left a hammer formation on the daily chart and that led into a strong run, with hastening around the release of US CPI. At this point, GBP/USD is testing above a key resistance level of 1.2692 while holding the highs at a prior swing of 1.2708.
In the Tuesday webinar, I shared my opinion that I thought GBP/USD could be one of the more attractive majors markets for scenarios of continued USD-weakness, and so far that’s continued to play out. The next spot of resistance that I’m tracking overhead is the 1.2750 Fibonacci level, after which a major spot shows just inside of the 1.2900 level.
GBP/USD Daily Price Chart
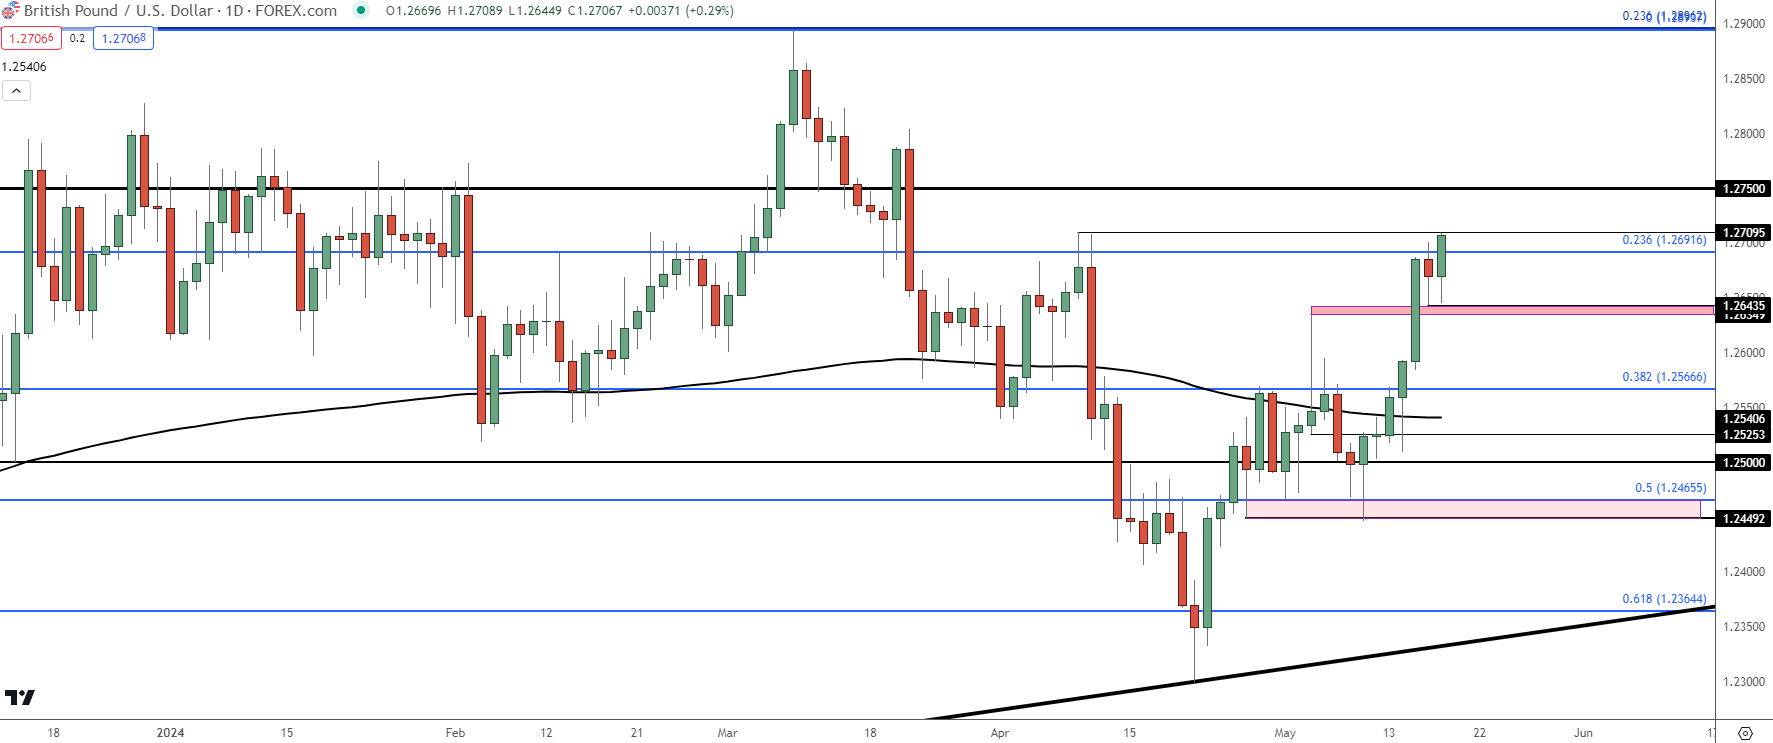 Chart prepared by James Stanley, GBP/USD on Tradingview
USD/JPY
I had written about USD/JPY a couple of times this week, and as I shared in the Tuesday webinar, I’m of the mind that USD/JPY will continue to act as an amplified version of the US Dollar.
If USD strength shows up, then the carry on the long side of USD/JPY remains as attractive. But, if there’s larger fear of a deeper USD-bearish move, then the carry trades that have driven the long side of the pair for much of the past year can soon become fearful of principal losses, and that can lead to fast declines.
We saw both of those moods this week. Around the CPI print, USD/JPY pulled back aggressively before finding support and rallying on Thursday as the USD found its footing.
From the daily chart of USD/JPY, directional scenarios can prove challenging as we’ve had both a recent lower-high and a recent higher-low. If the US Dollar does continue its decline, there’s a major spot of possible support from the 150-152 zone, with 151.57 and 150.88 as pertinent levels. And on the upside, there remains resistance potential at swings of 156.29 and 156.90 before 158 and 158.45 come back into the picture.
USD/JPY Daily Price Chart
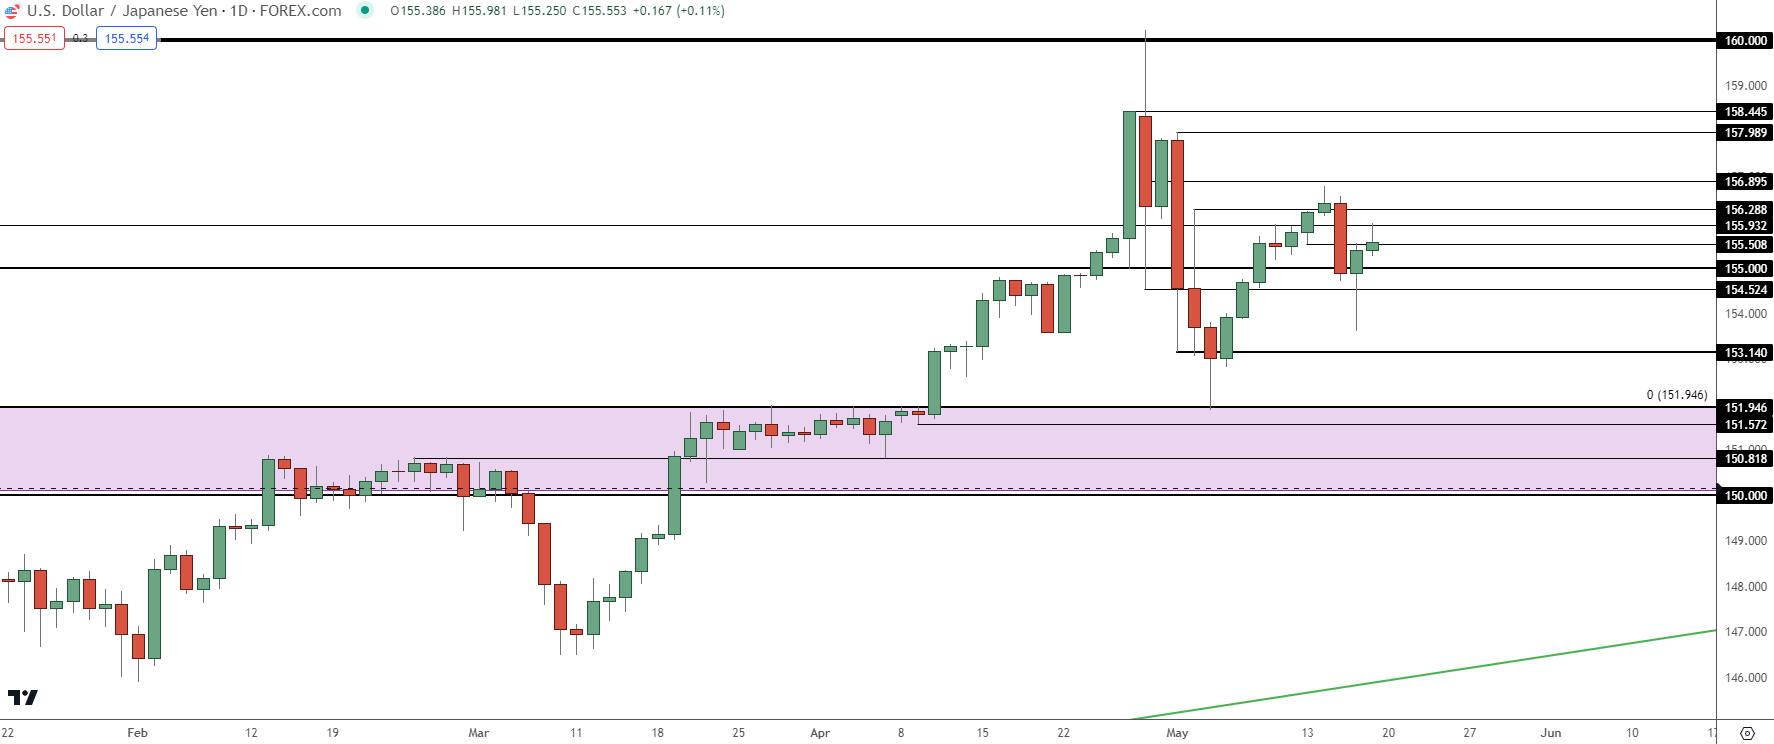 Chart prepared by James Stanley, USD/JPY on Tradingview
Gold
It’s been a big week for Gold, and that continues the move from the falling wedge breakout last week. I had written the weekly forecast on Gold, and then I followed up with an update on Thursday.
Friday has, so far, been especially bullish as buyers continued the incline for another test of the $2400 level. To date, spot XAU/USD has not had a weekly close above that psychological level and the fact that buyers remained so aggressive, disallowing any weekly closes below the $2300 level, hinted that the bearish move in late-April was more of a correction in a bullish trend rather than a full-fledged reversal.
Gold Weekly Price Chart
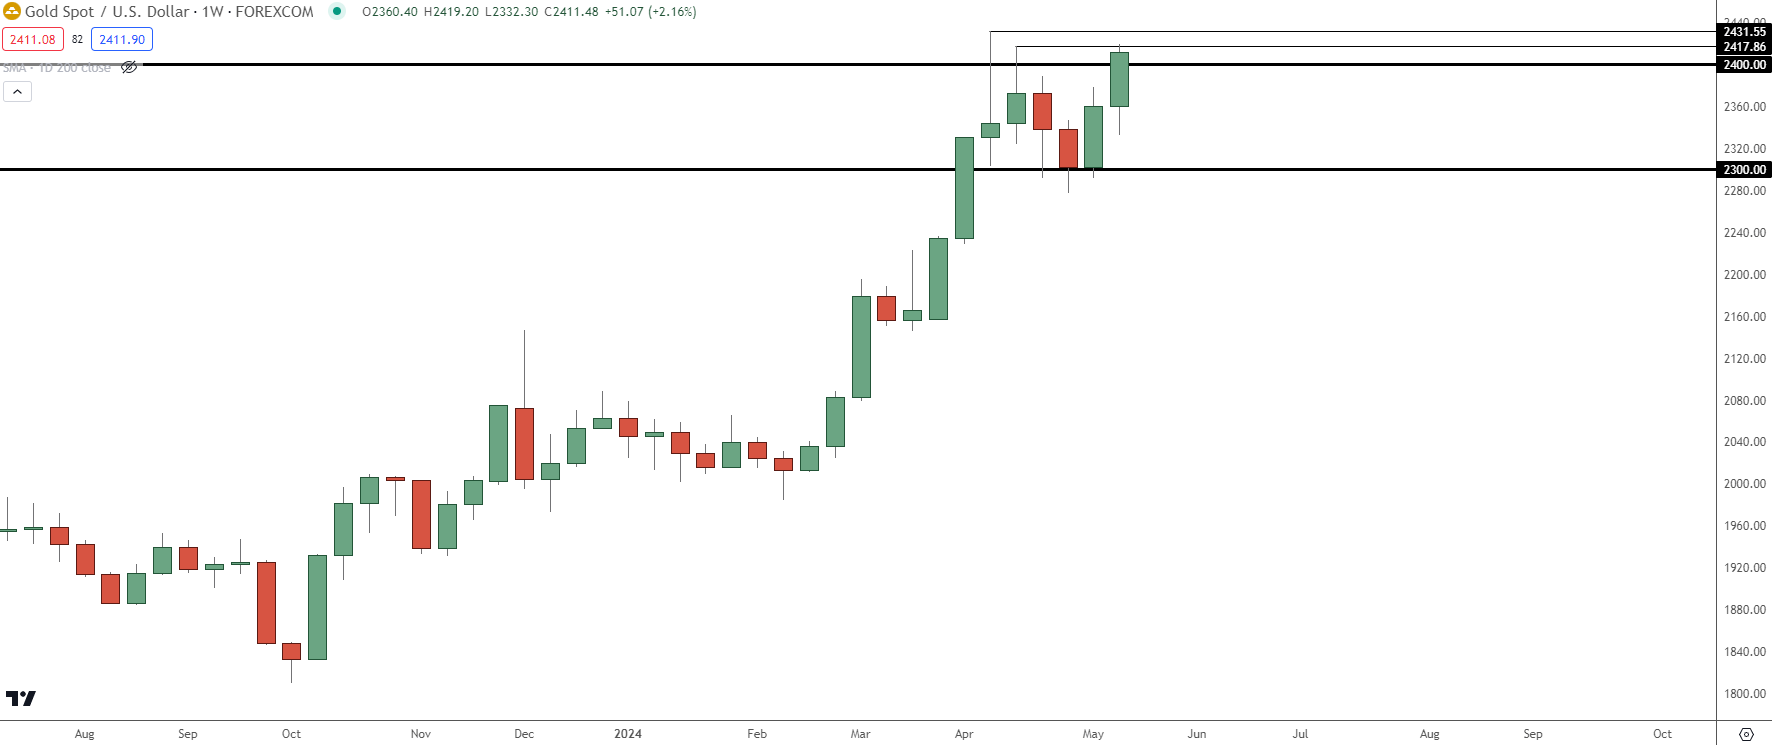 Chart prepared by James Stanley, Gold on Tradingview
Gold Shorter-Term
Gold bulls took a big step this week with the way that they controlled the trend. There was clean two-side action and through the week, bulls stepped in at progressively higher-lows as shown by the Fibonacci retracement drawn on the pullback.
This led to support holds at 2336 on Monday and Tuesday, 2354 on Wednesday, 2372 on Thursday, leading into the $2400 breakout on Friday. At this point, there’s support potential around the 76.4% retracement of that same major move which plots very near the $2400 psychological level.
Gold (XAU/USD) Four-Hour Price Chart
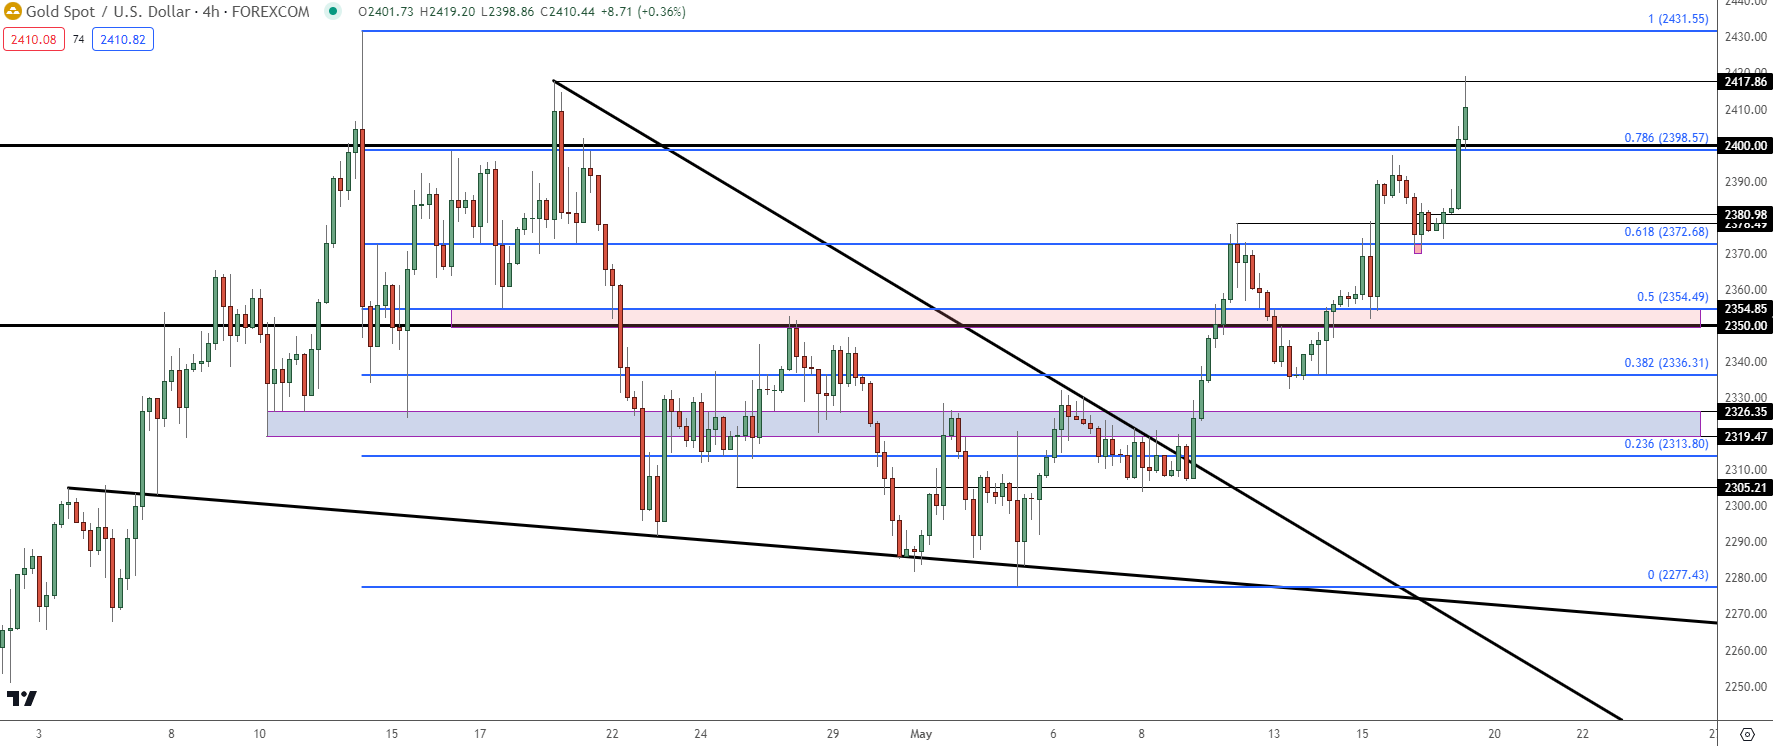 Chart prepared by James Stanley, Gold on Tradingview
--- written by James Stanley, Senior Strategist


