
US Dollar Talking Points:
- The US Dollar is re-testing the 105.00 level in DXY ahead of tomorrow’s CPI report.
- The inflation report due out tomorrow could have wide-ranging consequence for markets. The Fed has remained relatively dovish despite continued strength in data so far this year, and as a case in point, Core CPI has either meet or beat the expectation going back to last December’s release. If tomorrow’s CPI report comes out below expectations, that could give a fast rise to hope for near-term rate cuts, while another beat could further draw that cutting scenario expected later this year into question.
- Equities remain in focus ahead of that inflation print, and stocks have come roaring back in the past couple of weeks since the FOMC rate decision. I had discussed this in the Q2 Forecast for equities, which you can access in full from the following link: Q2 Forecasts
The US Dollar is back to testing the 105.00 level in DXY and this comes after a lower-high held last week at 105.73. That swing high printed on Thursday and it was jobless claims data that helped to push the move, giving USD-bears another shot in the arm after the one-two punch of FOMC and NFP from the week before.
With USD now re-testing the 105.00 level, which it had previously broken-through on the back of a CPI print last month, the focus now moves to another CPI print set for release tomorrow. The expectation is for Core CPI to have fallen to 3.6%, which if it happens, would be the lowest reading since the release in May of 2021.
Of late, Core CPI seems to have flattened out and given that this is almost twice the Fed’s target of 2%, it’s naturally brought questions to the Fed’s rate cut plans for this year.
US Core CPI YoY – Releases since Jan, 2021
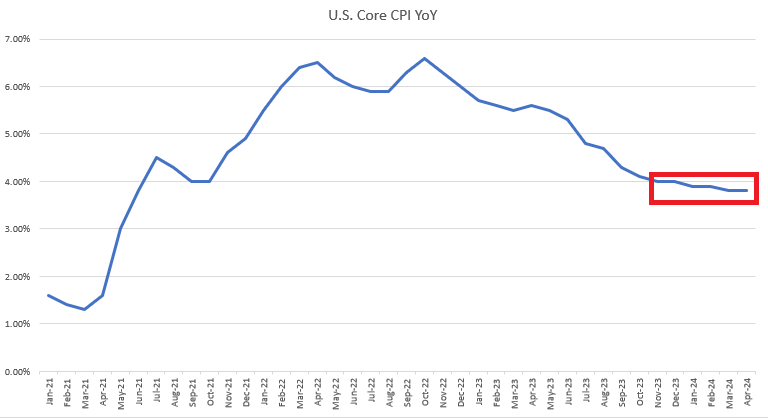
Chart prepared by James Stanley
USD Levels
Below current price is a confluent zone of support. The 200-day moving average plots very near a Fibonacci retracement at 104.27, which is also near the projected move from the double top formation.
There could even be a bullish case to be drawn around the USD if that zone comes into play, based on the hold above the prior higher-low around the 103.92 level, which held two tests ahead of the CPI report released last month.
Above current price action, the 105.38-105.50 zone remains of interest, with a prior swing at 105.71 above that. And then there’s the 106.50-106.88 zone that remains as unfilled gap from the November FOMC rate decision.
US Dollar Daily Price Chart
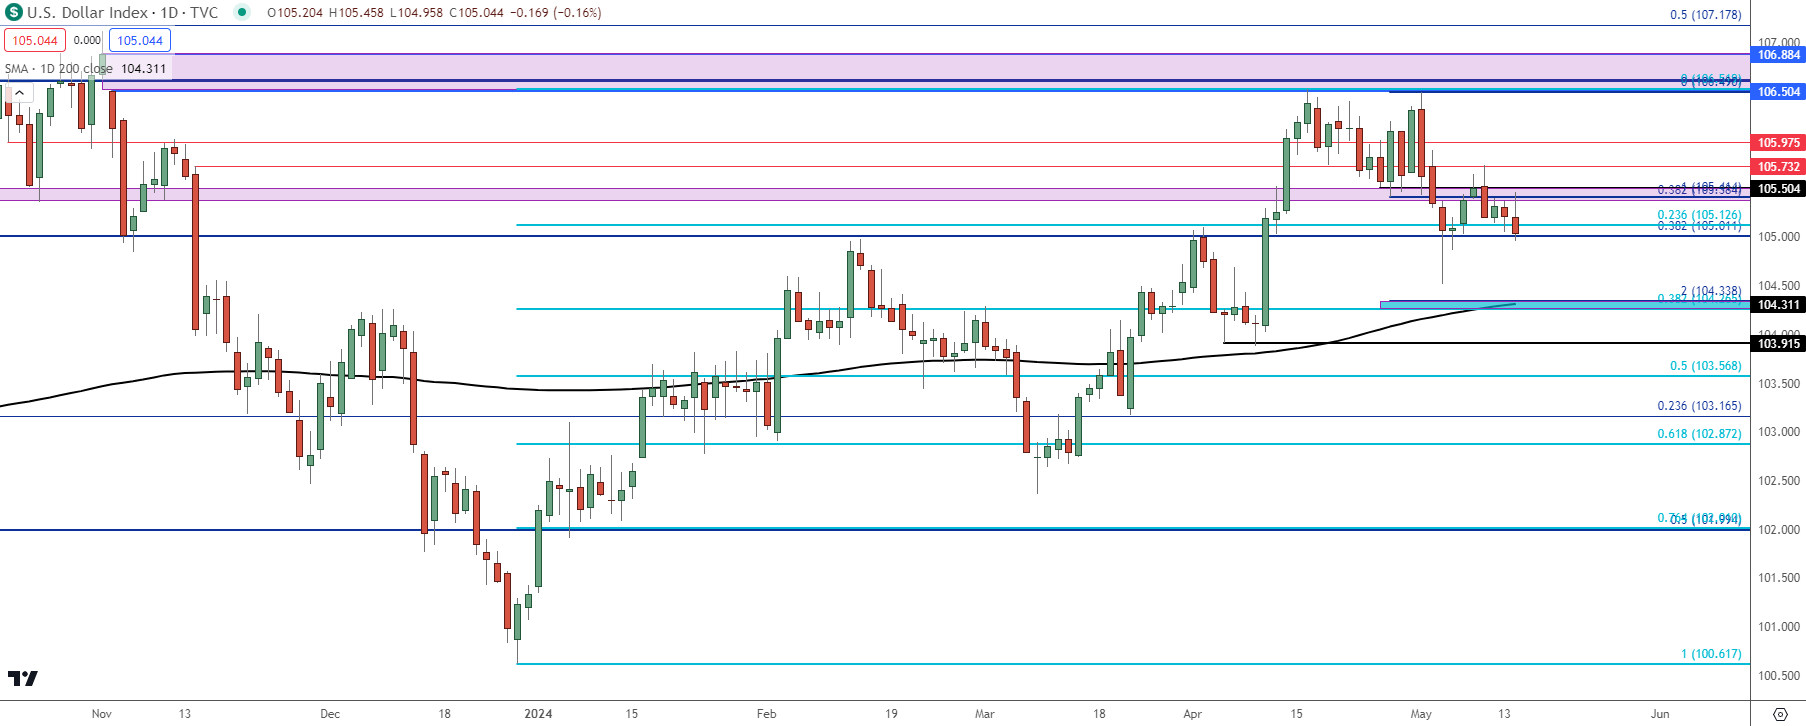 Chart prepared by James Stanley; data derived from Tradingview
EUR/USD
While the USD is sitting above a large spot of confluent support, EUR/USD is already battling a large spot of confluent resistance.
The pair is currently vying for its first daily close above the 200-dma since the breakdown last month. So far, that moving average has held resistance since the NFP release a couple of weeks ago. But, also of interest is a bearish trendline that I had discussed on the webinar, along with a Fibonacci retracement level at 1.0807.
For next resistance, I’m tracking a zone from 1.0870 up to 1.0877, and for next support, a spot from 1.0724-1.0728.
EUR/USD Daily Price Chart
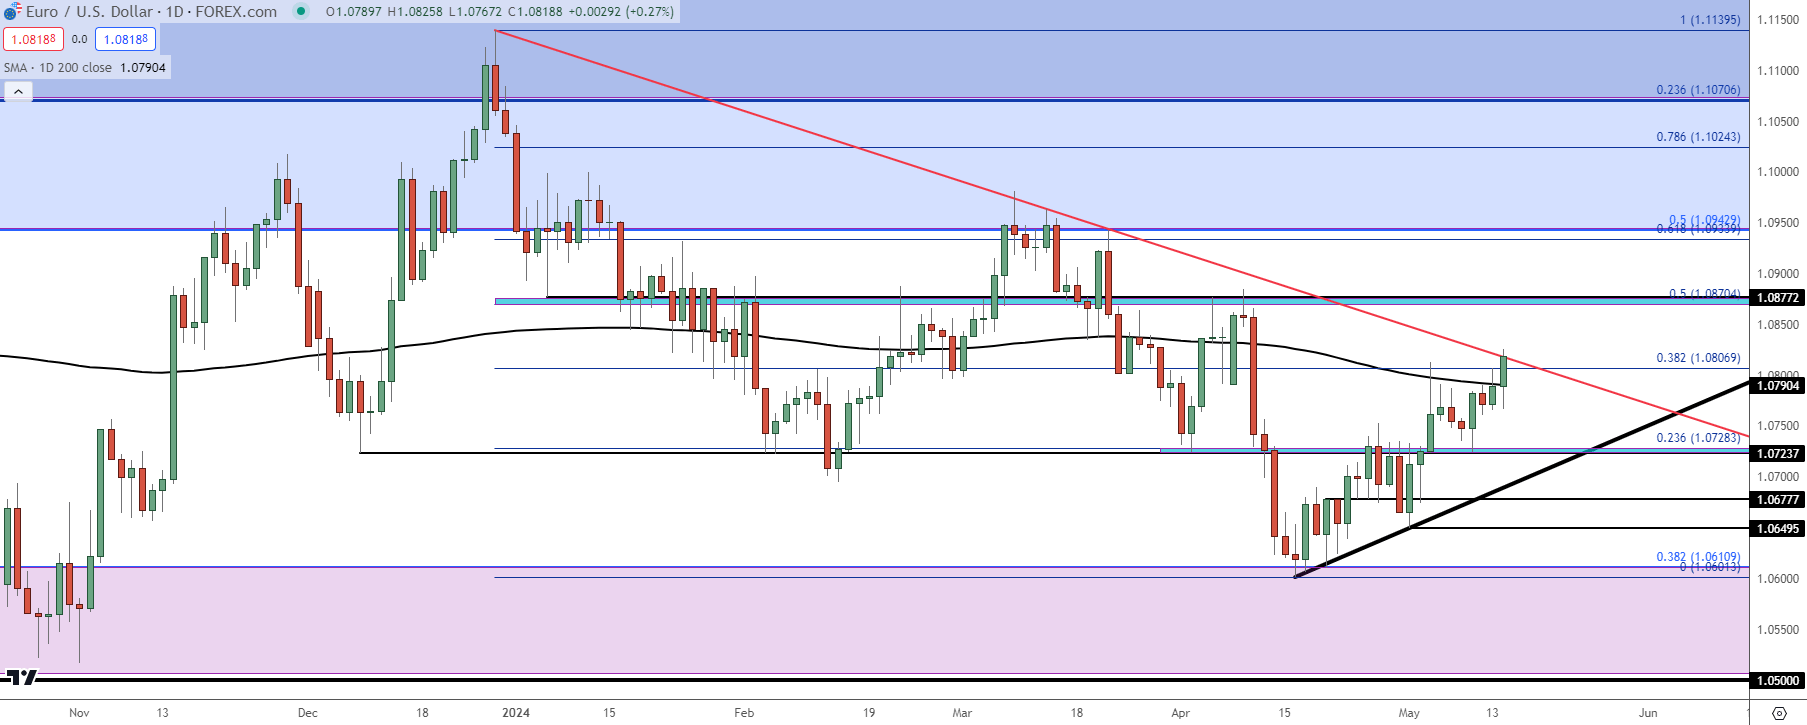 Chart prepared by James Stanley, EUR/USD on Tradingview
GBP/USD
GBP/USD remains of interest for USD-weakness scenarios. There’s a fundamental argument for that given the U.K.’s core inflation read remaining above that of the U.S., but there’s also a technical area of interest given the reaction to BoE last week. That Thursday bar printed as a hammer even with the Bank of England sounding somewhat dovish, and as USD pullbacks have printed since, so has a continued bounce in GBP/USD.
I had said last week that GBP/USD was one of my areas of interest for USD-weakness scenarios and that remains the fact this week as we near the CPI release tomorrow. From the daily chart below, we can see where Cable has already shown a daily close above the 200-dma which we can’t quite say for EUR/USD.
The next spot of resistance overhead is the Fibonacci level at 1.2692, and for support, I’m tracking the same zone that caught the lows last week from 1.2450-1.2466.
GBP/USD Daily Price Chart
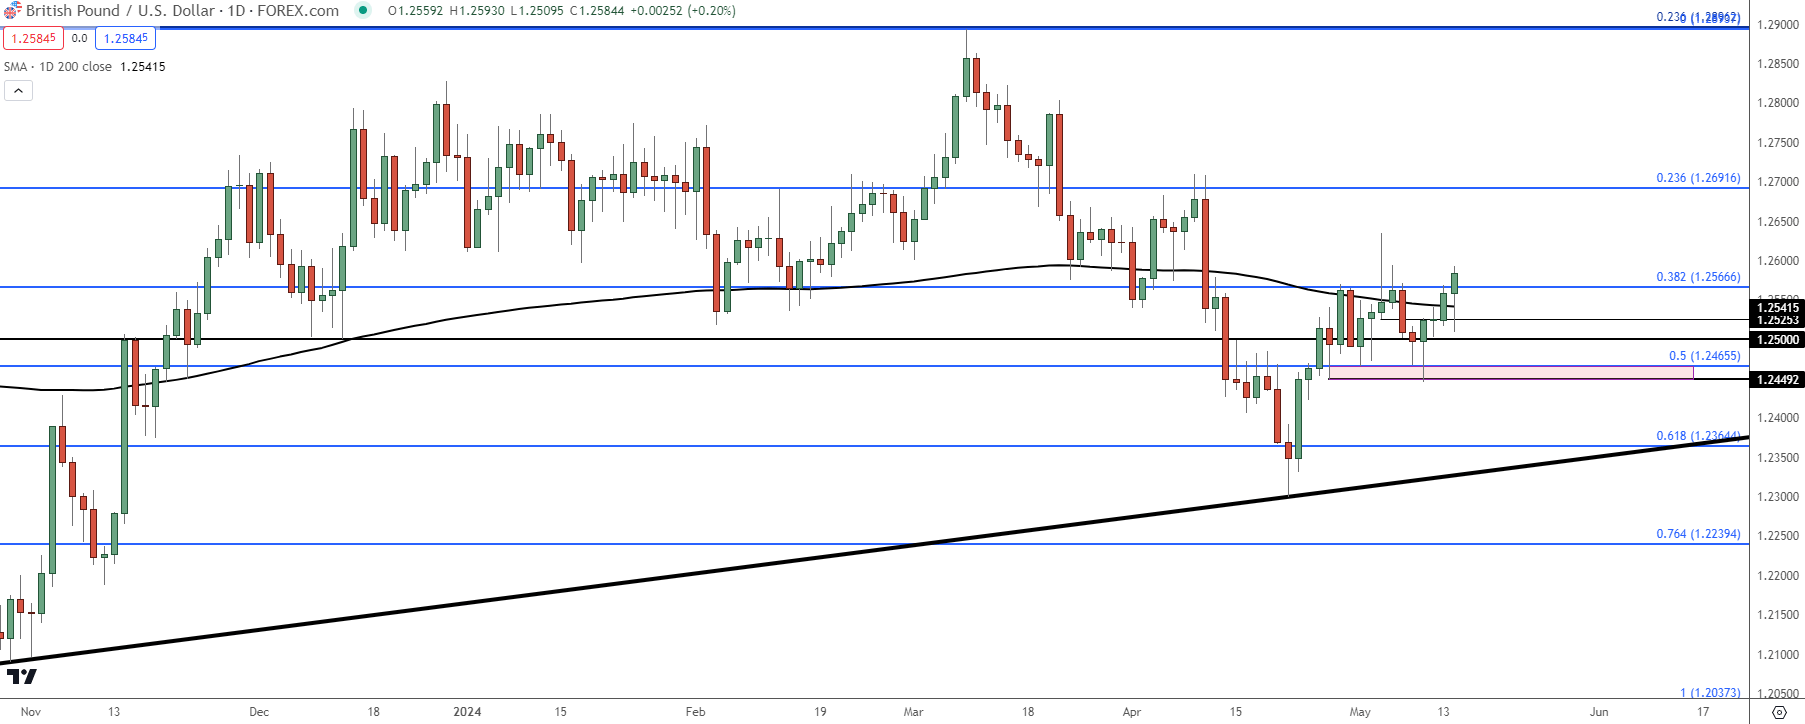 Chart prepared by James Stanley, GBP/USD on Tradingview
USD/JPY
USD/JPY may be one of the more interesting pairs for scenarios of USD-weakness tomorrow.
While the bank intervened to defend the 160.00 level, what really seemed to frighten bulls over the past two years were broad-based USD sell-offs. And given that this is a carry-driven trend, there’s likely a heavy imbalance of longs, and disruption could lead to hastened volatility.
The 152.00 level held two different resistance inflections in 2022 and 2023 and in both cases, what ultimately drove the reversal was a falling USD, pushed along by lower-than-expected CPI prints. In 2022, that CPI print was on November 10th and in 2023 it was on November 14th.
So, if CPI comes out below expectations tomorrow that could, possibly give the BoJ some element of respite. But, at this point, USD/JPY remains bullish as taken from the continued build of higher-highs and higher-lows.
USD/JPY Four-Hour Price Chart
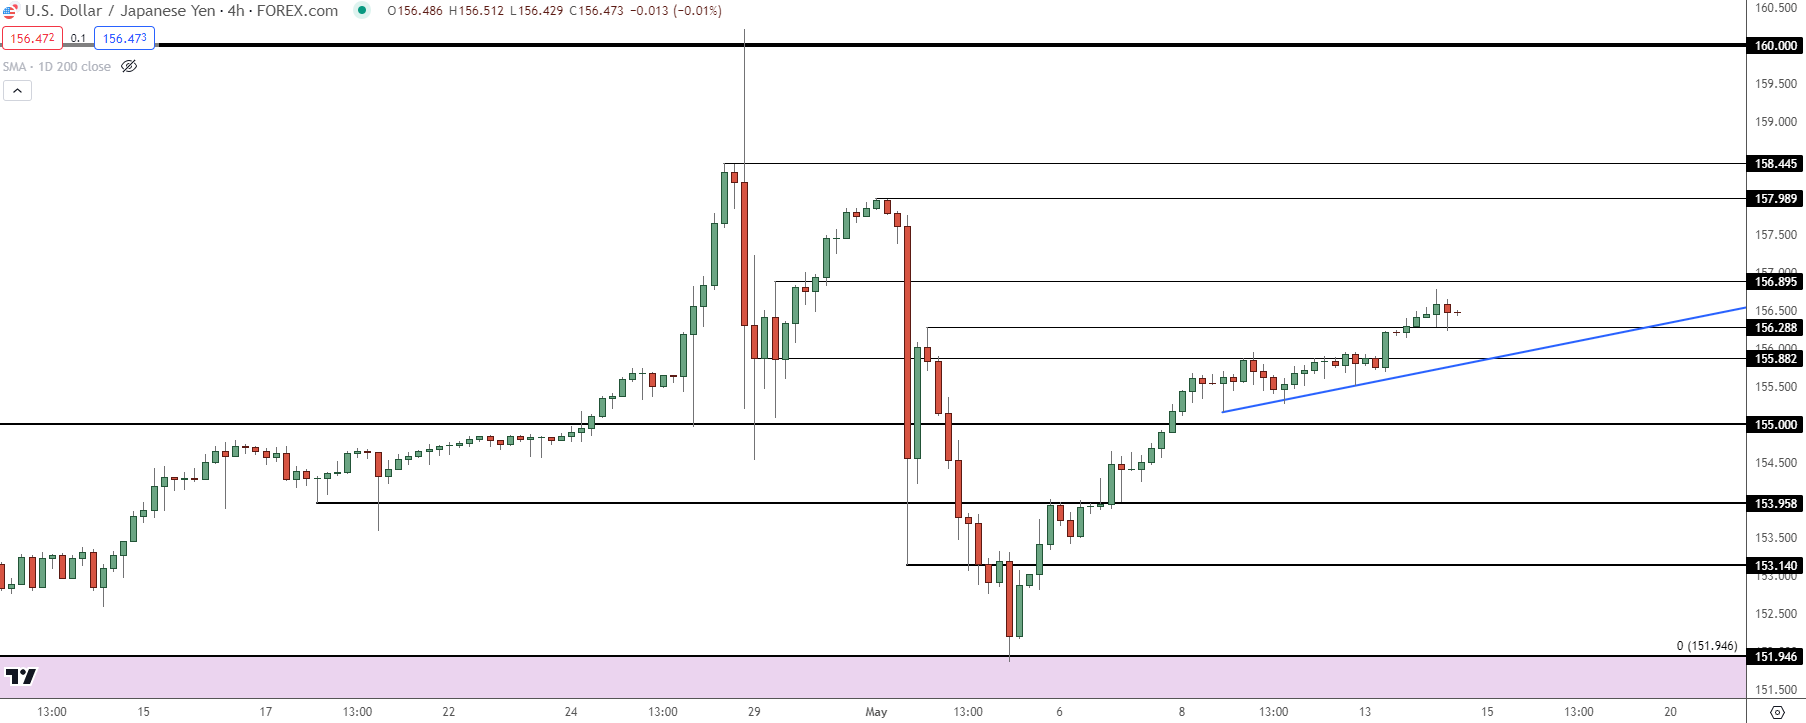 Chart prepared by James Stanley, USD/JPY on Tradingview
Gold (XAU/USD)
There were a couple of formations of note that I had discussed in the webinar, and the Fibonacci retracement produced by the April-May pullback has a number of interesting elements.
First and foremost is the falling wedge that yielded to breakout last week. I talked about that at-length in the weekend forecasts. The breakout from that formation found resistance at the 61.8% retracement of the pullback which held the highs on Friday. And the sell-off from that resistance eventually found support at the 38.2% retracement of that same major move at 2336.
That then led to a bounce up to the 50% marker at 2354, at which point a bullish channel could be drawn that could be construed as a bear flag formation, with a shorter-term look.
If that bear flag formation does fill, it doesn’t necessarily eliminate the bigger-picture bullish proposition, as the next support down at 2319-2326 held resistance for quite a while, and a hold there could keep the door open for bulls to take another shot at 2350.
Gold (XAU/USD) Four-Hour Price Chart
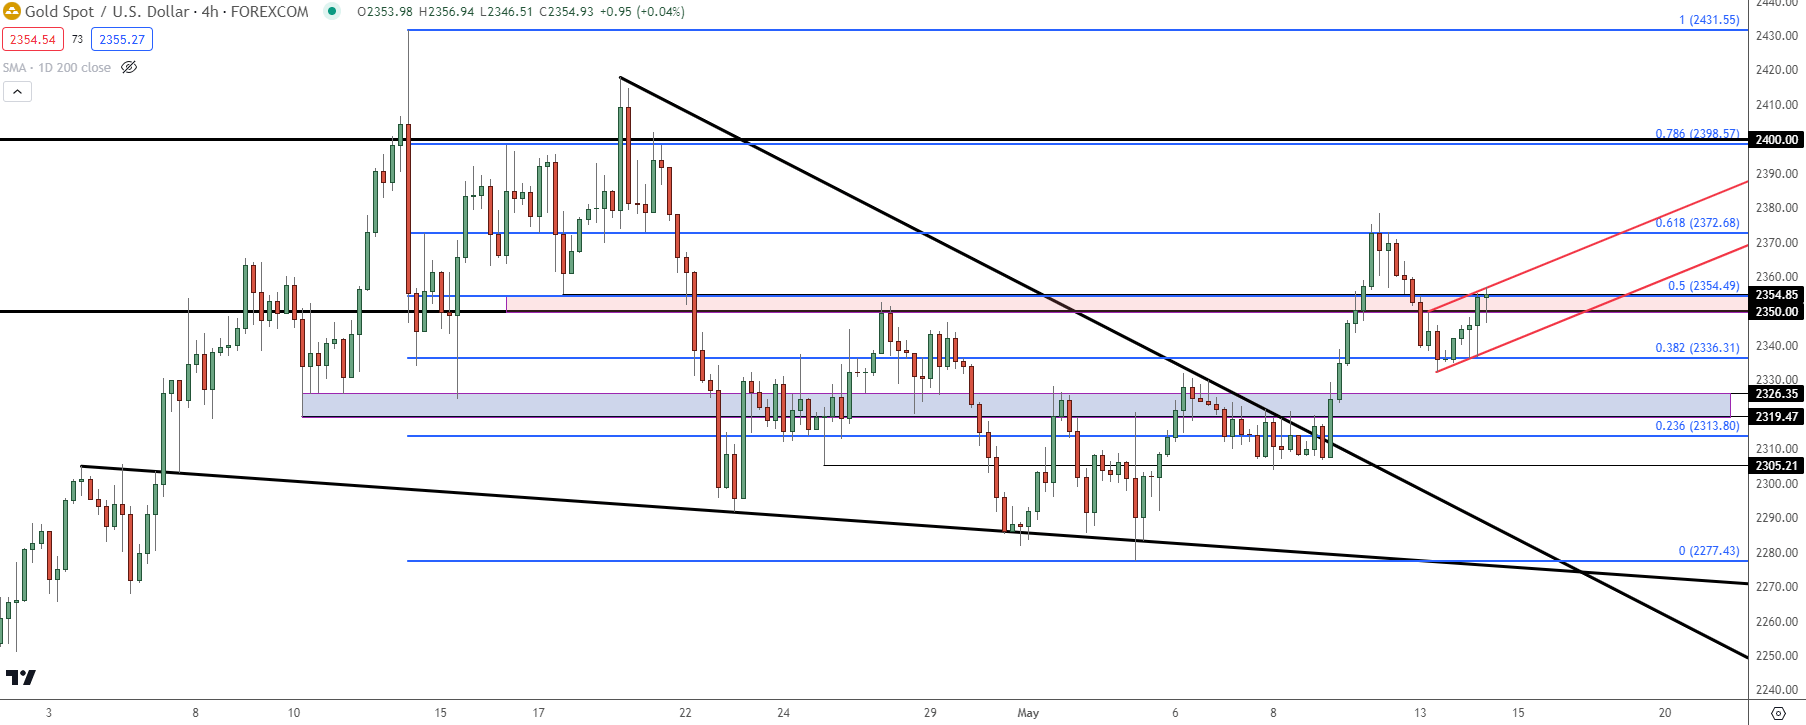 Chart prepared by James Stanley, Gold on Tradingview
--- written by James Stanley, Senior Strategist


