
US Dollar Talking Points:
- It’s been a calmer week in the USD than what had showed the week before as the currency was pushed-lower by FOMC and then Non-Farm Payrolls. For next week, we get the next installment for US CPI on Wednesday and that will likely be the key driver along with Fed-speak.
- The USD held the 105.00 handle so far this week which is a major spot. There was penetration below that price on NFP Friday but bulls brought it back ahead of the weekly close. After a quick test on Monday, buyers held above that level and this keeps the door open for a continued bounce in the early part of next week, in anticipation of that CPI report on Wednesday.
- I’ll be discussing these themes in-depth in the weekly webinar. It’s free for all to register: Click here to register.
It was a strong weak for the stock market as equities continued their incline from the week before, after the Fed sounded dovish and NFP printed below-expectations. The US Dollar has so far shown a gain on the week but it’s moderate and likely a symptom of the 105.00 support level that was in-play on Monday.
The big focus for next week is the US CPI report set for release on Wednesday, and like NFP, Core CPI has been all meets or beats since the release in November and that’s brought question to the Fed’s rate cutting plans. The Fed has been persistent however, even considering positive economic data, and the Fed’s continued dovishness at least week’s rate decision is at least part of the driver of this week’s equity strength. So if we do get slower data out of the US, the themes of equity strength and USD weakness could gain more motivation.
But, if that CPI report comes out hot again, at 3.8% or higher, then there could be some quick re-pricing that could drive strength in the Greenback and a pullback in equities.
US Core CPI Since January 2021: Entrenchment Since November
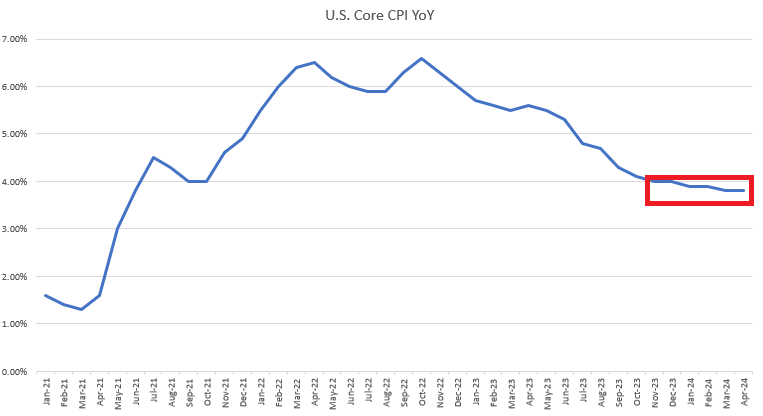
Chart prepared by James Stanley
US Dollar
The US Dollar showed a strong pullback after FOMC and that continued through the NFP report a couple days later. This week was about stabilization around the 105.00 level which, so far, has held after a test on Monday. Notably, the USD has not yet put in a re-test of the 200-day moving average which sits below around a confluent spot of support that plots around 104.27, with the prior April swing low showing at 103.91.
Sitting atop price, it’s the 106.50 level that looms large as that’s held two separate resistance inflections so far, like the 105 handle had previously. Above that is unfilled gap from the November FOMC rate decision and that runs up to 106.88, which would be a realistic level to test in the scenario of a hot CPI report next week.
US Dollar Daily Price Chart
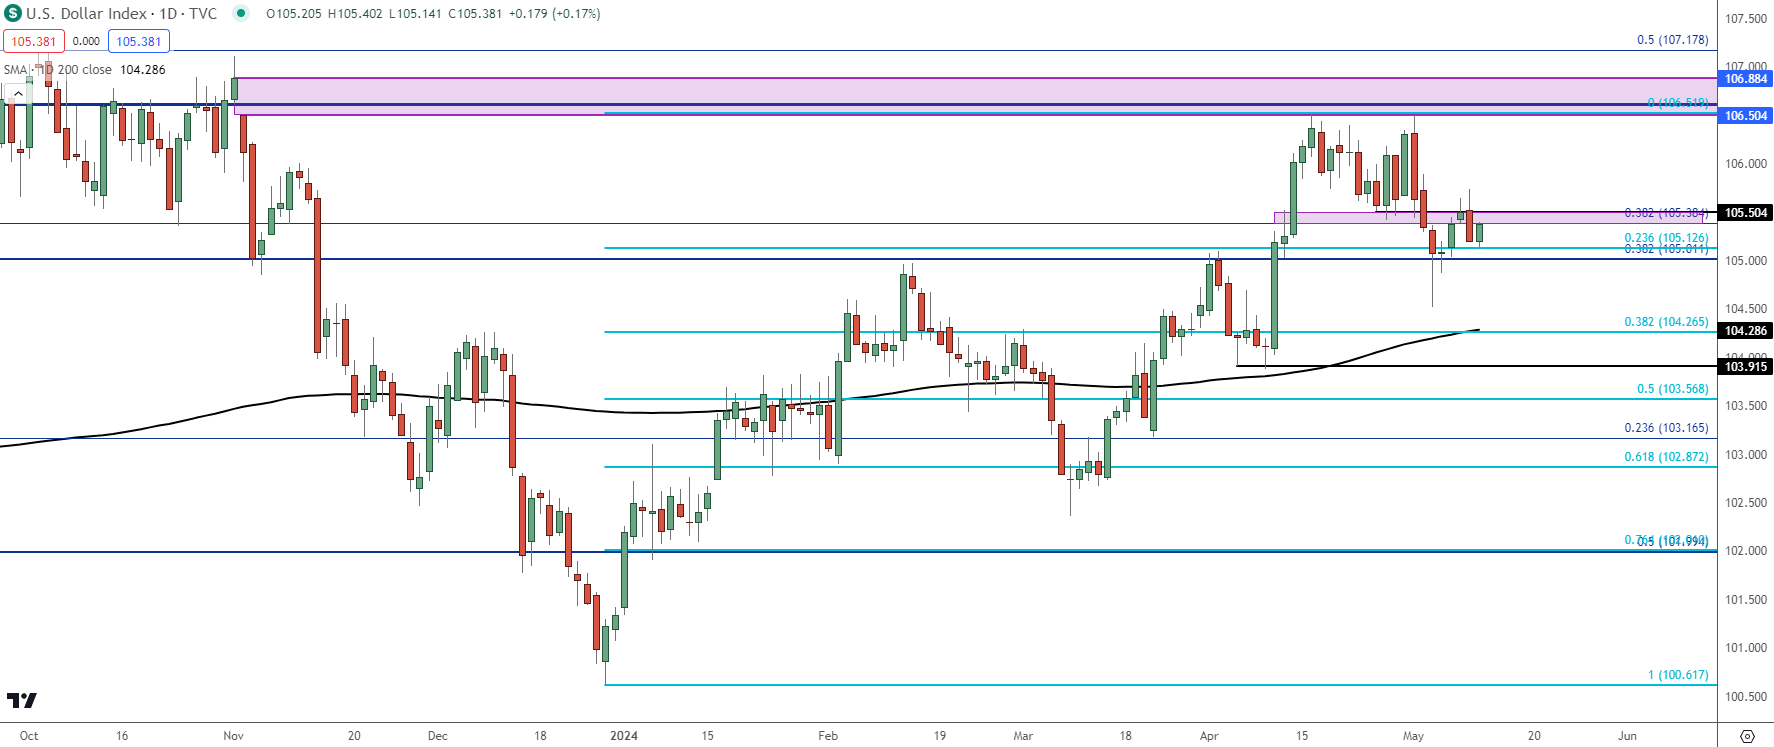
Chart prepared by James Stanley; data derived from Tradingview
EUR/USD
EUR/USD ran into its 200-day moving average last Friday as the NFP report was getting priced-in and that’s continued to hold the highs. This week has been a doji so far and there was a case of defense at the 1.0725 level of prior resistance that led to a bullish outside bar on Thursday. But similarly, bulls were unable to do anything much above 1.0800 and that’s led to pullback on Friday.
With a 57.6% allocation into DXY, the trend here is key to performance in the USD: At this point there continues a hold of higher-lows but bulls haven’t been able to run much upon test of resistance or pushes to fresh highs.
The next major obstacle for bulls would be the 200-dma, and if they can mount a move above that, the door would open for a test of the 1.0877 level that held the highs in April before the release of the CPI report. Above that, the familiar Fibonacci level of 1.0943 comes into the picture and that’s the 50% mark of the same Fibonacci study that helped to set the low last month at 1.0611.
For support, the 1.0725 level sticks out and below that, the 1.0677 level still retains some value. If bears can punch through that next week it would be a strong sign that they’re vying to re-take control of the trend, which could lead to another test of range support from 1.0500-1.0611.
EUR/USD Daily Price Chart
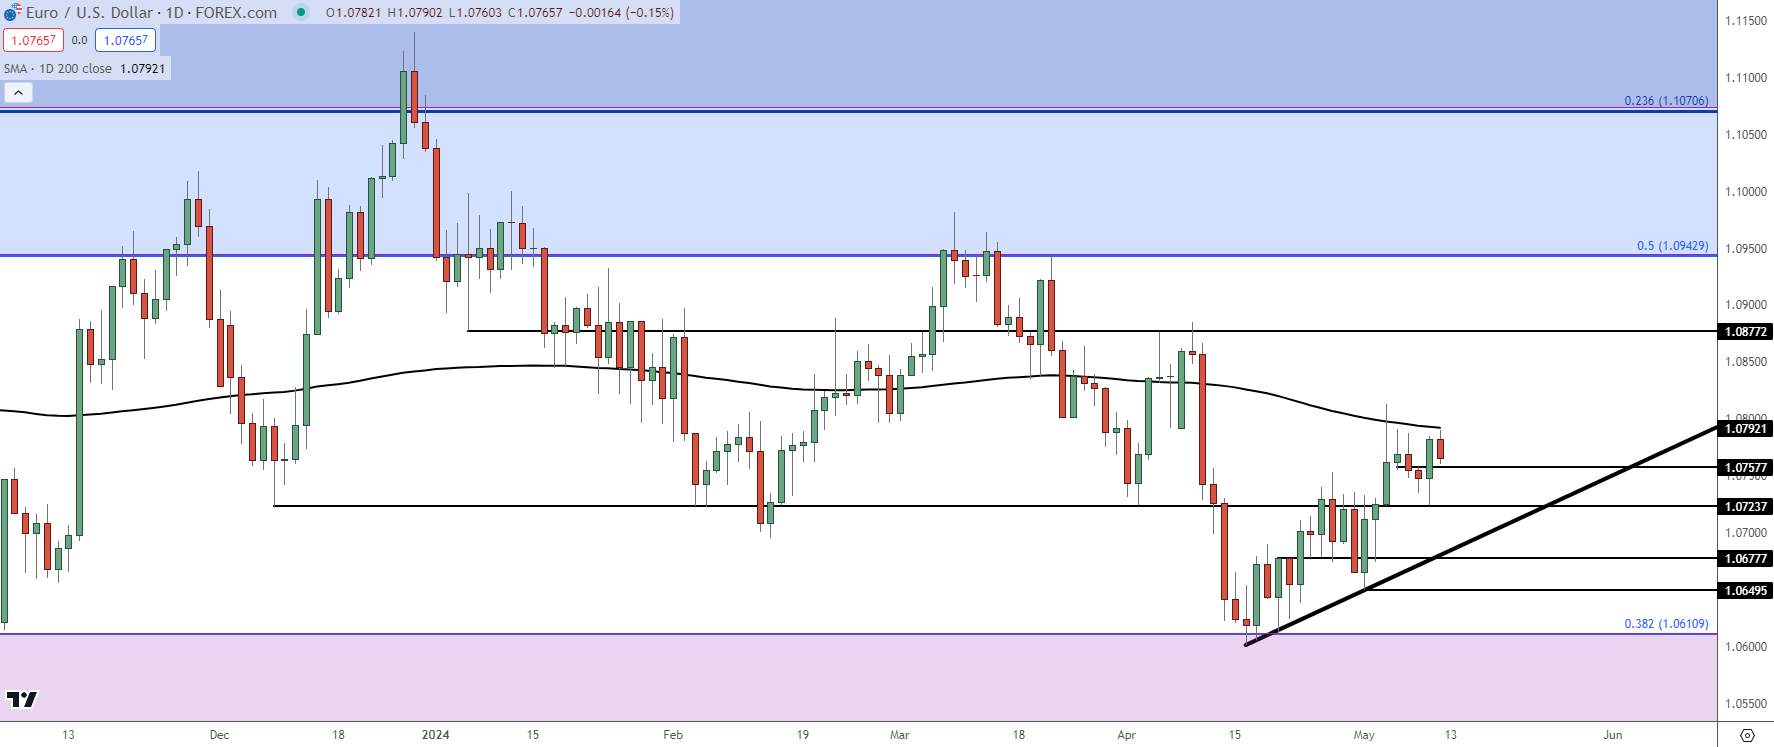 Chart prepared by James Stanley, EUR/USD on Tradingview
GBP/USD
There was a Bank of England rate decision on Thursday and the BoE echoed a similarly dovish refrain. The pair built a hammer formation on the daily after probing support at 1.2450 led to a strong bullish response – and a push back above the 1.2500 psychological level.
Continued strength on Friday trade saw bulls pull back ahead of the re-test of the 200-day moving average and that’s led to a noisy daily chart that appears devoid of any near-term trends. The Fibonacci retracement produced by the October-March move still retains some interest, as the 38.2% retracement helped to hold resistance in the early portion of the week with the 50% mark coming in to assist with support after the Bank of England rate decision.
GBP/USD Daily Price Chart
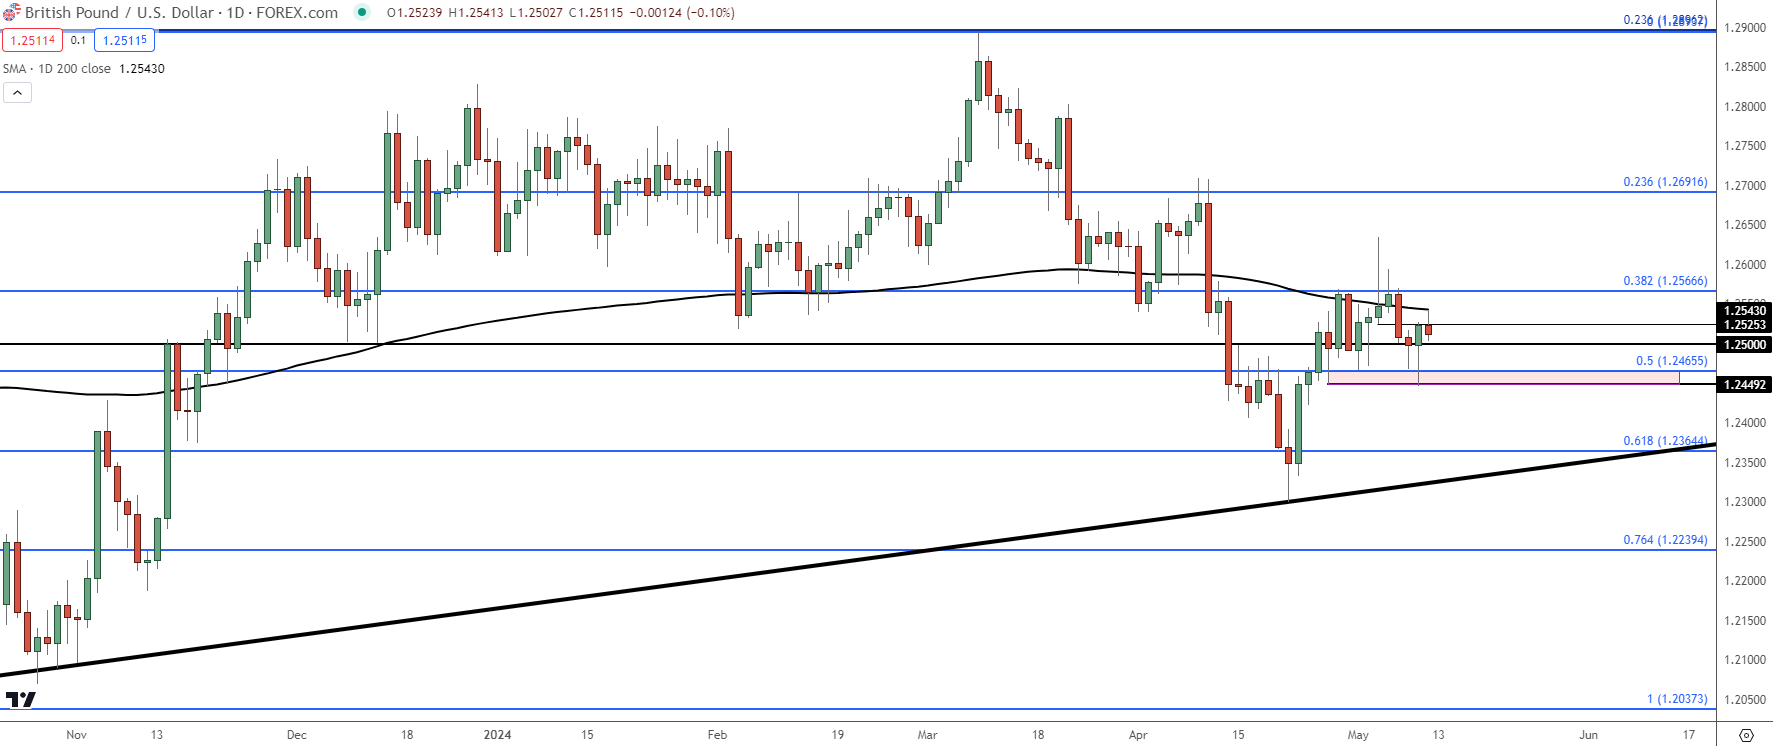 Chart prepared by James Stanley, GBP/USD on Tradingview
USD/JPY
USD/JPY bulls came roaring back this week and as of this writing it appears that they’re vying for yet another breakout.
This week’s price action was entirely in the shadow of last weeks as USD/JPY printed a bearish outside bar with some help from Japanese policymakers. After intervening at the 160.00 handle, there was widespread accusation of another intervention after the FOMC meeting. That put USD/JPY in reverse and that theme held all the way to the NFP report, at which point USD/JPY drove down to re-test 151.95 – and it’s been mostly up since then.
I looked at the pair a few different times this week while focusing on continued recovery. There remains geopolitical intrigue behind the prospect of additional intervention so that brings question to how active the Ministry of Finance may remain to be.
As I had discussed – the big hope for Japanese policy makers is probably a bearish run in the USD, which could show after the CPI print next Wednesday if the data prints below-expectations. USD-weakness was a major factor in reversals in 2022 and 2023 and if carry traders have the worry of losing principal, that can lead to a fast unwind of the move.
But, for now an until 160 comes back into play, USD/JPY could remain as on of the more attractive major for bullish USD scenarios.
USD/JPY Four-Hour Price Chart
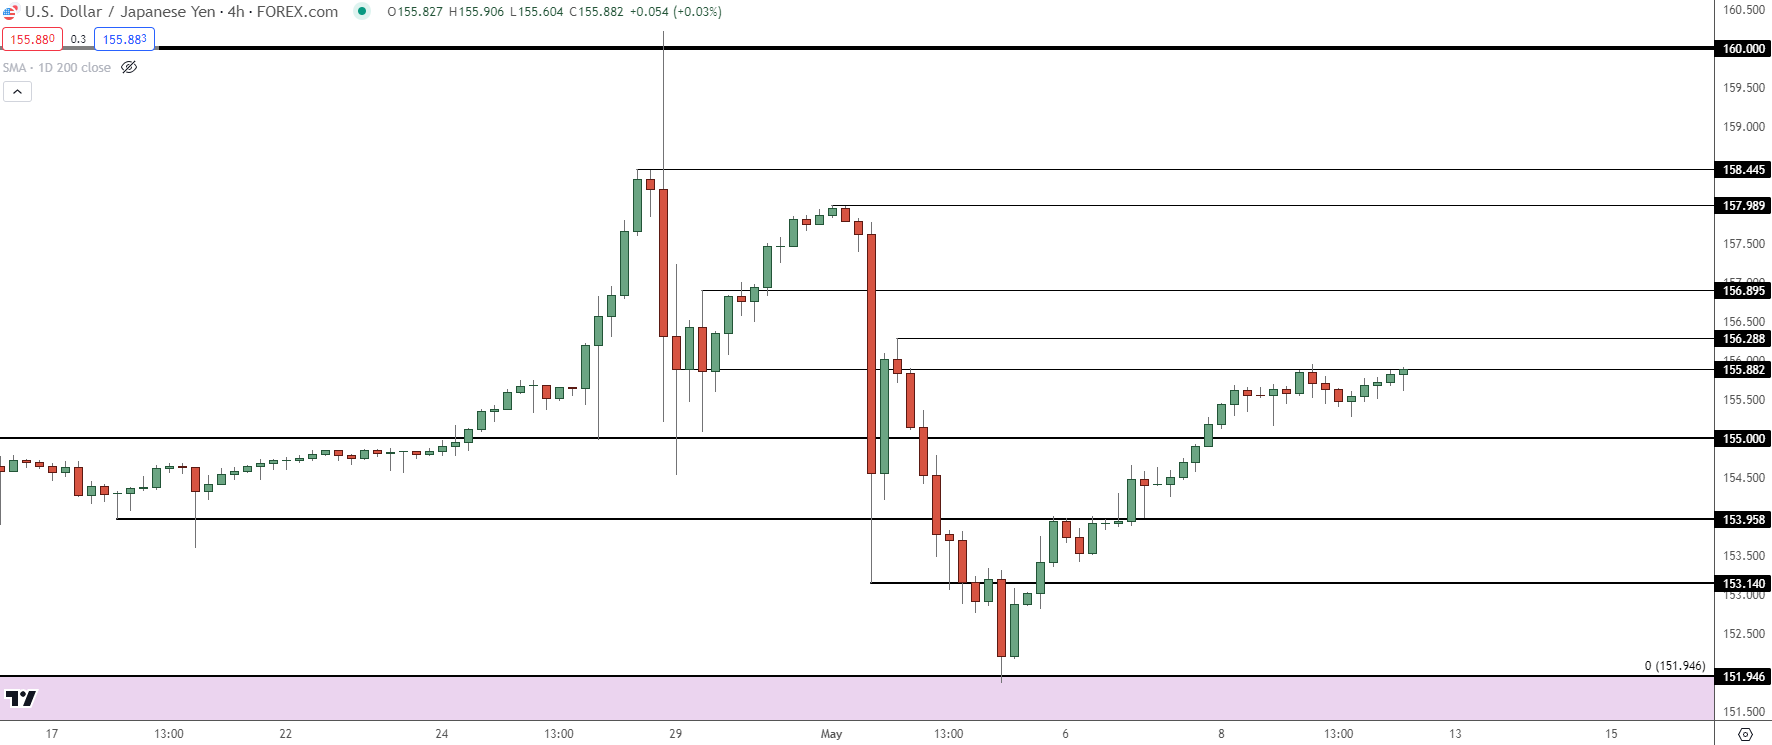 Chart prepared by James Stanley, USD/JPY on Tradingview
Gold (XAU/USD)
It was a big week for Gold, and the big question here is whether the pullback is completed.
While bears have had favor since the high was set in April, the resulting pullback has been uneven as it priced-in as a falling wedge formation. Those are often approached with bullish aim, and given the intensity of the prior breakout, that could also be looked at like a bull flag formation.
The late week breakout was intense, and once price was finally able to drive above the 2319-2326 zone, bulls jumped right past the 2350-2354 area. That now becomes support potential for pullbacks and like the markets addressed above, the CPI print on Wednesday could loom large here. If that comes out below expectations, it could feed FOMC rate cut hopes which could then transmit to higher Gold prices.
Gold Four-Hour Price Chart
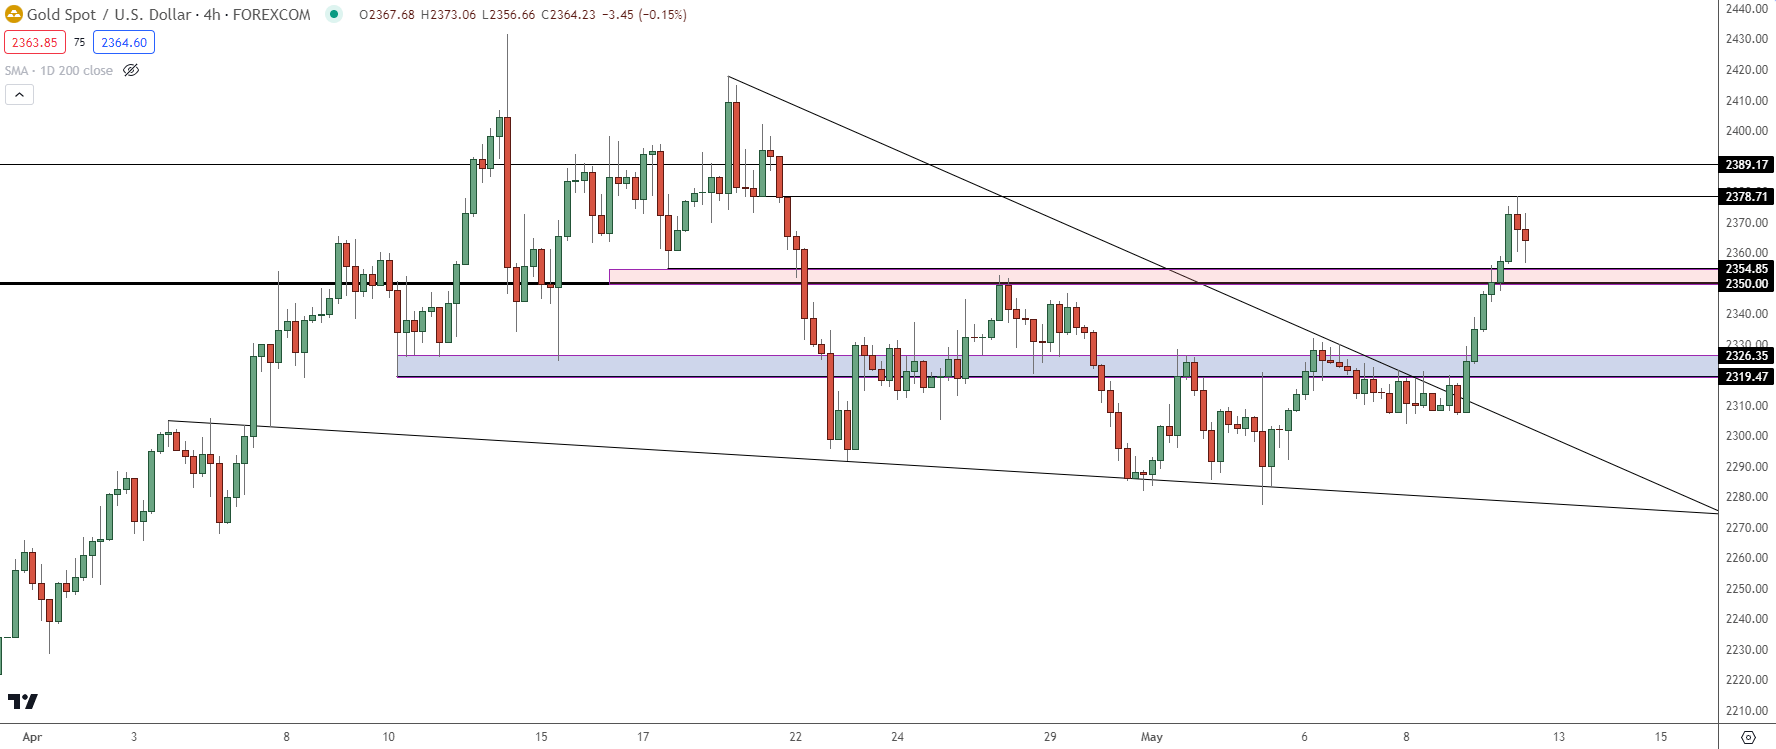 Chart prepared by James Stanley, Gold on Tradingview
--- written by James Stanley, Senior Strategist


