
US Dollar Talking Points:
- The week started with pain in the US Dollar but support soon showed at a Fibonacci level that led to a bounce. But bulls aren’t out of the woods yet as DXY broke below a longer-term trendline, and the CPI report for next week looms large.
- EUR/USD attempted a breakout on Monday but failed at the 1.1000 handle, and USD/JPY remains engulfed by fundamental drama around the Bank of Japan. AUD/USD ran into a long-term trendline last week and GBP/USD hasn’t seemed to be able to catch a bid of late.
- I’ll be looking into these setups in the Tuesday webinar and you’re welcome to join, click here for registration information.
It was panic to start the week but generally positive US data helped to temper matters a bit. The prior week saw two different factors lead to a rush in US Treasuries and that had impact across numerous other markets. In the US Dollar, that dip in Treasury yields ran alongside USD weakness which set a fresh six-month-low on Monday morning.
But – support soon showed at the 23.6% retracement of last year’s major move spanning from the October high to the December low. A quick bounce developed and held through Thursday trade, at which point a spot of confluent resistance came into play to help hold the highs.
US Dollar Daily Price Chart
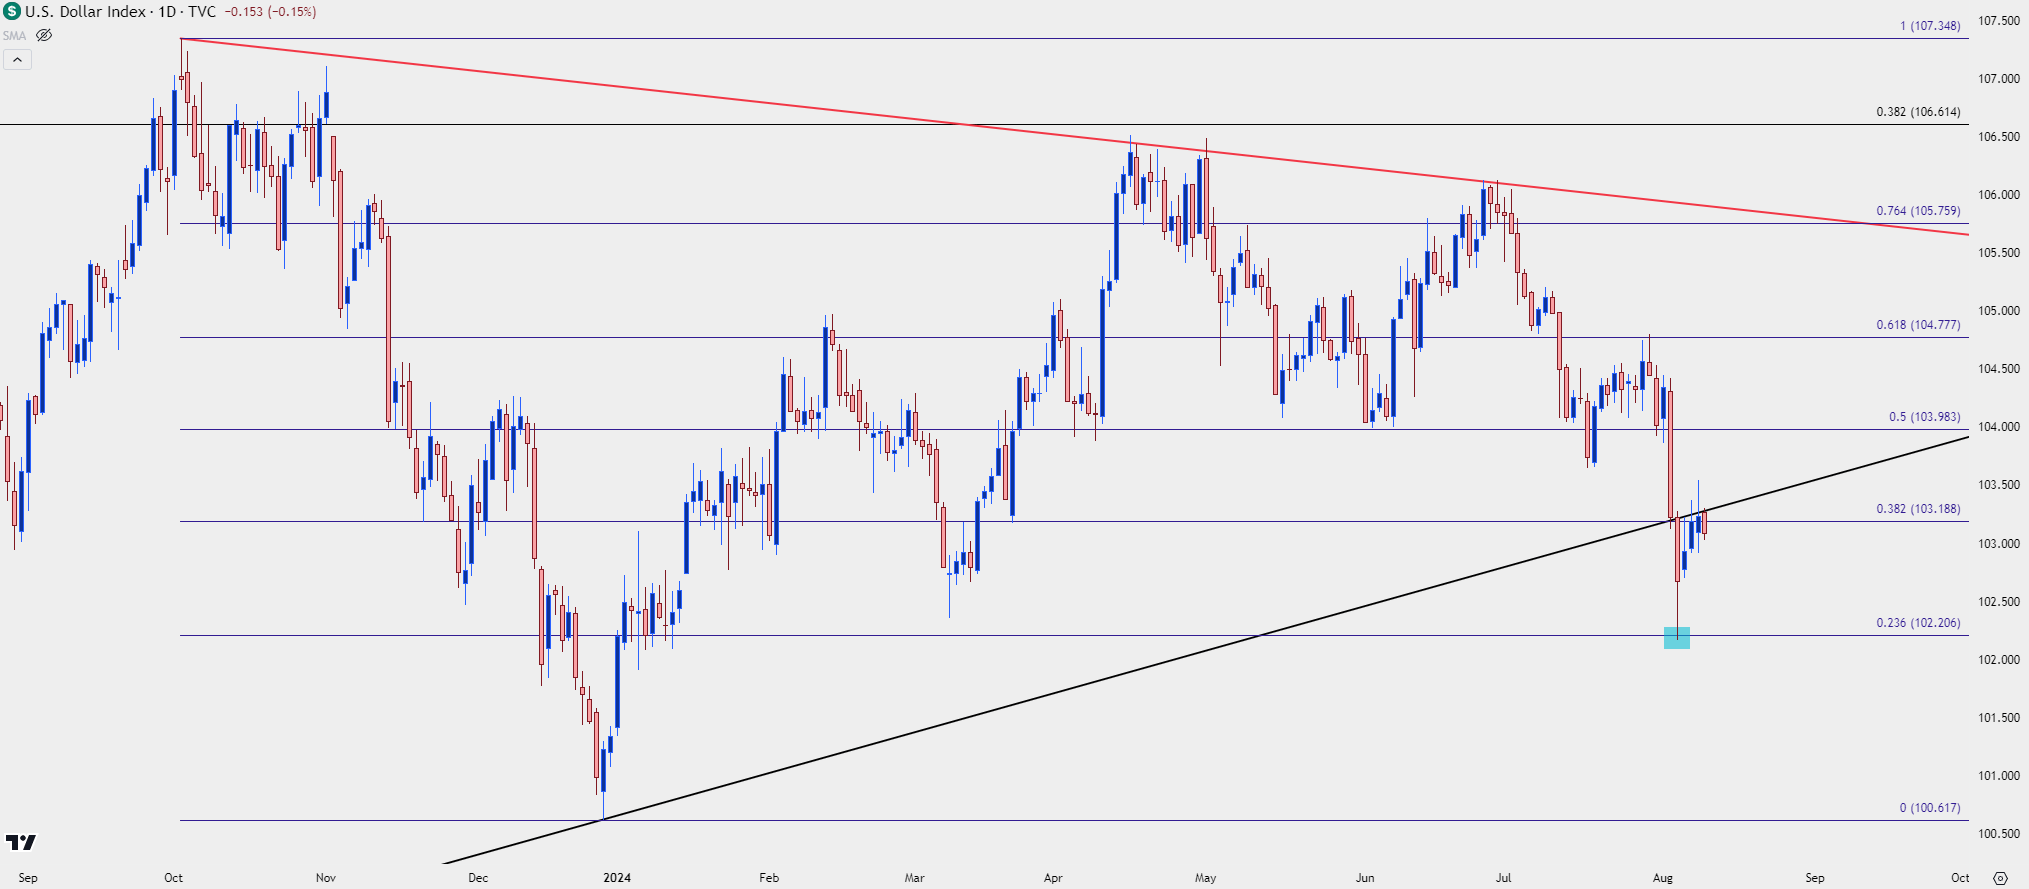 Chart prepared by James Stanley; data derived from Tradingview
US Dollar Weekly
The support level looked at above has some additional reference from longer-term charts, as that level is confluent with the 50% mark of the longer-term major move taken from the June 2021 low up to the September 2022 high. That confluent resistance comes from a couple of different items: The 61.8% Fibonacci retracement of the same major move mentioned above, along with a bullish trendline connecting June 2021 and May 2023 swing lows. That projection had helped to hold the lows in the prior week, giving it a third point of touch and, as of this writing, buyers haven’t been able to push price back-above.
US Dollar Weekly Price Chart
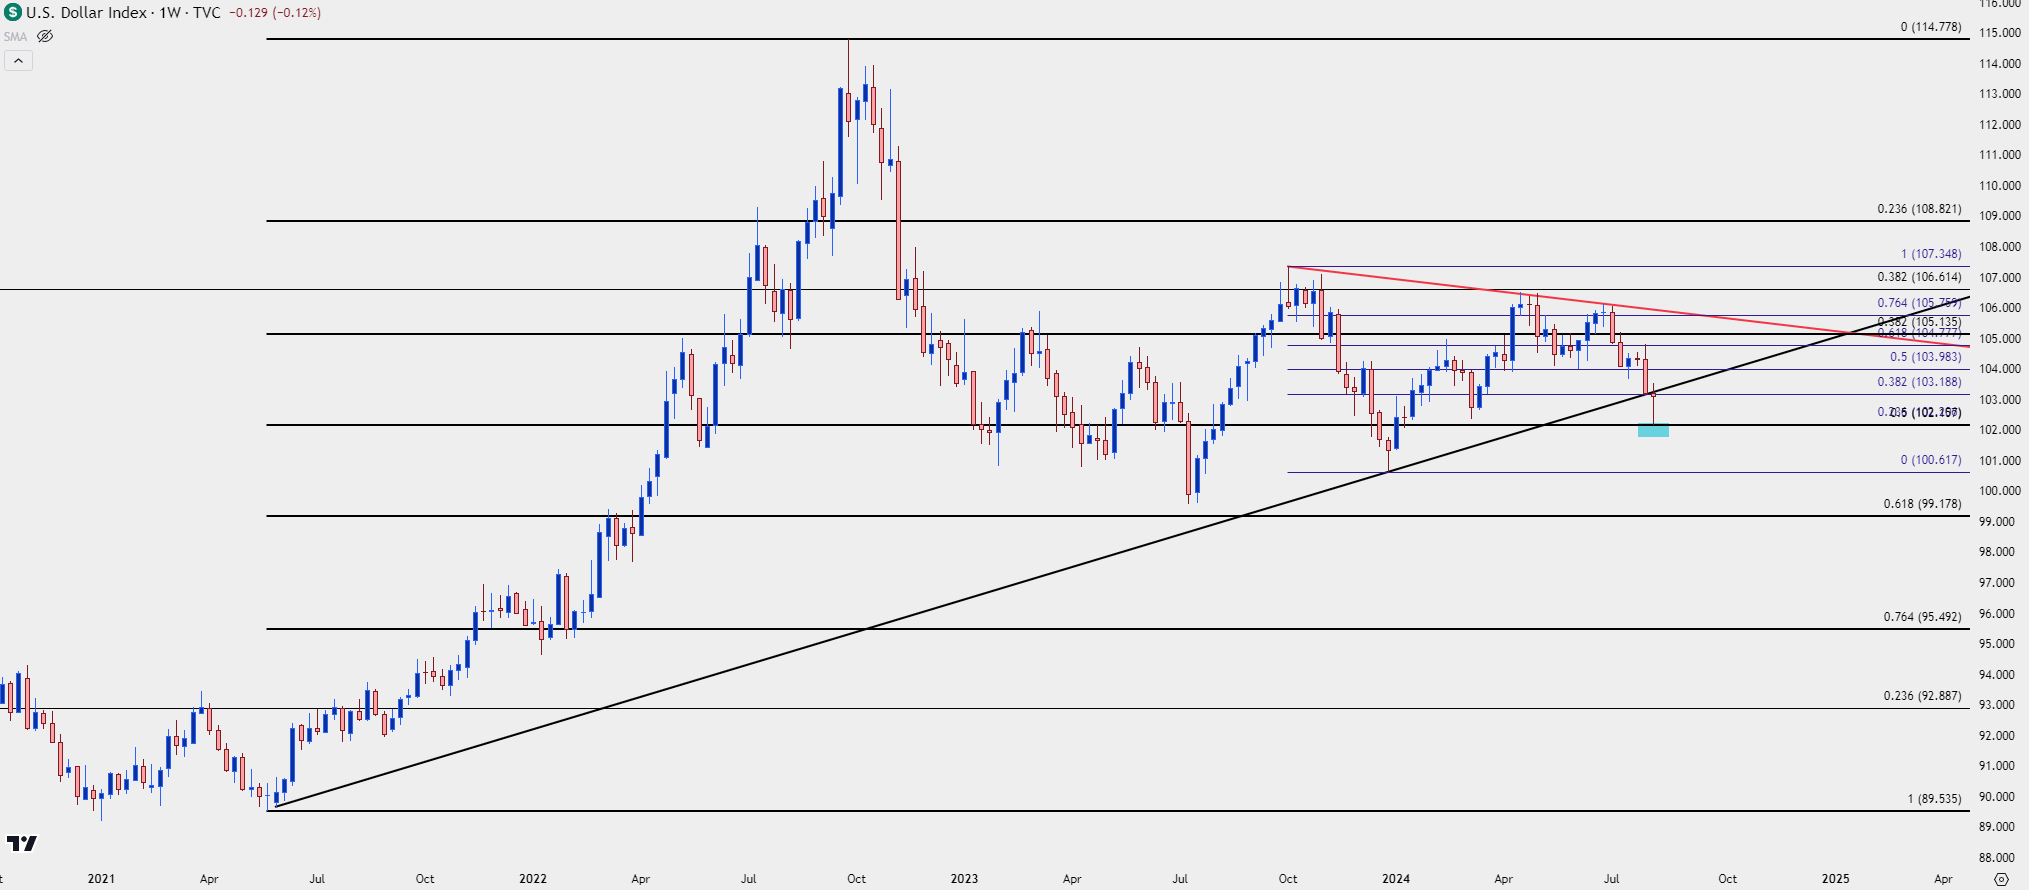 Chart prepared by James Stanley; data derived from Tradingview
EUR/USD
EUR/USD tested the 1.1000 handle after the Sunday open and much like we saw in the first two weeks of the year, that was a hard-stop reversal. But – buyers didn’t allow for much movement below the 1.0900 handle and as of this writing, the door is still open for a higher-low and a re-test of the big figure.
There is another spot of resistance to consider: The same 1.0943 Fibonacci level held the highs later in the week and that remains a key spot, and I’ve spanned that up to another Fibonacci level at 1.0960 to create a zone.
For support, 1.0900 is still worth consideration as there’ve been no daily closes below that price this week, and 1.0862 looms below that. If sellers can force a push down to that Fibonacci level, and then follow-through with a lower-high around 1.0900, there’s an open door for a deeper pullback as price continues to coil within the symmetrical triangle formation.
EUR/USD Daily Price Chart
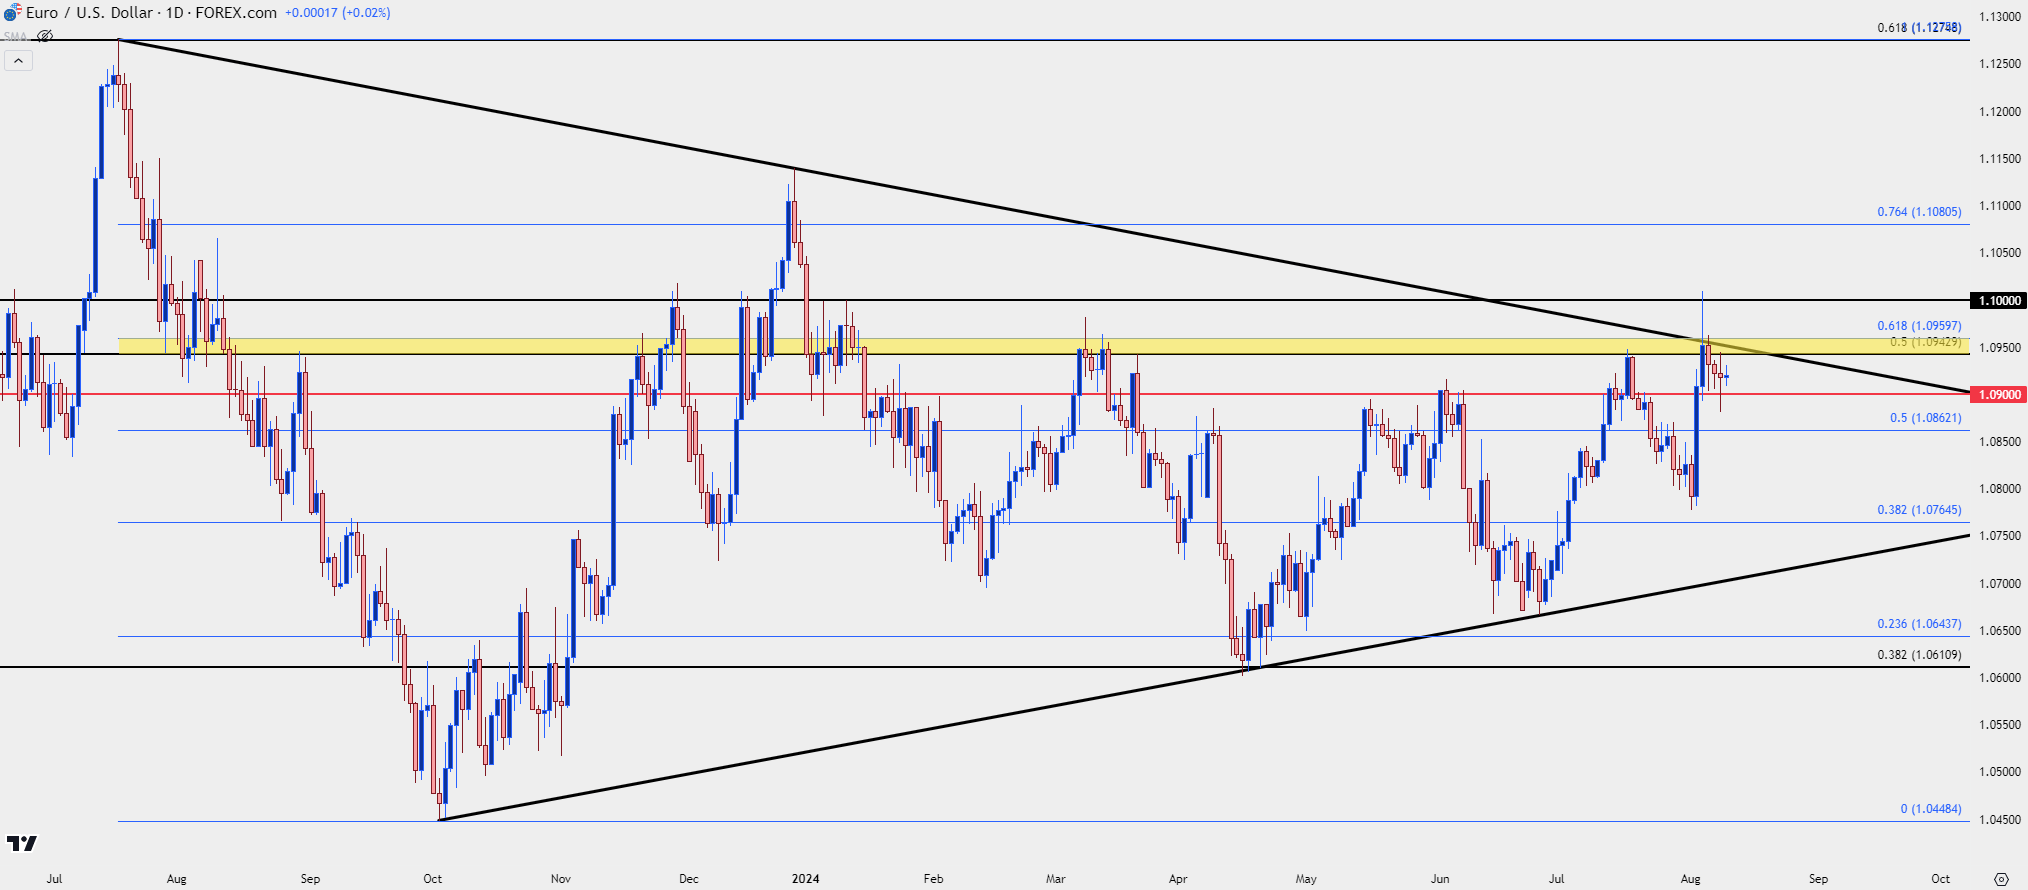 Chart prepared by James Stanley, EUR/USD on Tradingview
GBP/USD
Fortunes can change fast in markets and GBP/USD illustrates that well. I had highlighted a confluent backdrop less than a month ago as GBP/USD had put in its first test above the 1.3000 big figure in more than a year and, at the time, the pair was also flashing overbought conditions on the daily chart for the first time in a year.
Price started with a pullback but that soon began to show tones of a reversal, helped along by a rate cut from the Bank of England.
While the US Dollar hasn’t exactly been strong, GBP/USD has continued to struggle. But – in the middle of the past week the pair built a morning star formation which is often approached with aim of bullish reversal; and that formation built at a big spot around the 1.2700 handle.
For next week the attention is on 1.2800 and then 1.2845.
GBP/USD Daily Price Chart
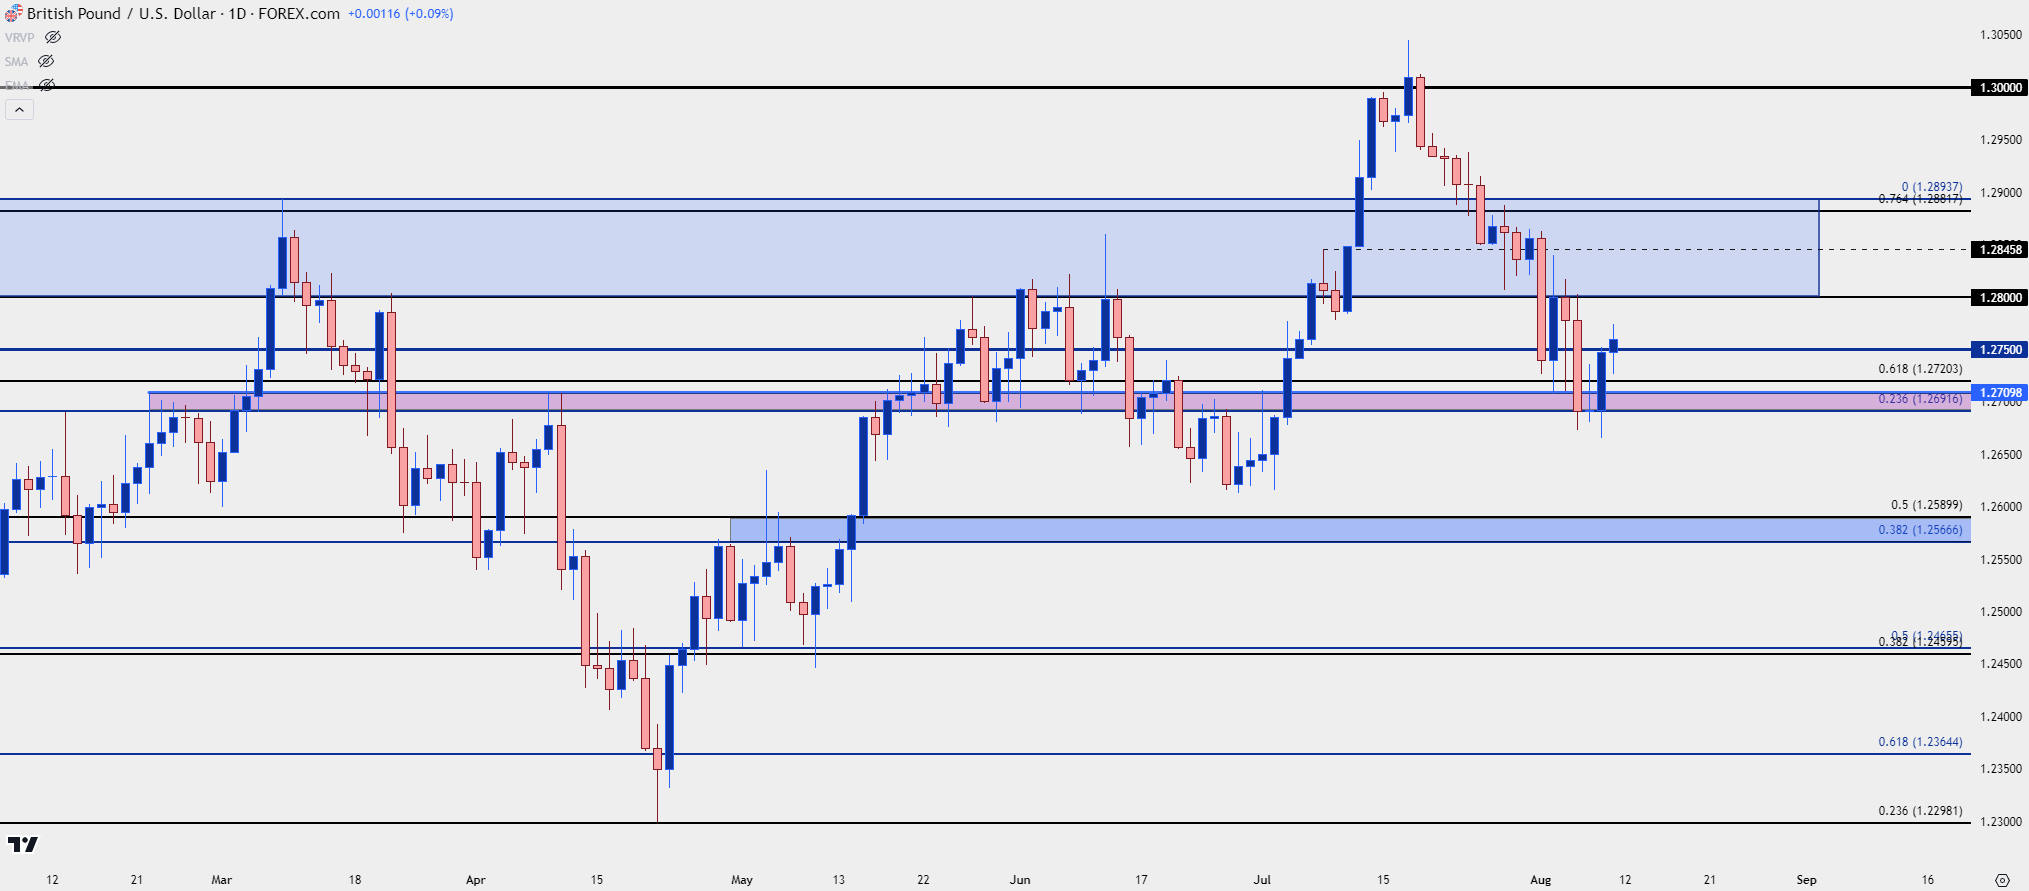 Chart prepared by James Stanley, GBP/USD on Tradingview
USD/JPY
USD/JPY remains a wild card given the recent dynamics around the Bank of Japan. They did try to walk back from their hawkish push over the past week and, from the weekly chart, there’s evidence it may have helped as price is currently showing a long-legged doji formation.
USD/JPY Weekly Price Chart
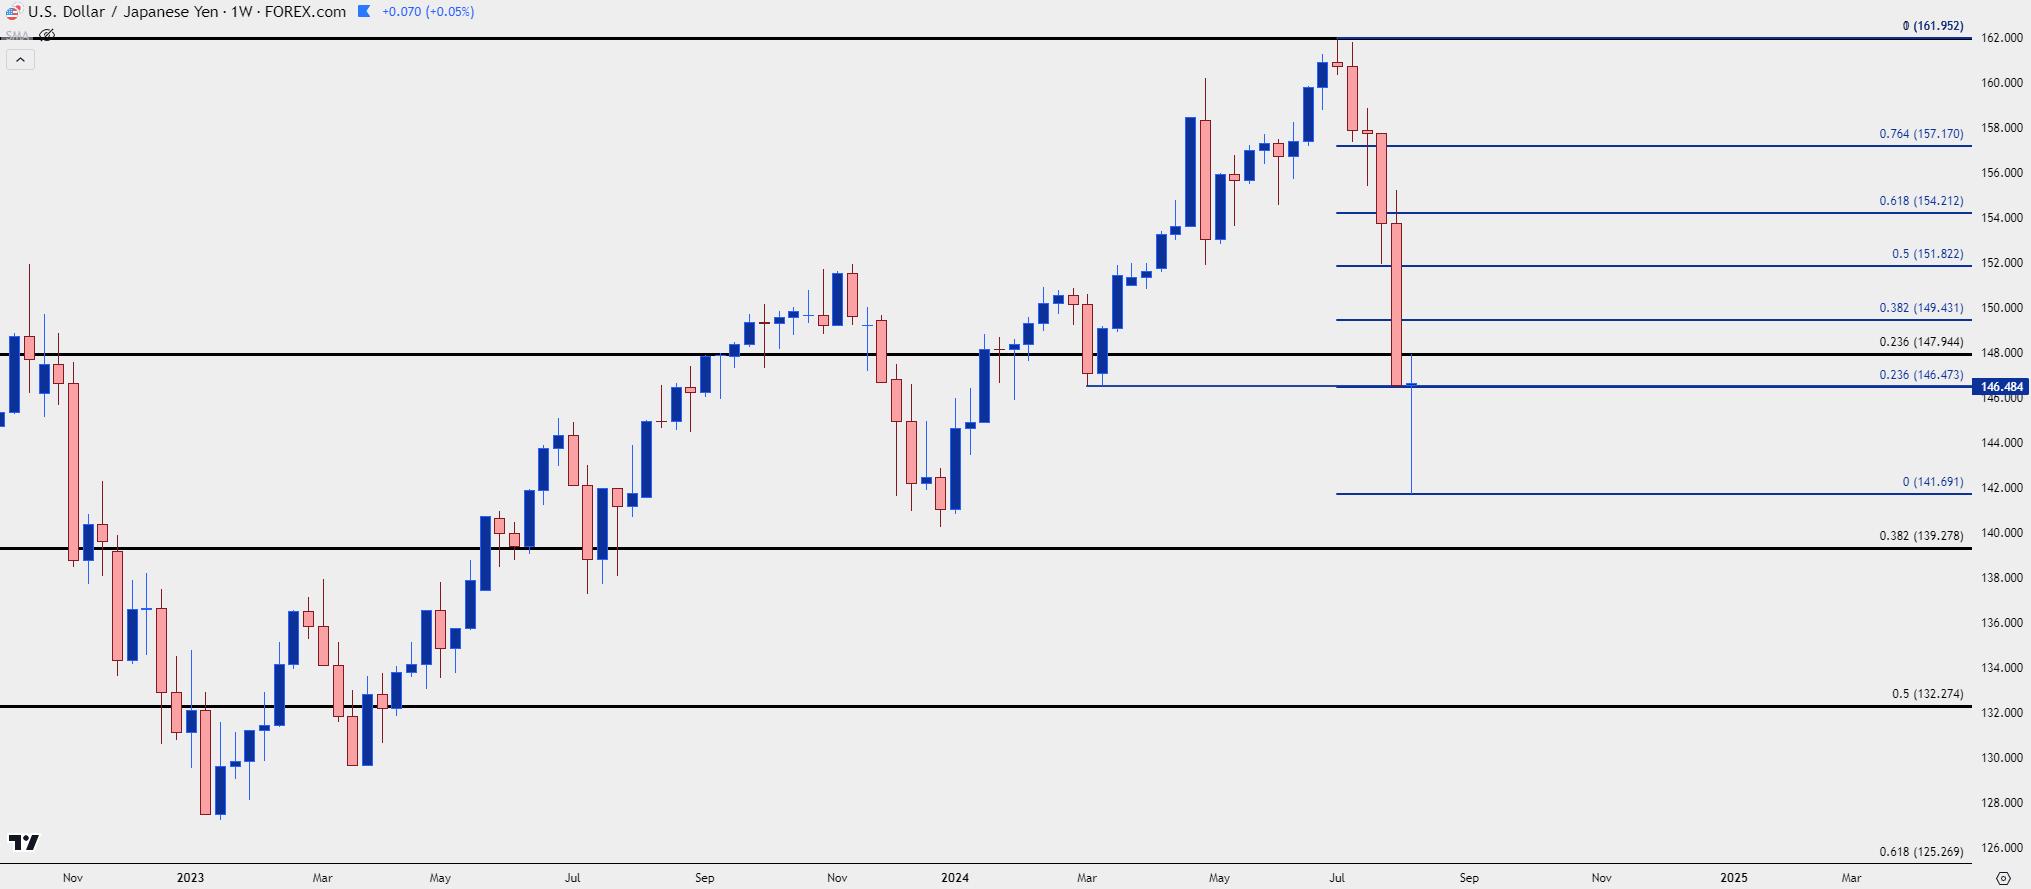 Chart prepared by James Stanley, USD/JPY on Tradingview
USD/JPY Shorter-Term
Given the intensity of the sell-off and the fundamental backdrop, much attention has been paid to the Bank of Japan. But I think this has become more of a US rates matter as it’s the carry trade that will determine whether this flies or dies. That carry trade remained in-force for more than three years and while the BoJ hiked rates a bit, it’s the fast push lower in US rates that takes some of the attractiveness away from the carry.
And given the violence of the move over the past few weeks, ever since the BoJ intervened to defend the 160.00 level a month ago, longer-term carry traders should rightfully be cautious.
As a case in point, the 148.00 level that I looked at in the Tuesday webinar continued to hold the highs. And if we do see bulls push to say 150.00 or perhaps even the 152.00 level, with the Fed expected to soon begin rate cuts – will that be enough to draw more longs in on the basis of carry to help continue the bullish trend?
Personally, I remain dubious and interestingly, there may be a counter-intuitive outlay around CPI next week, where better-than-expected CPI drives USD-strength and thereby USD/JPY; while a lower-than-expected CPI print induces thoughts of lower rates which further motivates carry trades to close positions.
Below on the four-hour chart I highlight recent bullish structure as shown from the Tuesday webinar.
USD/JPY Daily Price Chart
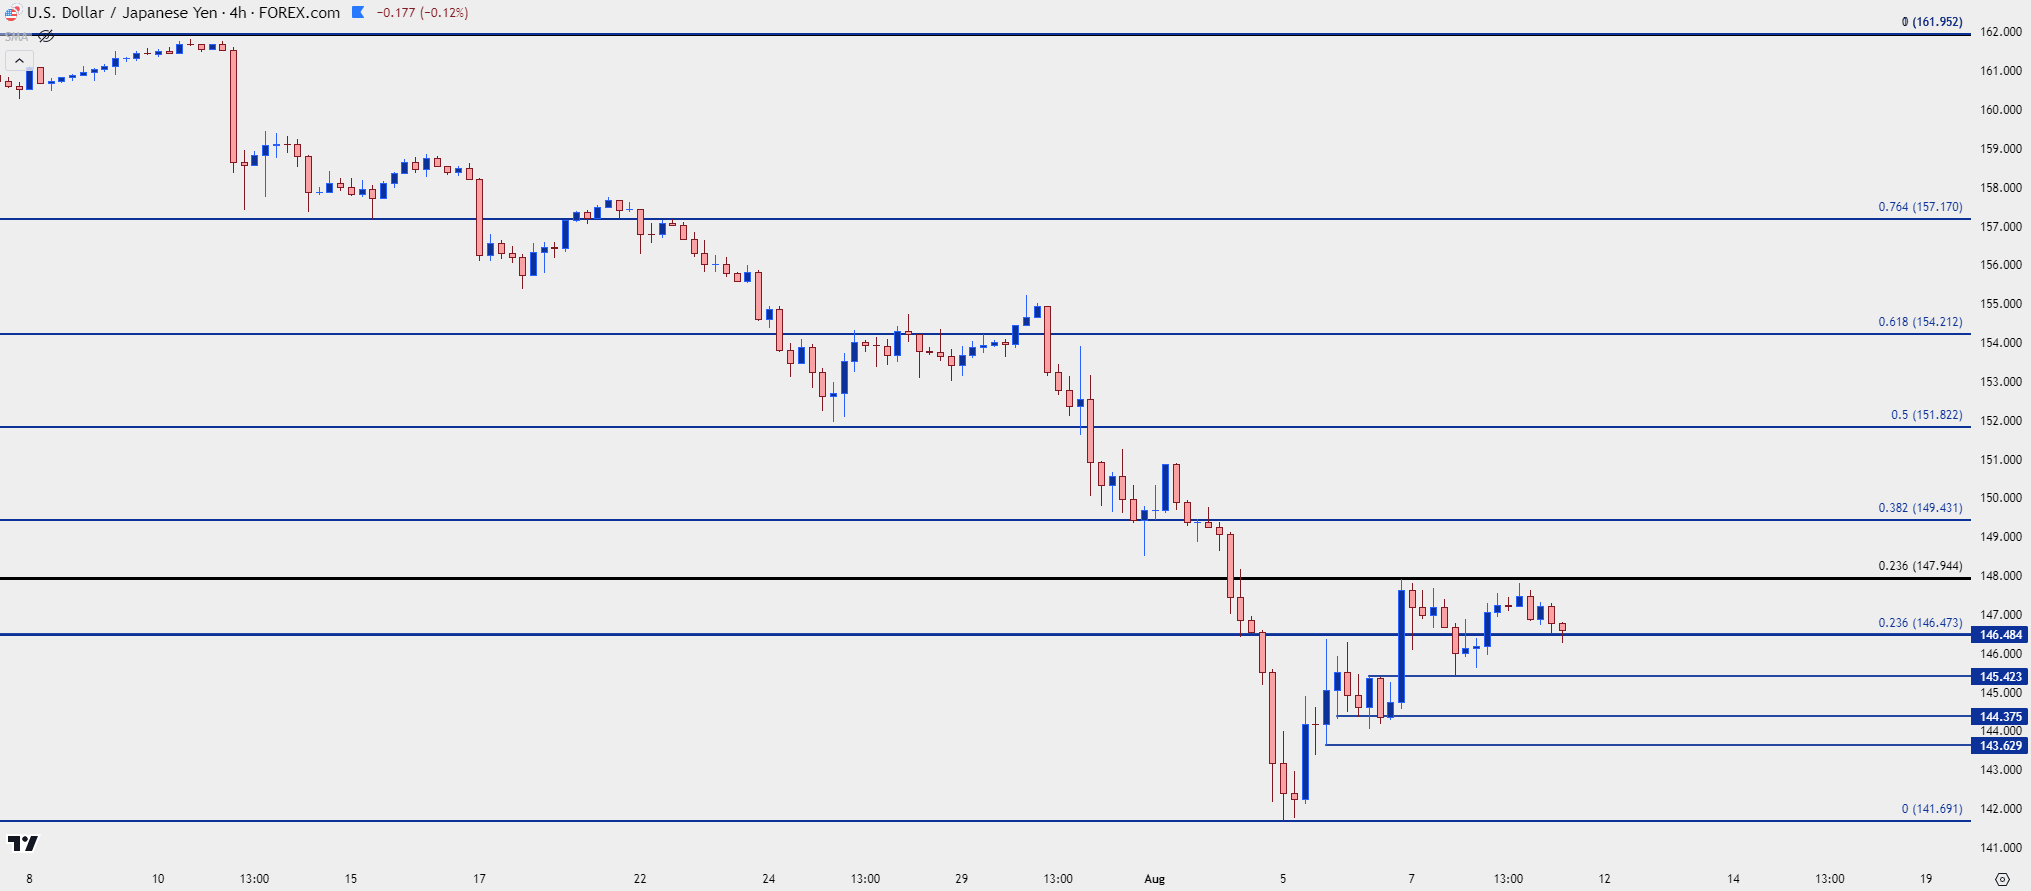 Chart prepared by James Stanley, USD/JPY on Tradingview
AUD/USD
Aussie ran into a big trendline on Monday just around the time that panic was peaking. The pair technically set a fresh 2024 low although bears didn’t hang around for long as price quickly jumped back above .6500 and then went on to re-test the .6604 Fibonacci level.
I wanted to keep this one on the radar for next week largely on the basis of USD-weakness themes, as that underside wick is notable. If bulls can force above .6604, the door opens for re-tests of .6700; and it’s the .6872 level that looms large as this is the 38.2% retracement that also marks the current yearly high in the pair.
AUD/USD Weekly Price Chart
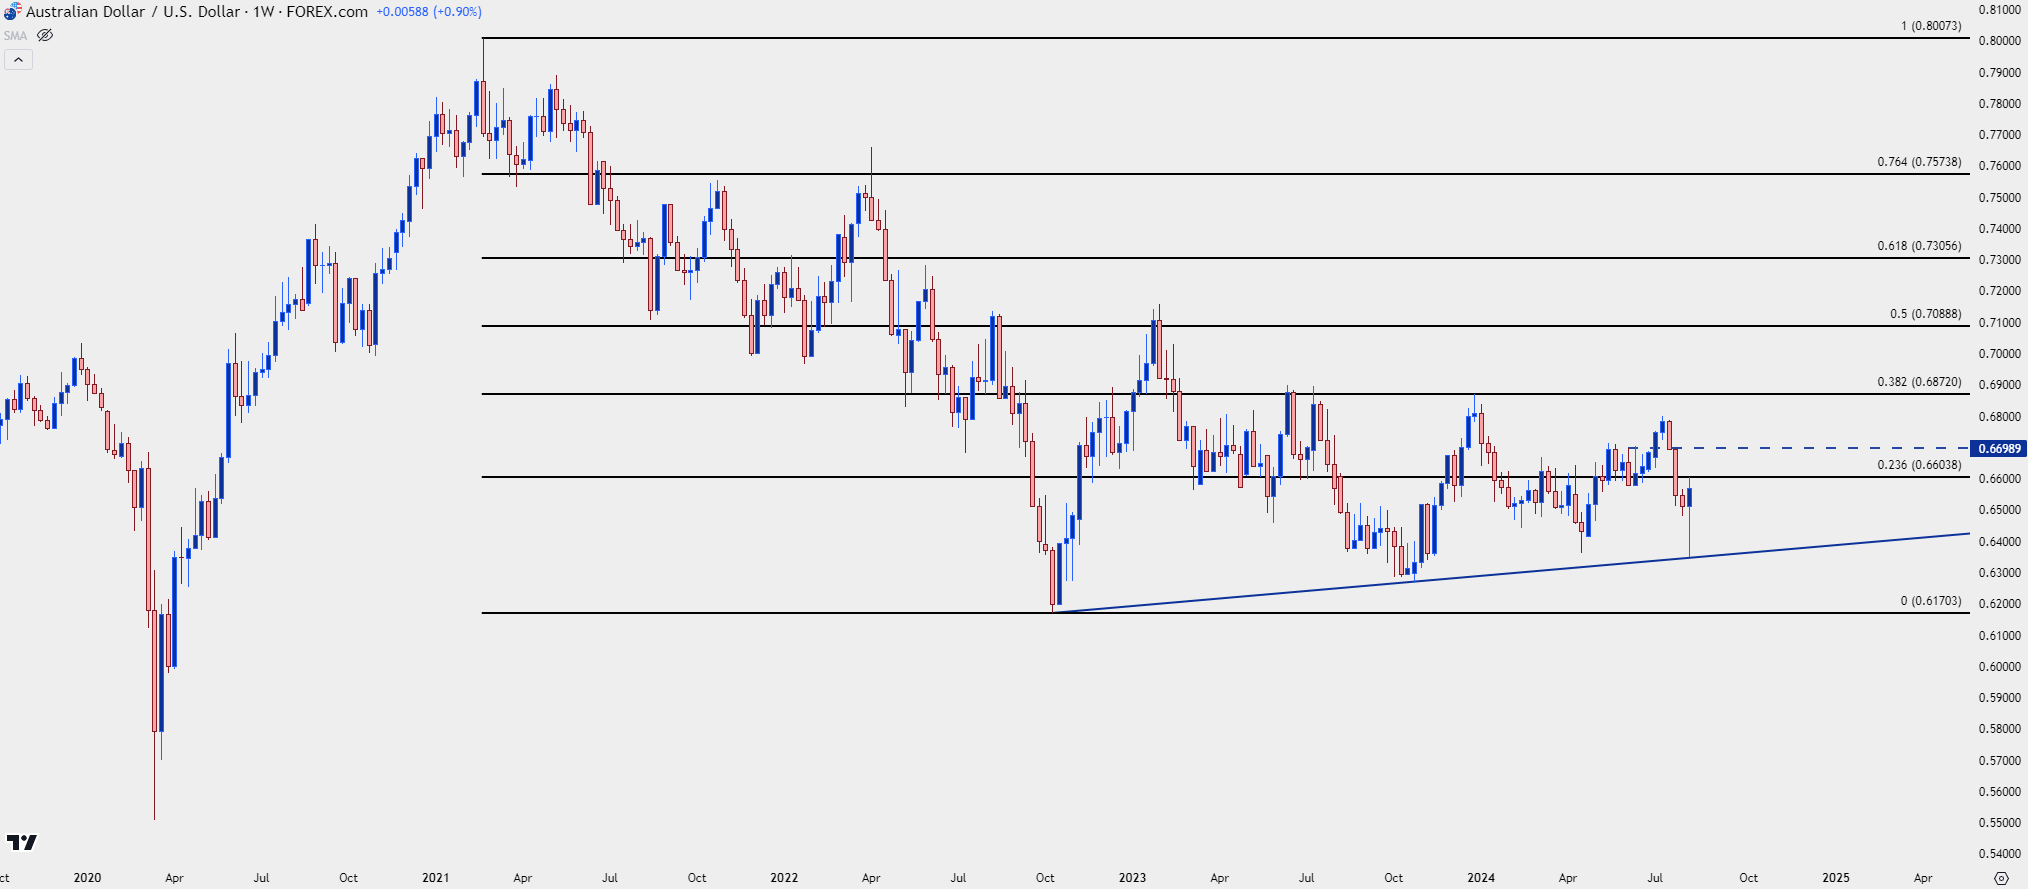 Chart prepared by James Stanley, AUD/USD on Tradingview
--- written by James Stanley, Senior Strategist


