
US Dollar Talking Points:
- The US Dollar has shown a very strong response from support at the Fibonacci level at 105.38, which is the 38.2% retracement from the same study that helped to set the high at the 50% marker earlier in the month.
- The next two weeks are loaded with macro risk, along with earnings in the US which can make for an especially busy backdrop. Tomorrow brings the Bank of Canada and then Thursday is the ECB. Friday brings the Fed’s preferred inflation gauge of PCE and then next week’s calendar contains the FOMC rate decision and Non-farm Payrolls on Friday.
- I’ll be discussing these themes in-depth in the weekly webinar on Tuesday at 1PM ET. It’s free for all to register: Click here to register.
The US Dollar is seeing another aggressive bullish move and with the calendar opening up to a plethora of headline risk over the next two weeks, the big question is whether Dollar bulls are making their move ahead of the outlay.
This morning saw a test of 105.38, which is the 38.2% Fibonacci retracement of the pullback move that started last year. Notably, the 50% marker from that same major move is what helped to set the high earlier in October around 107.20. That provides a bit of additional context as that becomes a resistance level of note in topside breakout scenarios, with the 108.00 level looming large above that.
There’s also a falling wedge at work here, which is often approached with aim of bullish reversal potential. In this case, that would be a reversal of the pullback move that came into play after that 107.20 resistance inflection.
US Dollar - DXY Daily Price Chart (indicative only, not available on Forex.com platforms)
 Chart prepared by James Stanley; data derived from Tradingview
EUR/USD Swatted Down
There’s some considerable headline drive out of the European Union this week, specifically looking at Thursday for the ECB rate decision. I had written about this yesterday and as I’ve been talking about for much of October, I’ve been looking for a pullback given support at or around the 1.0500 psychological level.
In late-September price was plummeting – until 1.0500. That gave a support bounce with a pullback to 1.0611, after which sellers went for the break and were able to push down to 1.0448. Selling pressure again slowed and price pushed back above 1.0500, and then around NFP earlier this month, despite a massive headline beat, the US Dollar couldn’t continue its bullish trend and EUR/USD set a higher-low at 1.0488.
The week after that, support held at 1.0500, leading to another higher low and then last week was another higher-low. This has led to the build of a bear flag formation, with a bullish channel at the bottom of a bearish trend. Price popped up for a test of resistance at 1.0673 yesterday and buyers made a forward push but failed to tag the 1.0700 handle, after which sellers have come back in abundance.
At this point, the bear flag remains aligned on the daily chart but bulls just got hopes dashed after yesterday’s breakout has been entirely erased. This sets up for a test of support, and there’s a swing low from Friday at 1.0563 that remains of interest, before the big picture zone comes into play around the 1.0500 psychological level.
EUR/USD Daily Price Chart
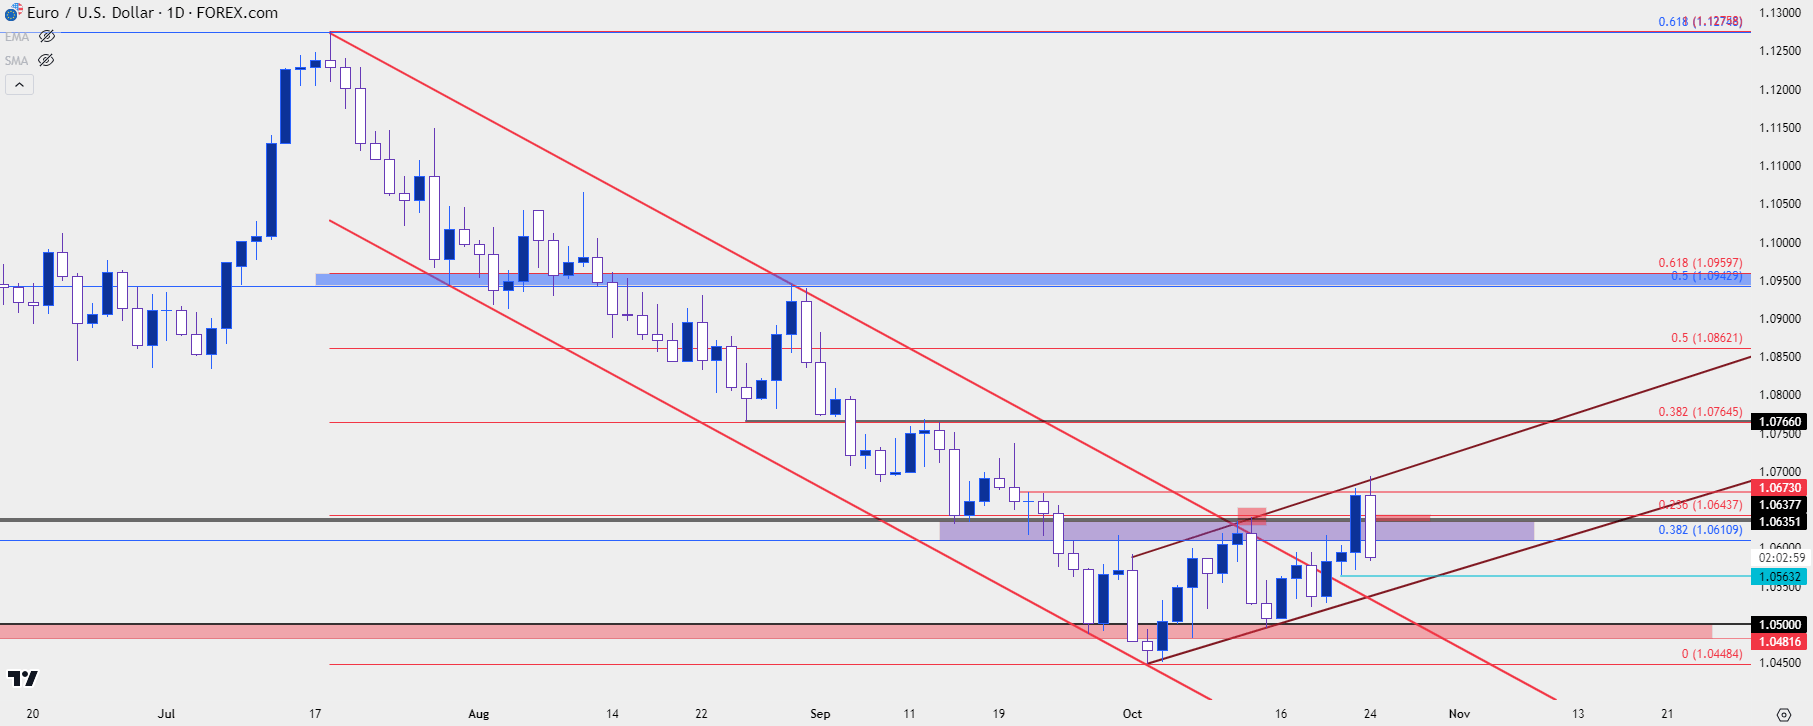 Chart prepared by James Stanley, EUR/USD on Tradingview
GBP/USD
I’m looking at the weekly chart below and there’s a similar symptom of stall in GBP/USD, with the difference being proximity to nearby psychological levels. I’ve been talking about the EUR/USD’s test of 1.0500 for almost a full month now, but in GBP/USD, the 1.2000 level looms ominously below the October lows. So, if sellers can evoke a breakout, the question remains as to whether they’ll be able to retain control for long.
Of note is the indecision that’s been displayed on the weekly chart in a previously very decisive trend.
GBP/USD Weekly Price Chart
 Chart prepared by James Stanley, GBP/USD on Tradingview
USD/CAD
There’s a Bank of Canada rate decision tomorrow and the pair has shown some bullish tendencies on the daily chart, but I first need to present the weekly chart to put that into context.
From the weekly chart of USD/CAD below we can see continued consolidation, which isn’t especially notable considering this pair is a natural cross. But last week showed a strong bullish move with bulls testing above a resistance trendline and so far this week, bulls have held higher-low support above a key Fibonacci level at 1.3652.
But, also visible is the resistance sitting overhead, generated from multiple failed breakouts in the pair over the past year.
USD/CAD Weekly Price Chart
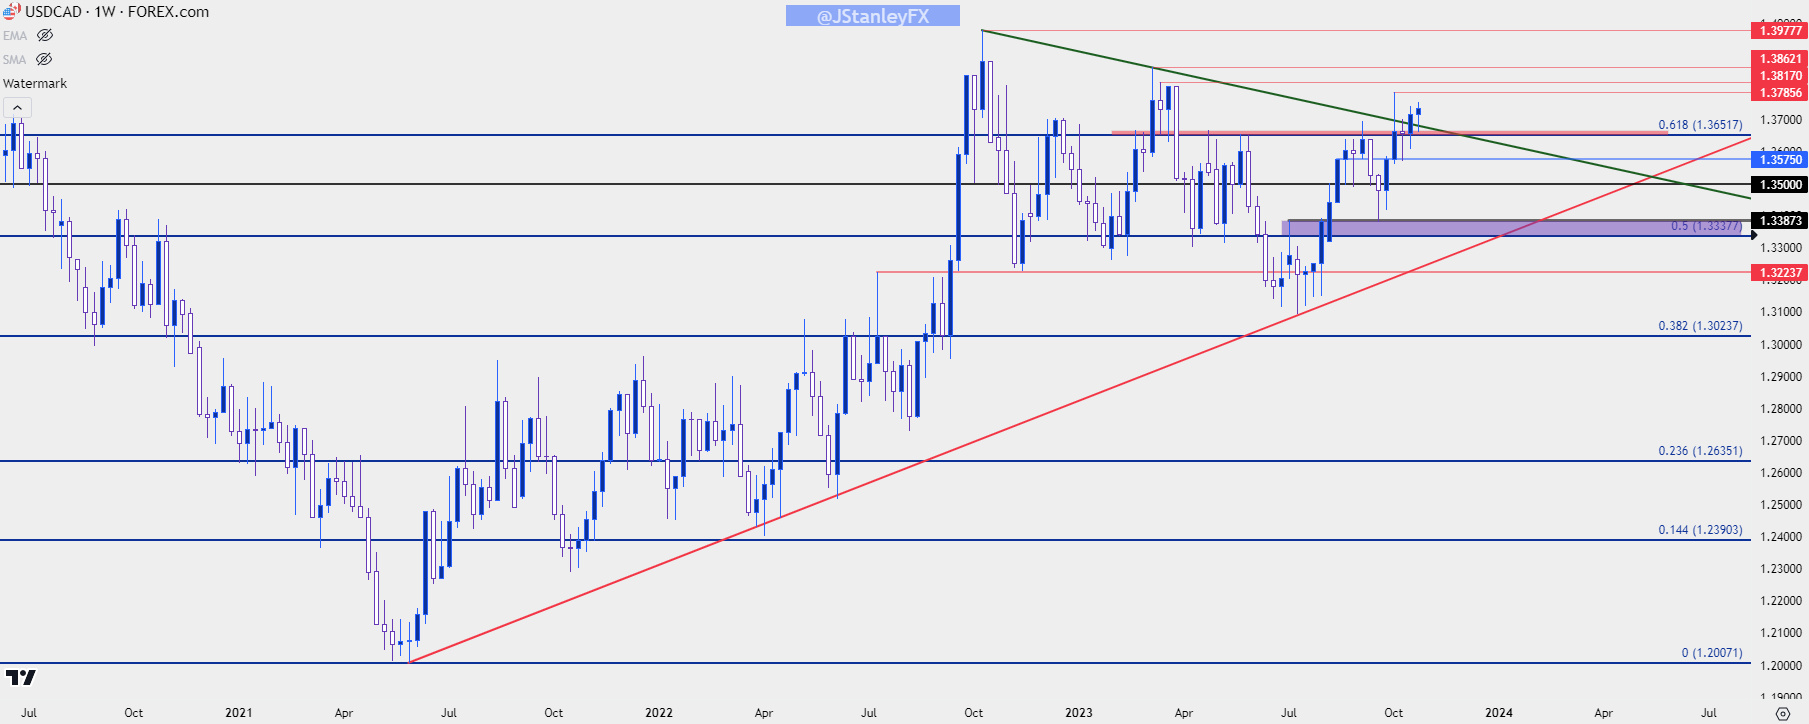 Chart prepared by James Stanley, USD/CAD on Tradingview
Below I look at the daily chart ahead of BoC tomorrow and this highlights a thicket of resistance sitting overhead as generated from those prior swing highs. This does not preclude breakouts, but it can make for a more difficult justification in chasing the move considering that price is already somewhat far away from any nearby support points.
USD/CAD Daily Price Chart
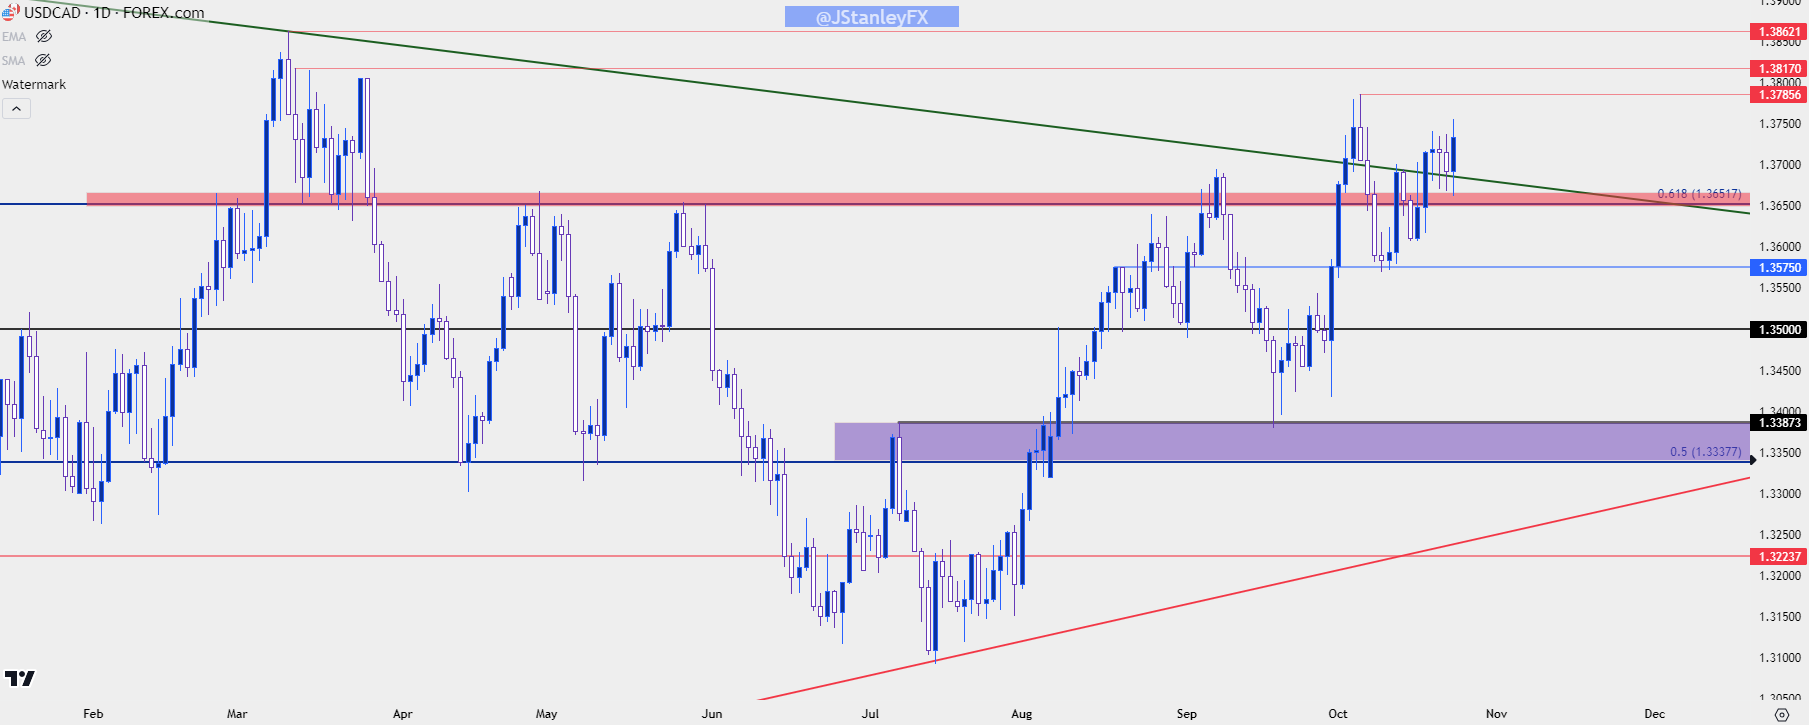 Chart prepared by James Stanley, USD/CAD on Tradingview
USD/JPY: BoJ Stand Off
The 150 level remains unfettered since the early-October test, which led to a 260+ pip reversal, which makes for a difficult backdrop on either side of the trade.
On the short side, well that’s fighting a massive trend that’s still pushed by the representative Central Bank’s monetary policy. On the long side, there’s the fear of an intervention scenario on a test of the 150.00 level. And if we do see price go above 150, for how long might the move last before something like that happens?
The difficulty with the pair is from the fact that risk management becomes challenging given that stops can quickly be run through on pullback scenarios, similar to what we saw after the last 150 test earlier this month.
There is an ascending triangle here, but there’s also more than just technical context to consider.
USD/JPY Daily Chart
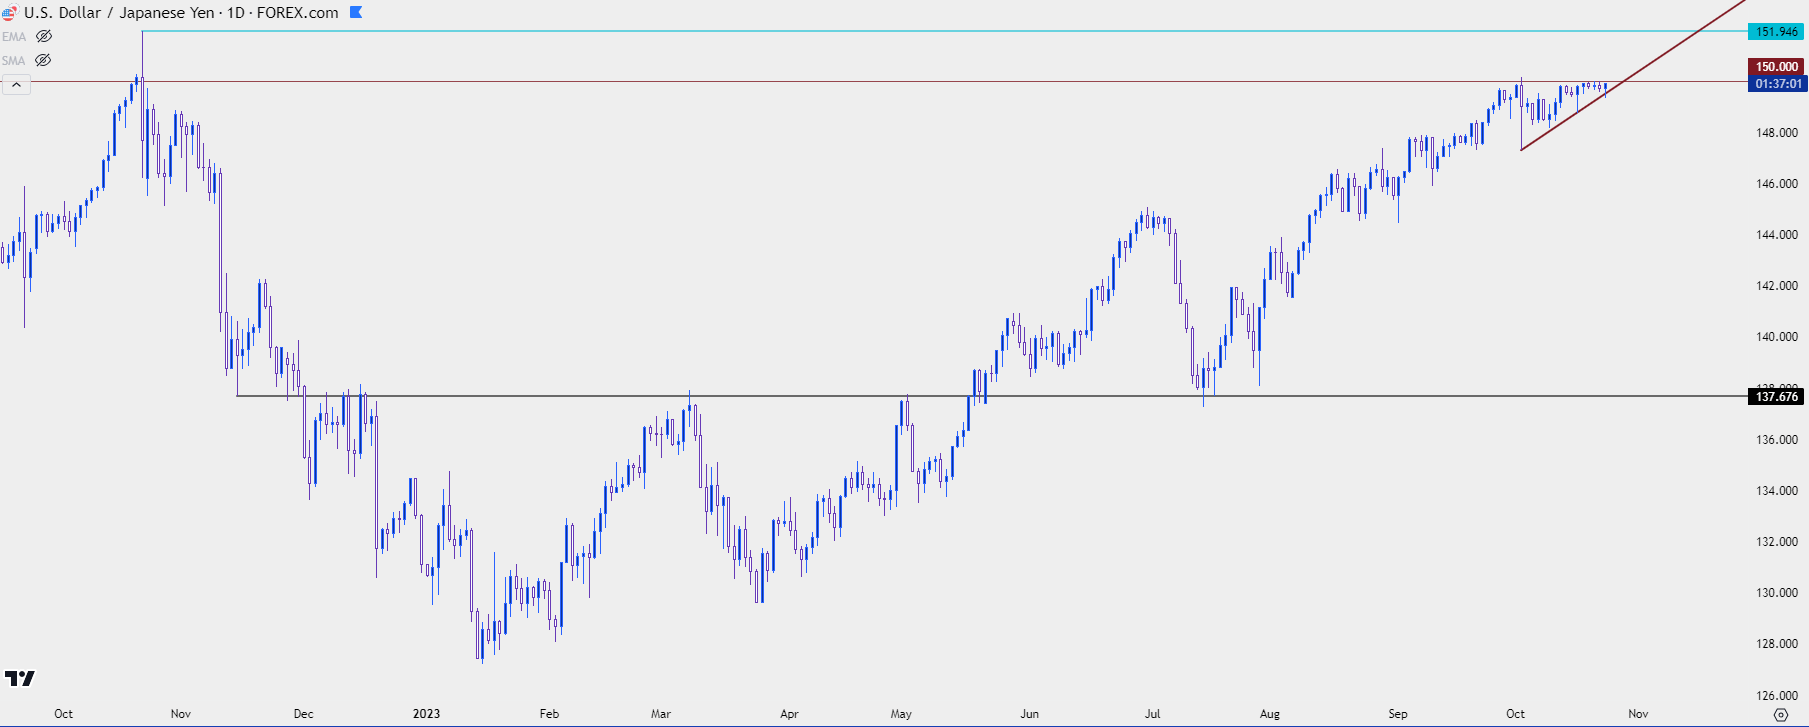 Chart prepared by James Stanley, USD/JPY on Tradingview
Gold
Gold is still seeing a strong response from bulls and price has made a fast push at the 2k level, which hasn’t come into play yet as of this writing. The concern at this point is the fact that price is already overbought on the daily chart per RSI, and this is a fast reversion from the deep oversold backdrop that was showing only a few weeks ago.
This can set the stage for reversal potential if there is a failure from bulls to run after a 2k test. If price tests the psychological level and then begins to pare back, this can open the door for some profit taking from buyers that have been driving that trend. That can led to a pullback, and depending on the way that bulls respond to support there, perhaps even something more than a pullback.
Given the calendar sitting ahead of us, logically, it’s probably going to be from something that can be attributed to that outlay, whether it’s ECB or PCE or the Fed remains to be seen. But, when volatility increases, the range of possible scenarios widens considerably on either side of the equation, and even though we’re seeing profound strength over the past couple of weeks, if early-October is any gauge, these themes can turn a dime when driven by macro risk.
Gold (XAU/USD) Daily Price Chart
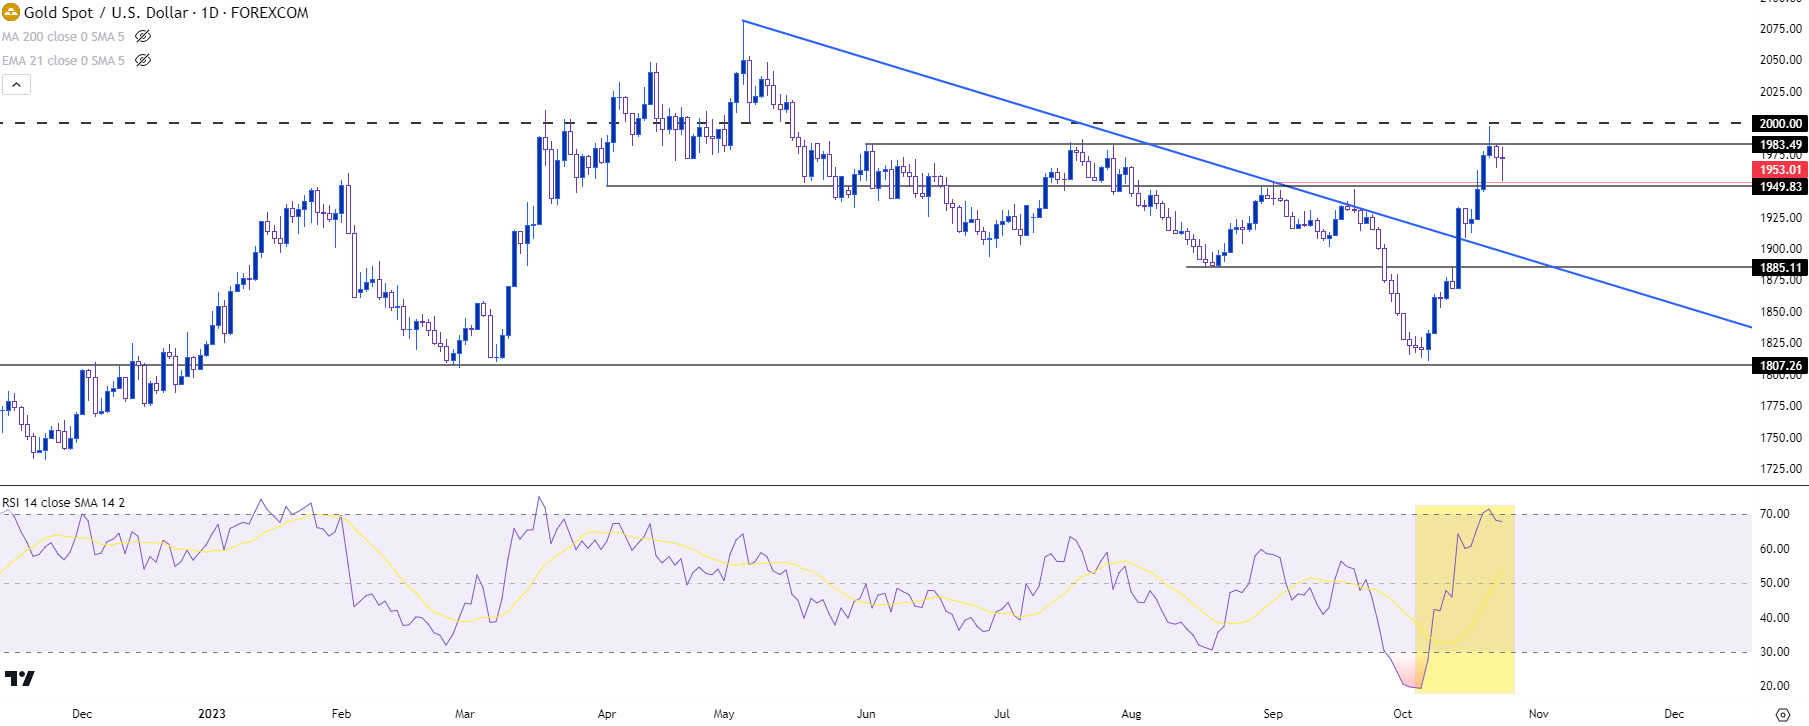 Chart prepared by James Stanley, Gold on Tradingview
--- written by James Stanley, Senior Strategist


