
US Dollar Talking Points:
- The US Dollar is grasping on to support in a zone taken from April and May swing lows.
- The next week-and-a-half is loaded with headline risk: Wednesday brings a Bank of Canada rate decision and Thursday the ECB. Non-farm Payrolls follows on Friday and then next week brings the FOMC on Wednesday.
- I’ll be discussing these themes in-depth in the weekly webinar. It’s free for all to register: Click here to register.
The US Dollar is grasping on to support as we near some significant headline risk that could be pertinent to the Greenback. Tomorrow brings a Bank of Canada rate decision with a high probability of a rate cut; and a rate cut has long been expected for the ECB meeting the day after.
Non-farm Payrolls is of interest, as it was last month’s headline miss, the first since November, that really gave USD-bears a shot-in-the-arm, which was followed by the CPI print a couple weeks later.
And then next week brings the FOMC rate decision and while there’s scant expectations for any rate moves there, the big question will be whether they start to highlight the possibility of a cut in July. If NFP prints poorly enough, they could have an open door to begin that discussion and if that takes place, USD-bears could get another shot of motivation to continue the lower-lows and lower-highs that have so far built from the May 1st rate decision.
In the USD, the same 103.92 level that I’ve been tracking has yet to be taken-out. That was the swing low in April, which led to the bullish breakout on April 10th after the release of CPI data. That trend pushed all the way to 106.50 which was tested twice before bears were able to muster a more notable pullback. The trend from that ran down to a May low of 104.08, helping to create the topside of the zone on the chart below.
US Dollar Daily Price Chart
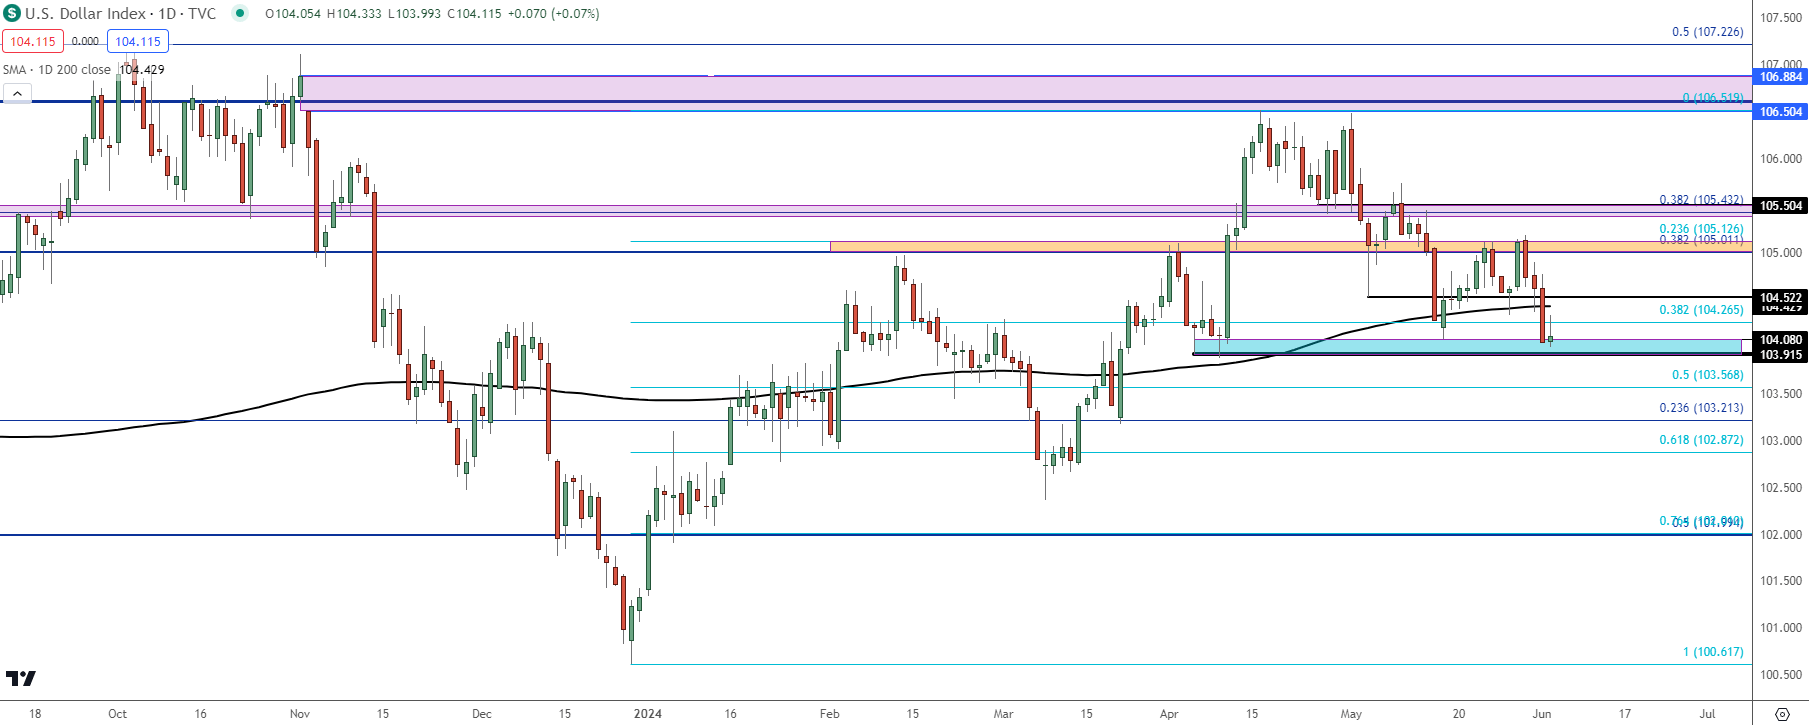 Chart prepared by James Stanley; data derived from Tradingview
EUR/USD: Rallying into the (Expected) Rate Cut
I wrote about EUR/USD in the article “EUR/USD Tempts Breakout Ahead of ECB.” That breakout has since hit and price has set a fresh two-month high. EUR/USD has been pushing a bullish trend since finding support at 1.0611 in mid-April.
That support is at a big spot on the chart as that’s the 38.2% Fibonacci retracement of the 2021-2022 major move. This is the same Fibonacci setup that caught the high last year at the 61.8% marker at 1.1275, and the same from which the 50% mark resides at 1.0943. This is shown in blue on the below chart.
EUR/USD Weekly Price Chart
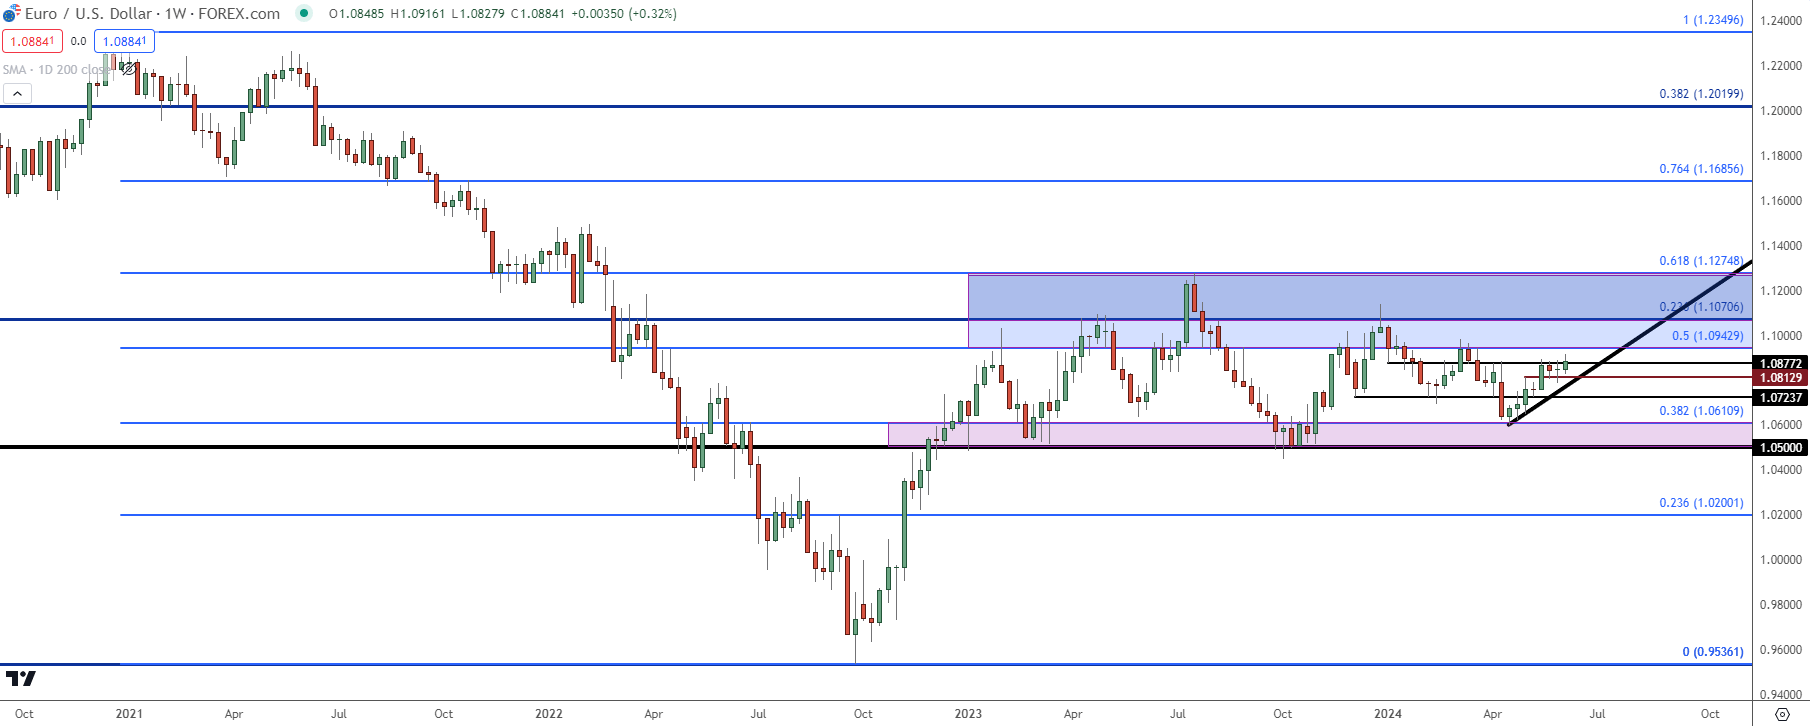 Chart prepared by James Stanley, EUR/USD on Tradingview
On a shorter-term basis, EUR/USD has been testing the same 1.0870-1.0877 zone that I’ve been talking about for a while now. This was an area of prior support that turned into resistance, and this is the zone that bulls had trouble leaving behind during the mid-May breakout. It’s since shown multiple resistance inflections on the daily chart until yesterday’s hammer formation drove right through it, leaving behind an extended underside wick.
A similar test showed earlier today but, again, bulls defended the zone. This keeps buyers in-control and points to the 1.0943 level for the next spot of resistance, after which the 1.1000 handle comes into the picture.
EUR/USD Daily Price Chart
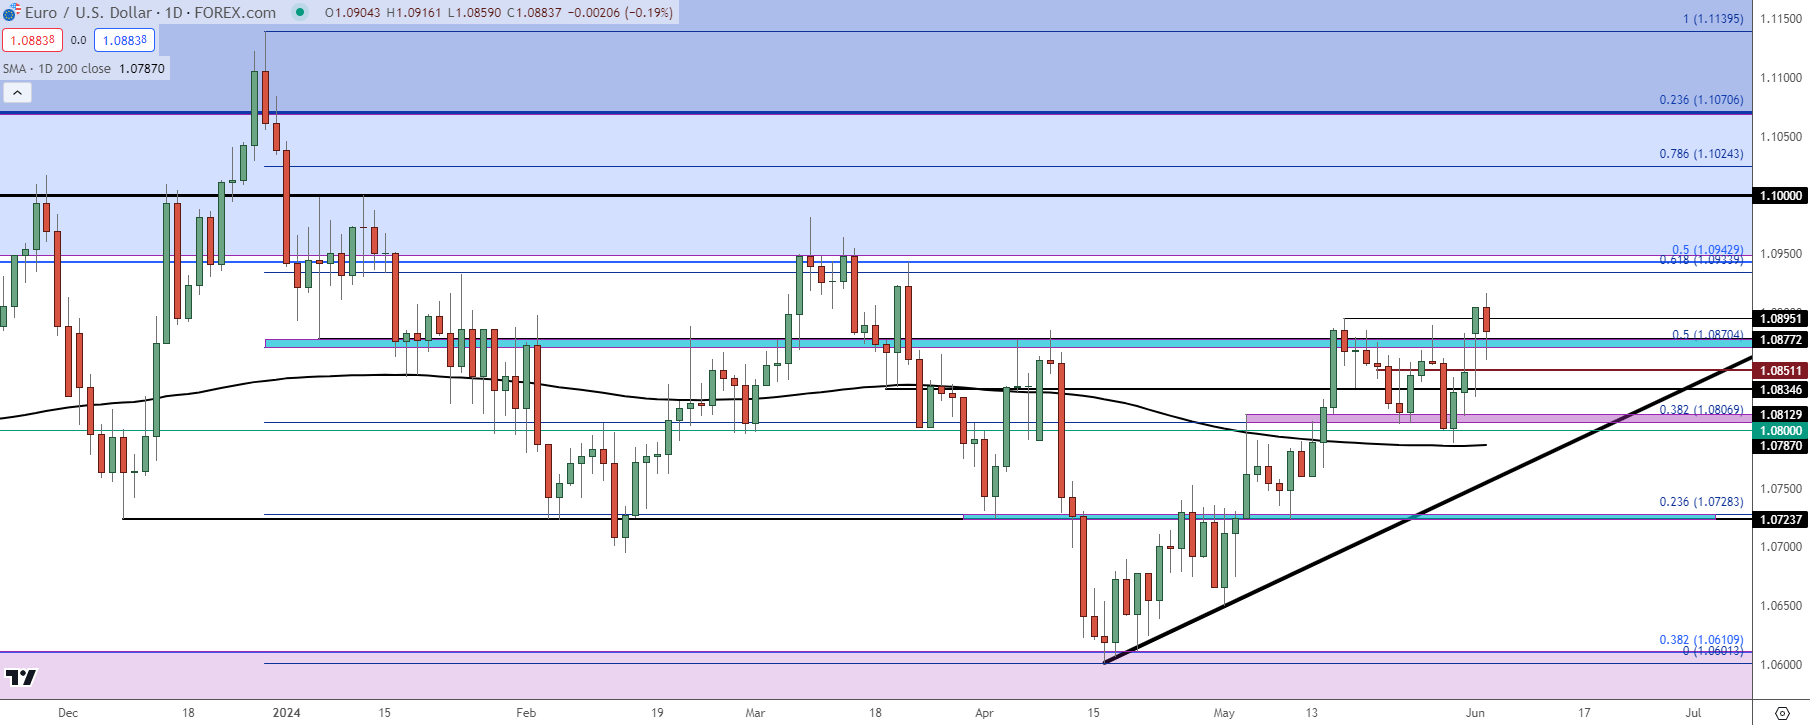 Chart prepared by James Stanley, EUR/USD on Tradingview
GBP/USD
For USD-weakness scenarios, GBP/USD may still be a more attractive candidate. I’ve been tracking this one for Dollar-weakness since May and compared to the above chart in EUR/USD, the GBP/USD bullish trend has been better defined, in my opinion. So far today price has set a fresh two-month high and pulled back to and found support at the 1.2750 level. If that can hold, it will constitute a higher-low above yesterday’s test of 1.2692 which I had looked at in the webinar in the prior week.
For resistance, the 1.2896 area could prove problematic. That’s pulled from a longer-term Fibonacci retracement which helped to set the high in early-March.
GBP/USD Daily Price Chart
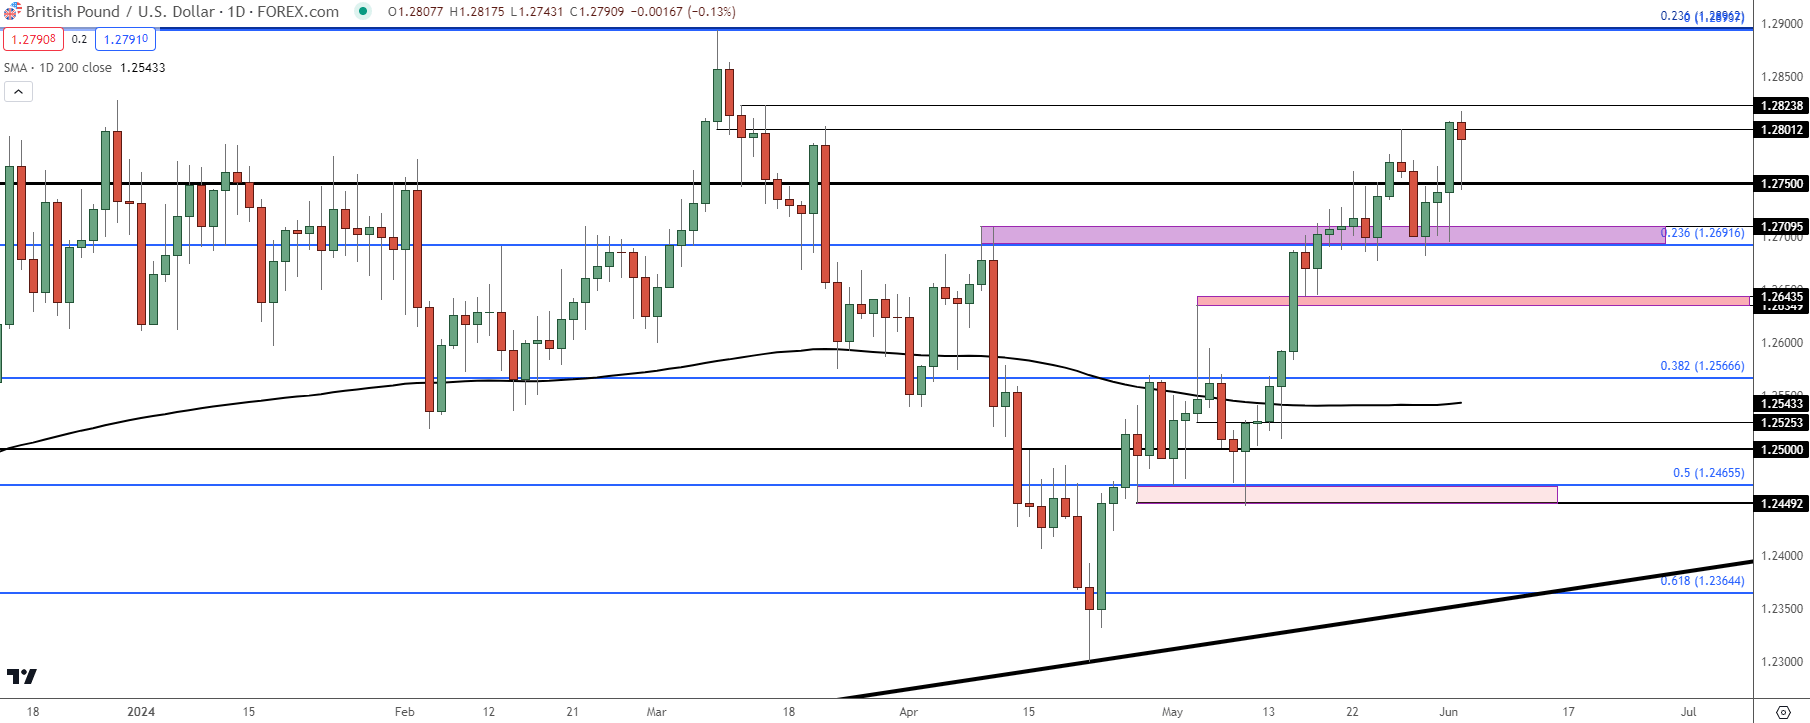 Chart prepared by James Stanley, GBP/USD on Tradingview
USD/CAD
For USD-strength scenarios, I’m still partial to USD/CAD as one of the more attractive major FX pairings. While the US may be nearing a rate cut, the Bank of Canada seems to be closer, and we may even hear as such at the Wednesday rate decision.
From the chart, however, the pair has an open door for USD-strength as there’s been a hold of support at prior resistance, around the 1.3600 level; and price remains above the 200-day moving average while the same can’t be said about DXY, at the moment.
There’s resistance at 1.3690 that’s already in-play, with 1.3738 above that followed by a zone around 1.3780. And above that is a longer-term zone of resistance potential between 1.3850 and 1.3900.
USD/CAD Daily Price Chart
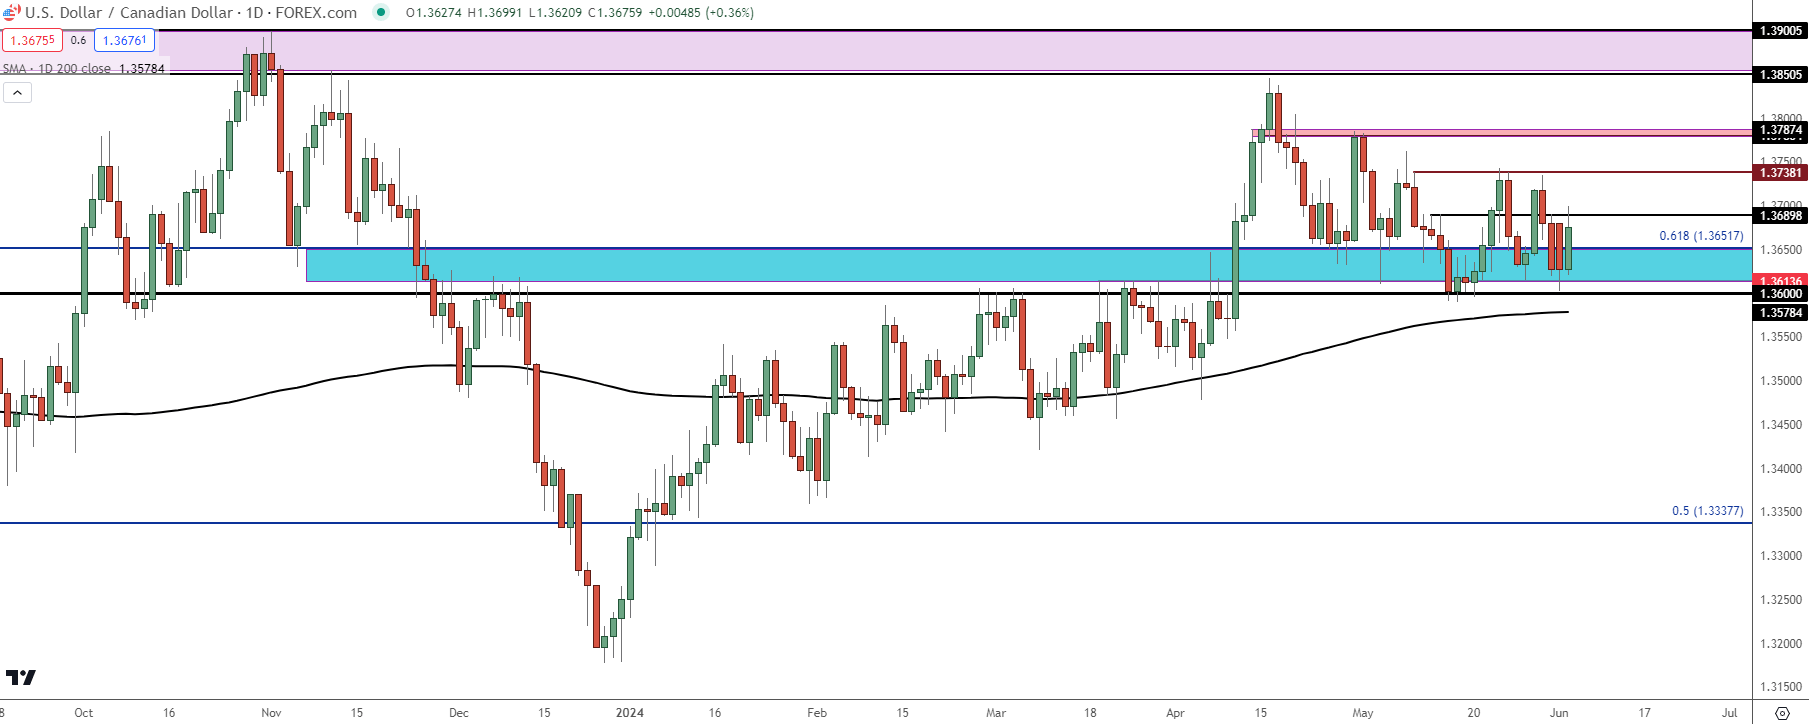 Chart prepared by James Stanley, USD/CAD on Tradingview
USD/JPY
USD/JPY is currently working on its second consecutive daily decline, which hasn’t happened since the week of the intervention around the May open.
What I think remains of interest here is the prospect of a deeper USD sell-off, which could motivate carry traders that have driven the trend for much of the past three years to second-guess holding long. It was USD reversals in Q4 of 2022 and 2023 that really pushed the short side of USD/JPY, even with rollover tilted the long side of the pair.
If NFP comes out soft and the Fed opens the door to a July cut, that could be motivation for carry traders to duck and run, and that can lead to a strong sell-off as carry trades looking to bail on the trend aren’t usually precious about price. That’s what led to strong sell-offs on the daily chart on November 10th of 2022 and November 14th of 2023: Below-expected CPI prints prodded USD/JPY bulls to take profits, which leads to supply and lower prices.
I think what we’re seeing in USD/JPY at the moment is the possibility of a larger USD sell-off getting priced-in; and that’s something that can scare carry traders out of positions. The big question is what happens at supports: There’s a possible spot around 153.60 and then the 150-152 key zone comes into play. There’s a couple of spots of interest inside that zone at 150.82 and 151.57.
USD/JPY Daily Price Chart
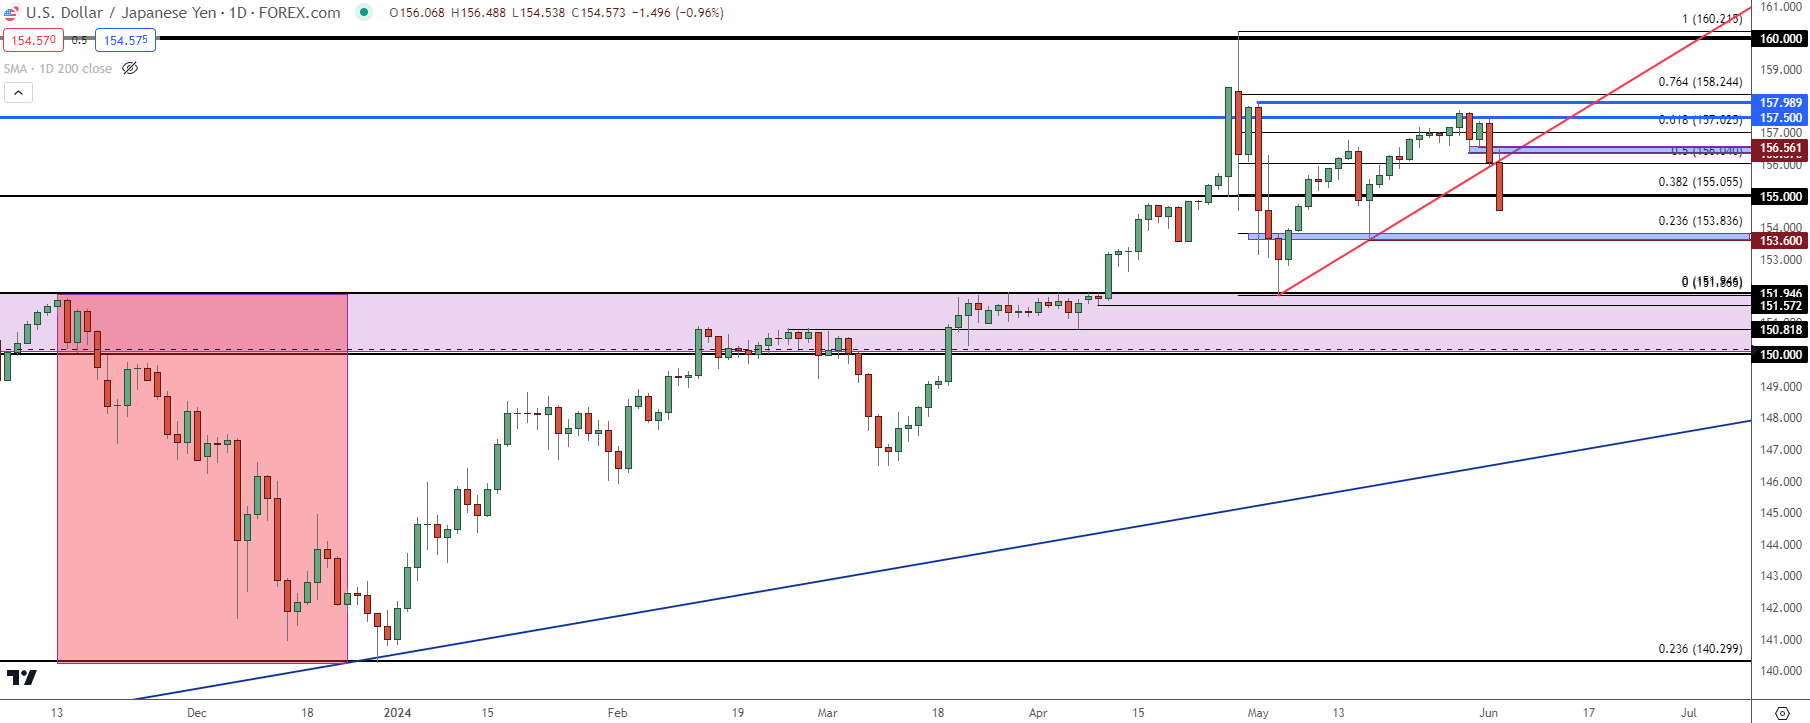 Chart prepared by James Stanley, USD/JPY on Tradingview
Gold
The monthly chart of Gold isn’t very encouraging if you’re a bull as there’s been two long, extended upper wicks print each of the past two months. This shows bulls’ exhaustion and could be highlighting a possible pullback scenario, although I remain questionable on the timing which I’ll get to in a moment.
Spot Gold (XAU/USD) Monthly Price Chart
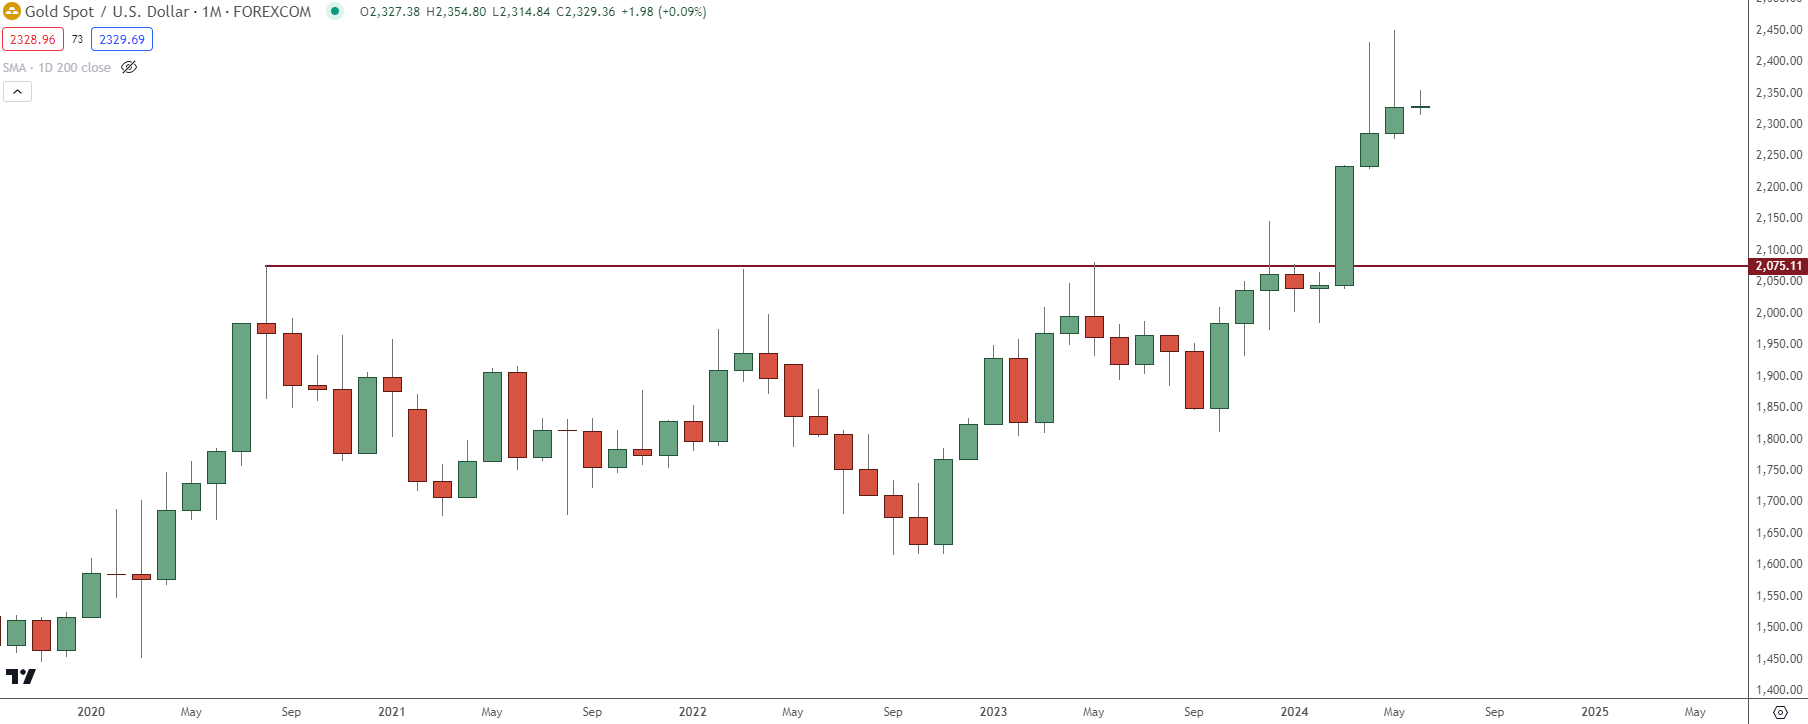 Chart prepared by James Stanley, Gold on Tradingview
While bulls may be losing steam at tests of resistance or fresh highs, they’ve remained as active around support. So, the fact that we got the extended upper wick in May after the same thing in April highlights the fact that bulls haven’t yet completely relinquished control.
It does, however, put more focus on support, which from the weekly chart below shows around 2326 and then again around the 2300 level.
Spot Gold (XAU/USD) Weekly Price Chart
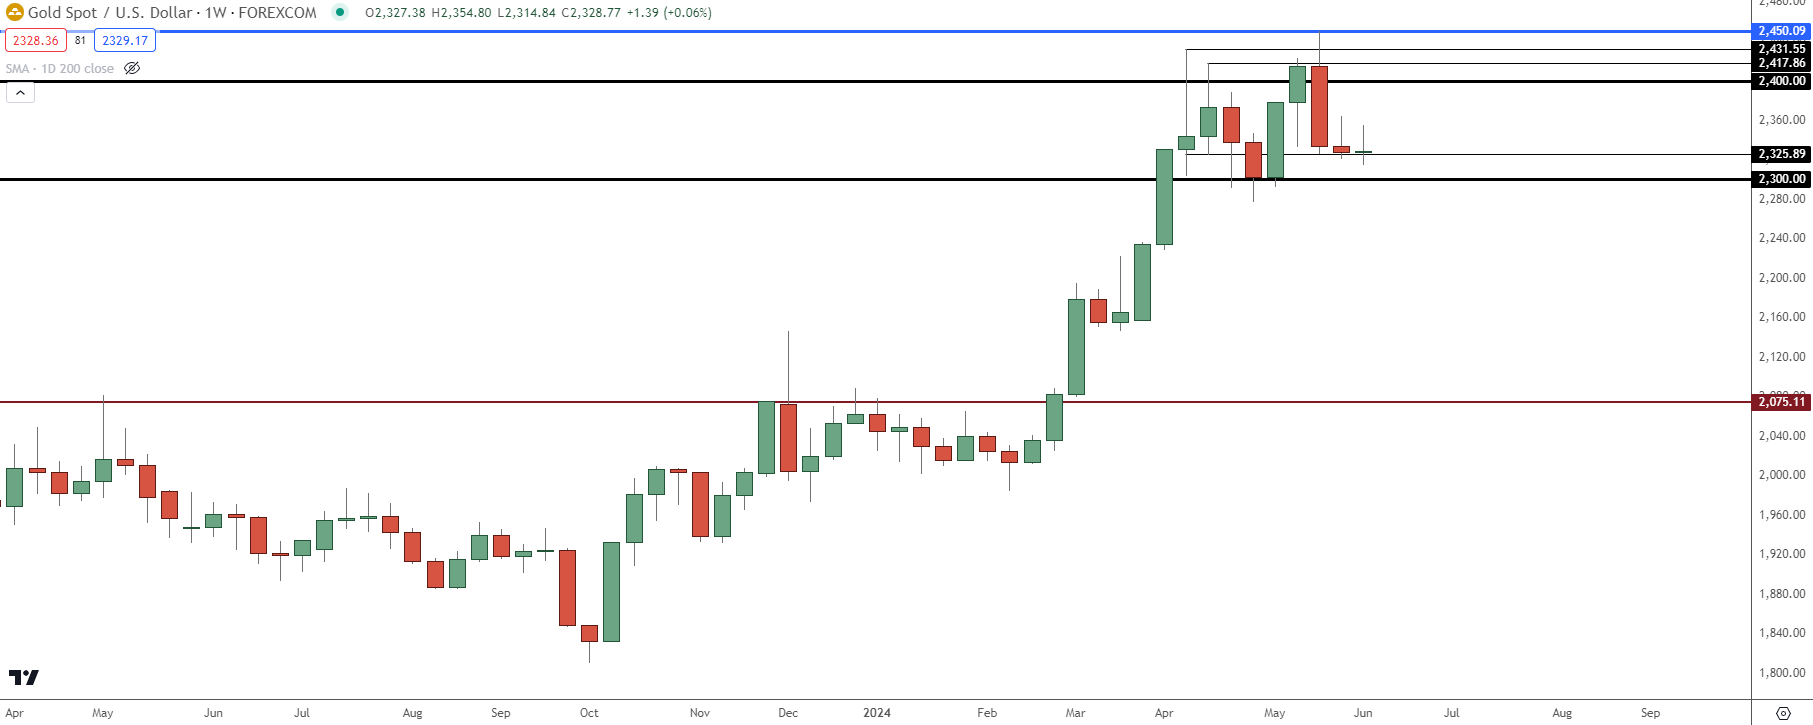 Chart prepared by James Stanley, Gold on Tradingview
Gold shorter-term has continued to work with many of the same support/resistance zones that were in-play last month.
Current support is being tested in the 2319-2326 zone, which was holding resistance in early-May. Above that, the 2350-2354 zone held the highs yesterday after doing the same late last week. If bulls can force a break, there’s another spot of possible resistance as taken from prior support running from 2372-2378.
Spot Gold (XAU/USD) Daily Price Chart
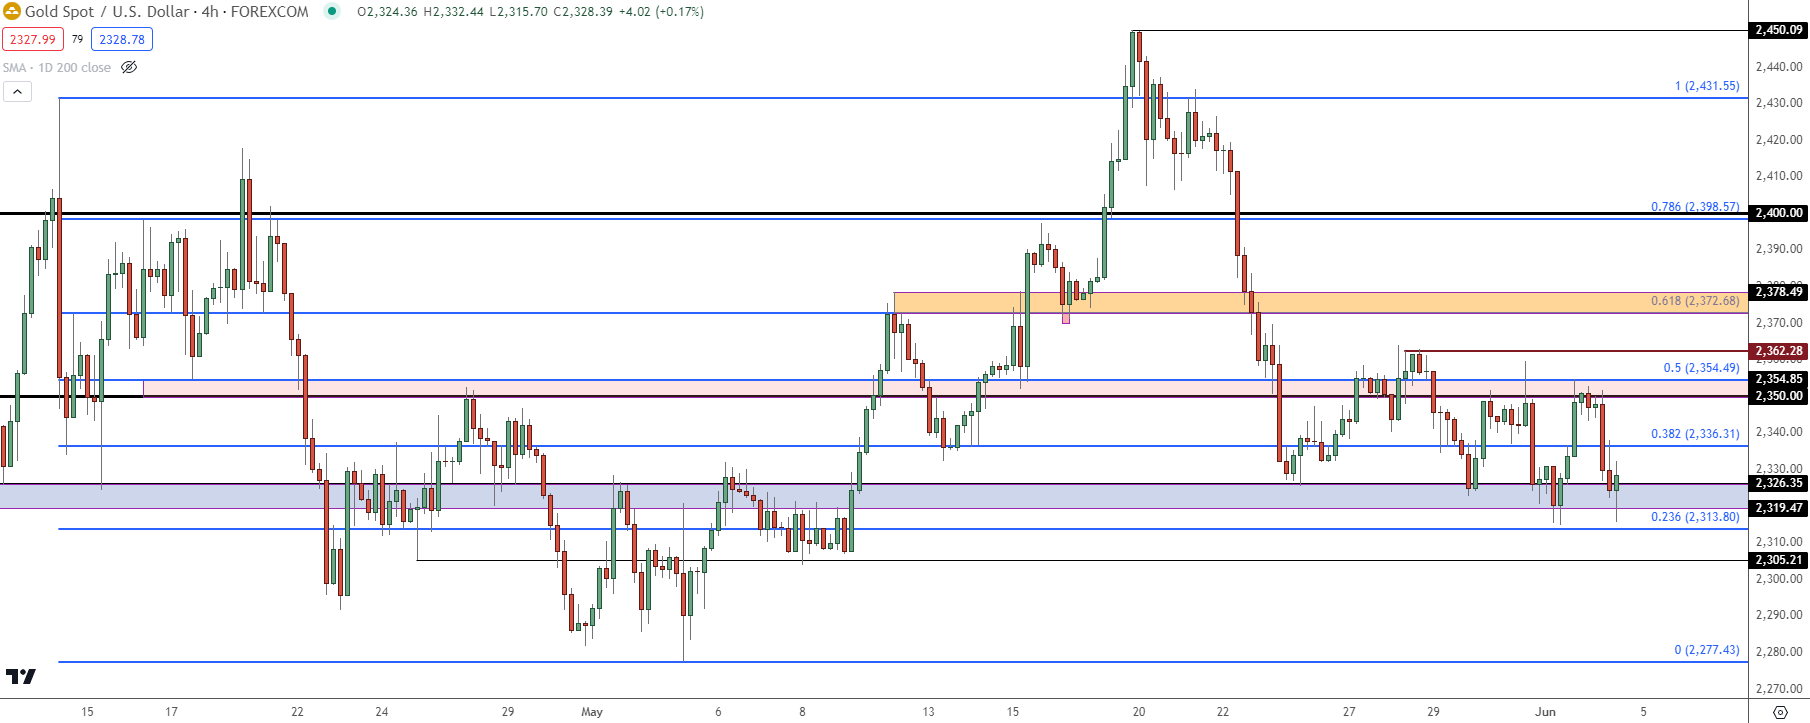 Chart prepared by James Stanley, Gold on Tradingview
--- written by James Stanley, Senior Strategist


