
US Dollar Talking Points:
- From the weekly chart it’s been an indecisive week in the US Dollar, but that doesn’t tell the story as there was a battle taking place between support and resistance.
- The big US item for next week is Friday’s Non-farm Payrolls report, but there’s also rate decisions out of Canada and Europe that could take a toll on the USD/DXY.
- I’ll be discussing these themes in-depth in the weekly webinar. It’s free for all to register: Click here to register.
It’s been one of those weeks that’s all about the details.
The weekly bar of the US Dollar is currently showing as a spinning top but that doesn’t really tell the story of the currency’s price action. Last week showed a strong response to resistance at the 105-105.13 zone, which led to a fast snap back that held through this week’s open.
On Tuesday, a key support test began when DXY tested both the 200-day moving average and the bullish trendline connecting last December and this March’s swing low. Also of interest is the fact that this bounce took place above the prior higher-low ahead of the April breakout, which retained a case for bullish structure in USD.
Wednesday showed a strong continuation of the bounce that began on Tuesday; but once again, the 105.13 level wasn’t willing to budge and that led to another pullback that hastened on the release of the Friday PCE report. But, again, support showed at the 200-day moving average which has led to a bounce. And notably, the low from Friday held above the low from Tuesday, allowing for another higher-low.
US Dollar Daily Price Chart
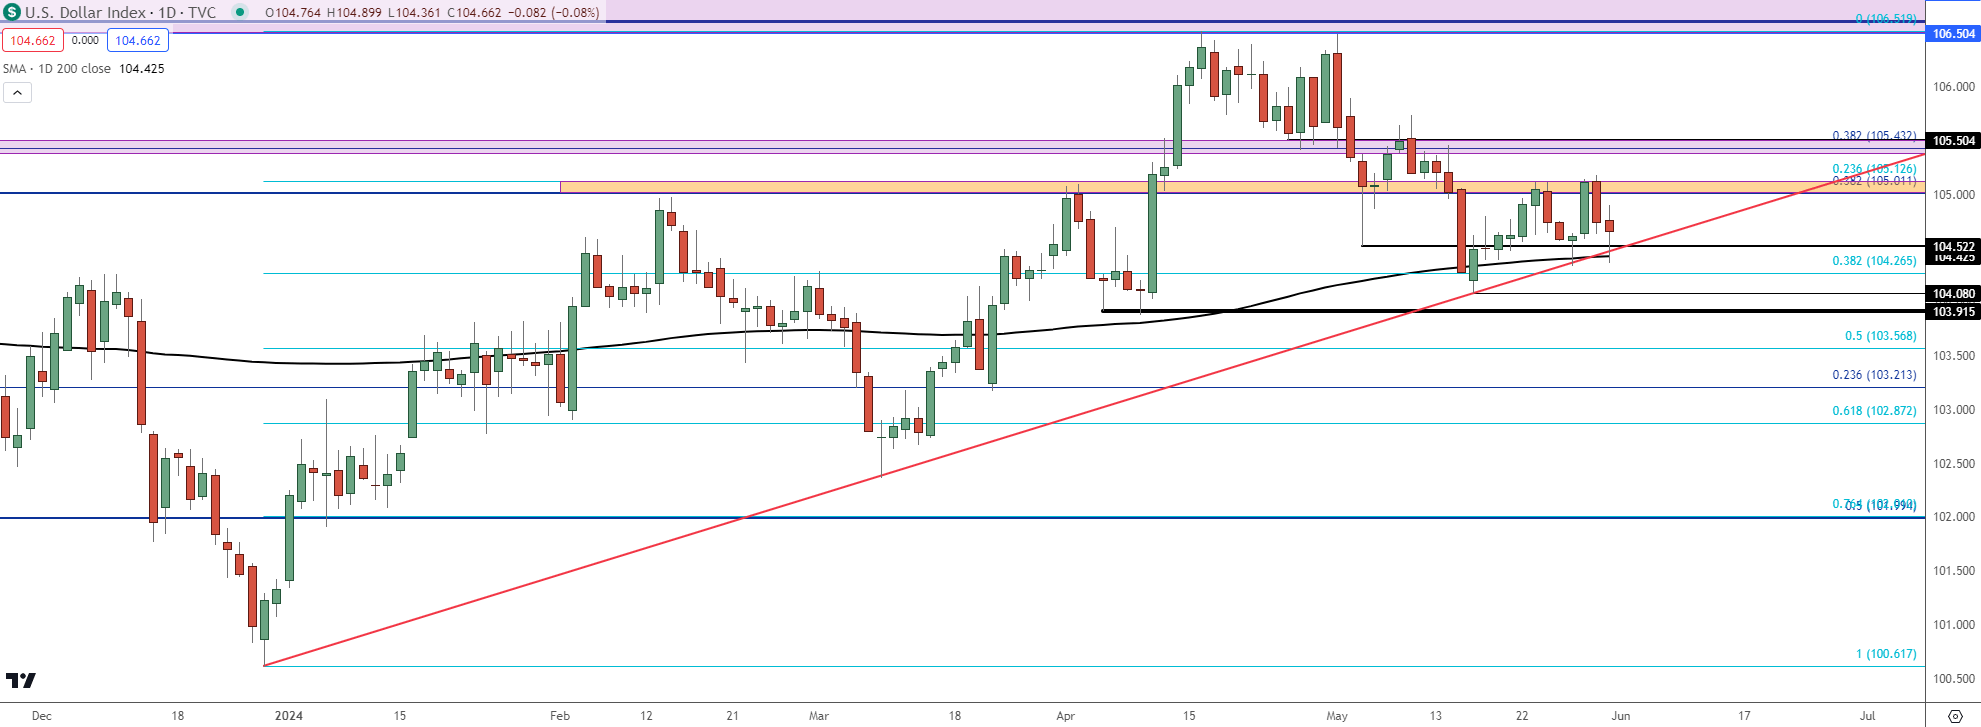 Chart prepared by James Stanley; data derived from Tradingview
Taking a step back, this highlights the range that’s been in-place in the USD for 17 months now, since the 2023 open. This also begins to tie in to fundamental factors, as the European Central Bank is expected to cut rates next week.
To this point, US data has remained relatively strong compared to other economies and that type of deviation would normally allow for trends in major FX pairs. But, given the still-dovish stance of the Fed there’s been an obstruction to that which has allowed these ranges to remain in-place across a number of major currency pairs.
In the weekly chart of the USD, the big question at this point is whether buyers can hold a higher-low to set up another test of range resistance.
US Dollar Weekly Price Chart
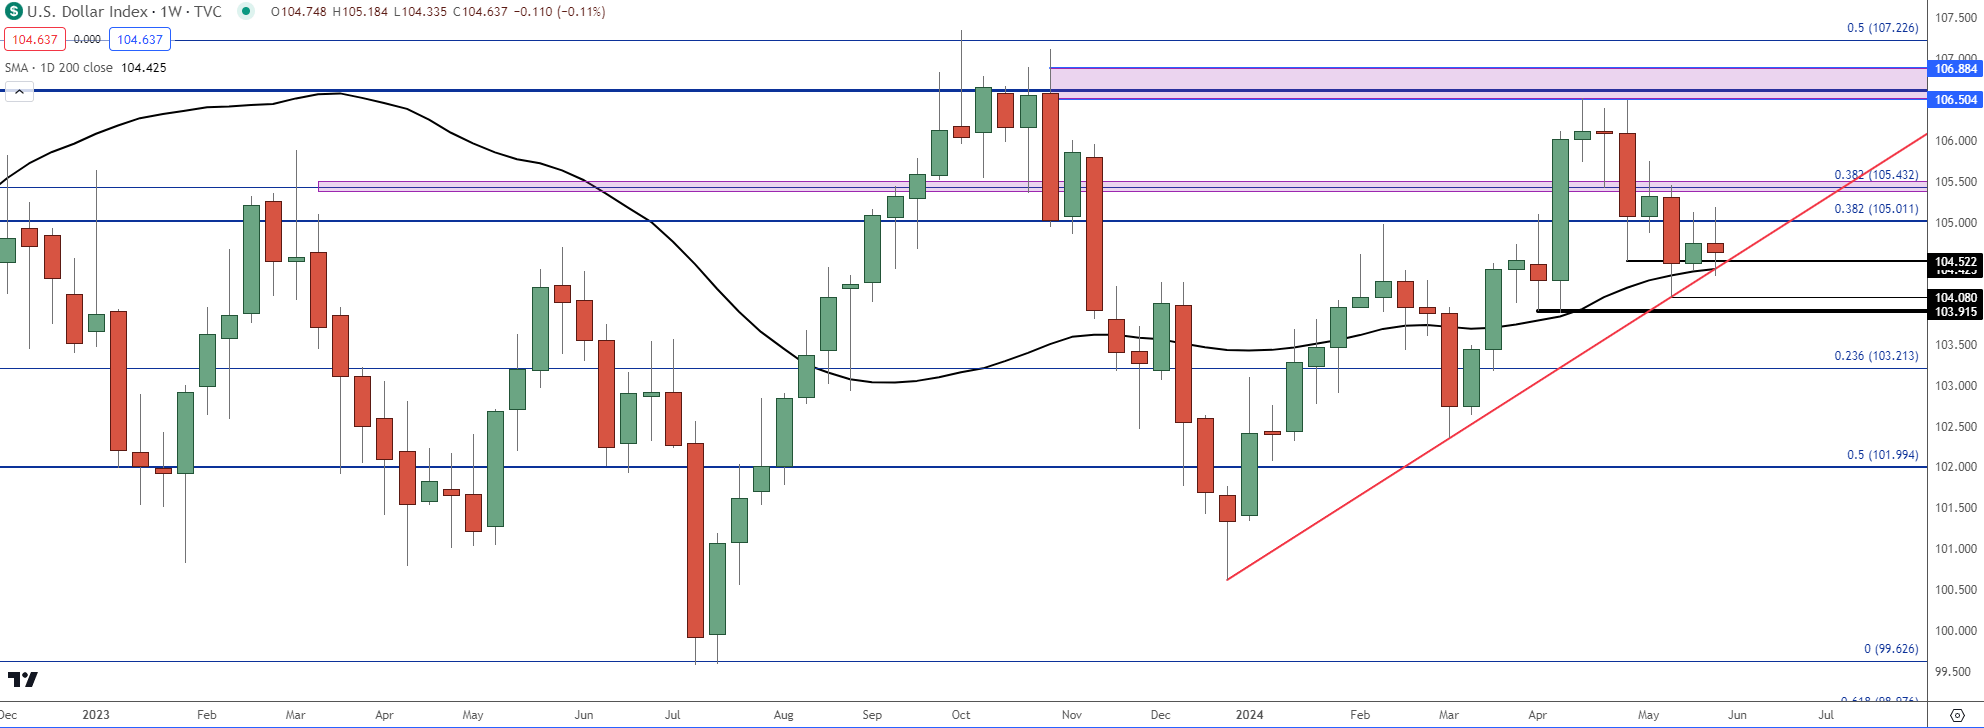 Chart prepared by James Stanley; data derived from Tradingview
From the four-hour chart, we can see that weekly grind in greater detail but the point of interest here is the fact that price made both a slightly higher-high and a slightly higher-low this week.
The Core PCE report wasn’t necessarily bad, but it did indicate stall as that data point came in at 2.8% for a third consecutive month.
Otherwise, it was an encouraging month of May for the FOMC that’s been talking up the possibility of rate cuts even since late last year. The month started with the FOMC rate decision on the 1st of the month and that drove a precipitous drop in the US Dollar from the 106.50 level, which was pushed by the NFP report a couple of days later as the headline NFP number printed below expectations for the first time since last November.
It was the CPI report on the 15th that really pushed the move but the USD set a low a day later, and trended-higher in the back-half of the month. For US data, this puts emphasis on next week’s NFP report and if that comes out above-expectations, there could be further pricing-out of rate cuts to drive greater USD-strength.
US Dollar Four-Hour Price Chart
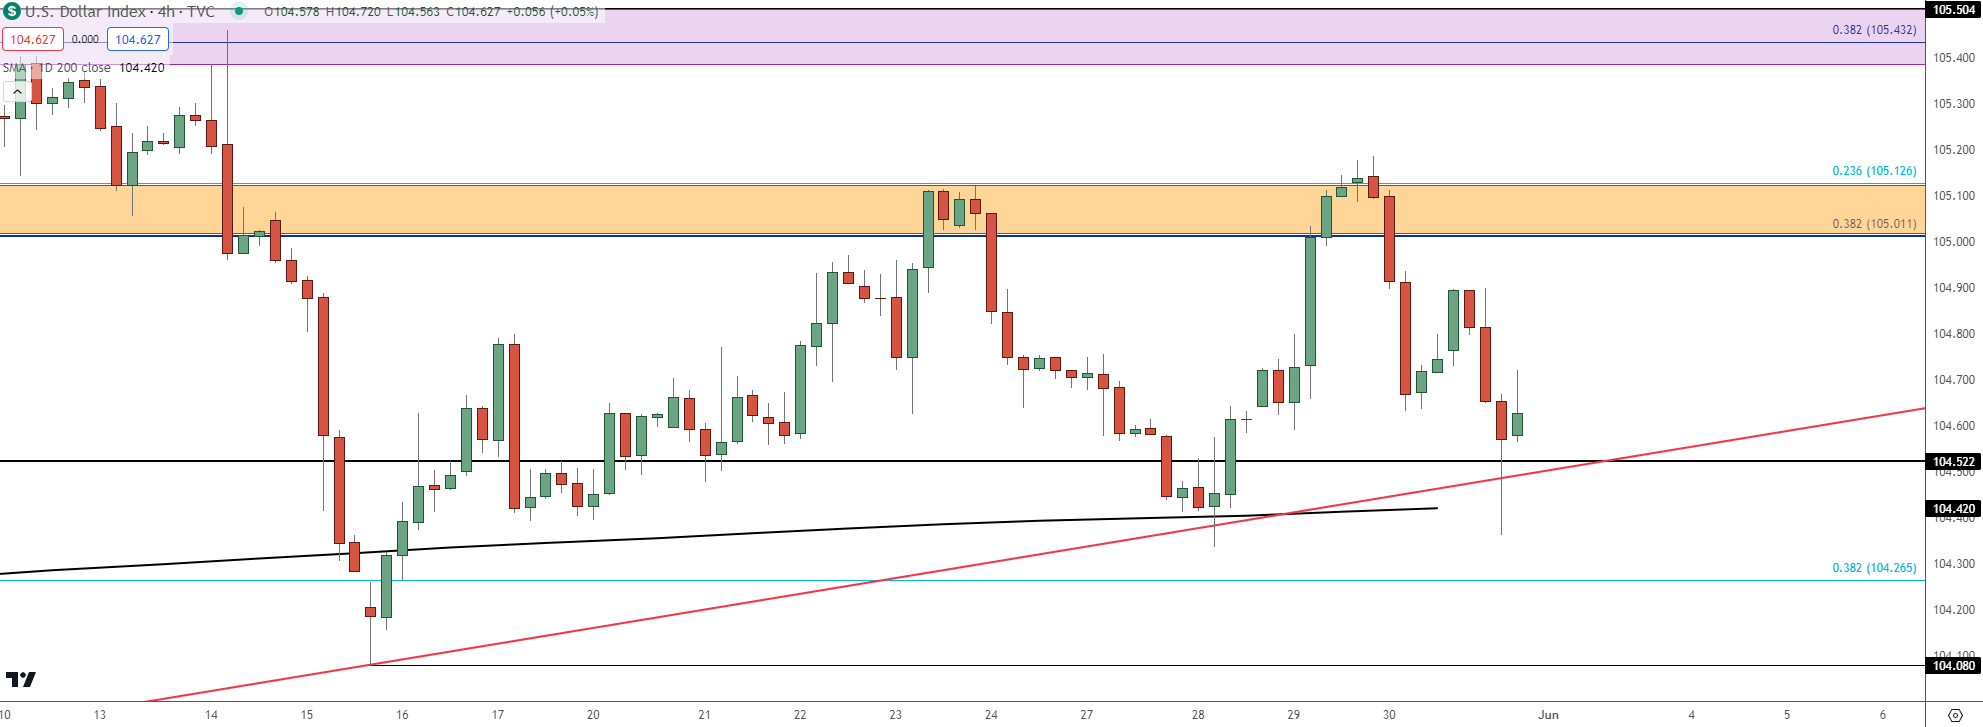 Chart prepared by James Stanley; data derived from Tradingview
EUR/USD
The European Central Bank stopped providing forward guidance for rates and that’s been a benefit to the Euro. The EUR/USD pair has similarly held in a range for the past 17 months but since the mid-April test of Fibonacci support at 1.0611, bulls have been in-control.
There’s been an element of stall over the past three weeks as you can see from the below bearish trendline holding the highs on the past three weekly bars. There’s also been a hold of support at the 200-day moving average thus far.
EUR/USD Weekly Price Chart
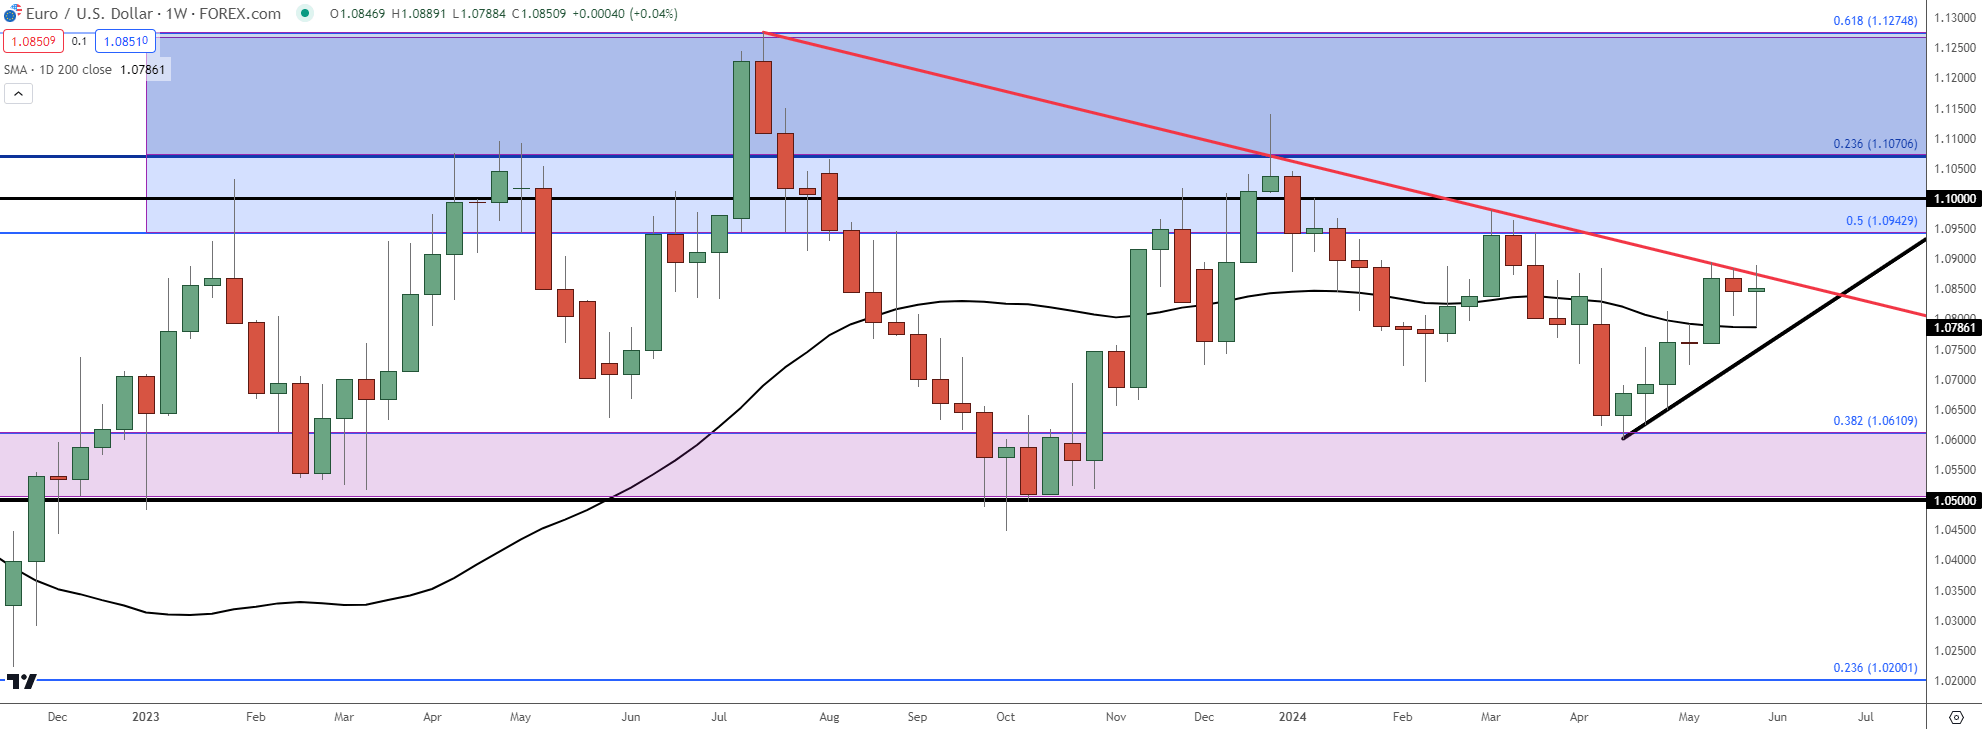 Chart prepared by James Stanley, EUR/USD on Tradingview
Like the USD above, the weekly indecision doesn’t really tell the story here in EUR/USD.
Support held in the prior week at the 1.0807 Fibonacci level, leading into a bounce into the end of the week that held through this week’s open. But Tuesday showed a response to resistance as price finished with a gravestone doji on the daily chart and then pushed down to a lower-low on Thursday.
Buyers posed a bounce just above the 200-dma but the bounce from that similarly showed a lower-high at the same 1.0870-1.0877 resistance zone.
With the ECB expected to cut rates next Thursday, the big question is what Lagarde says about forward-looking conditions and how quickly they’re looking to push another cut. Given the Euro’s 57.6% allocation of the DXY quote, the result of that will likely bring drive to the USD, one way or the other.
EUR/USD Daily Price Chart
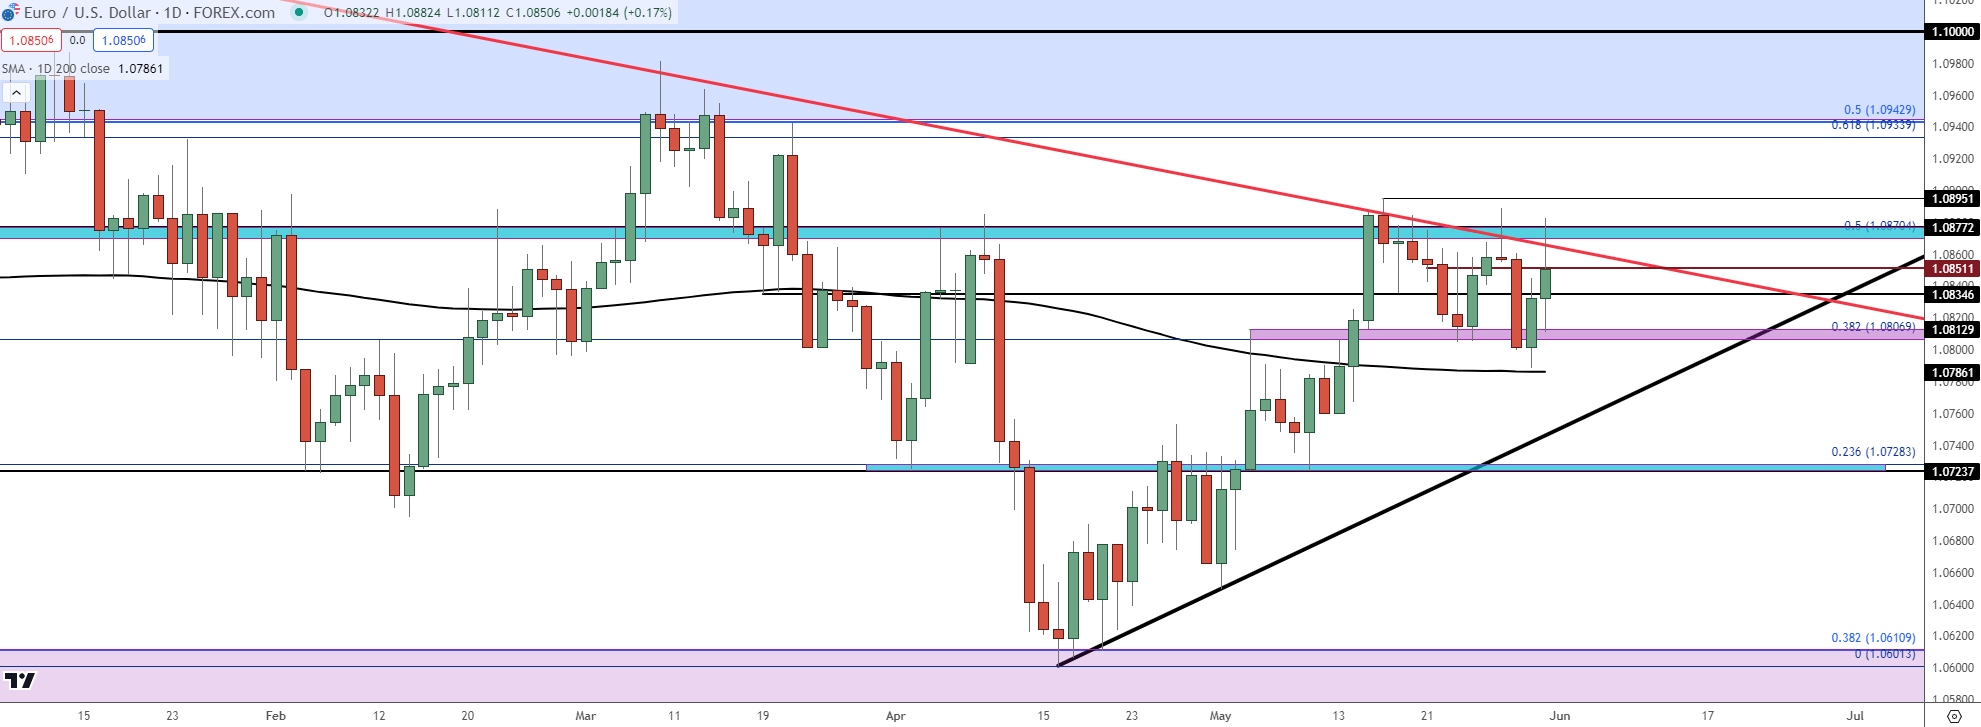 Chart prepared by James Stanley, EUR/USD on Tradingview
GBP/USD
I’ve been saying since early-May that for USD-weakness scenarios, GBP/USD is one of the more attractive backdrops in my opinion. Core CPI remains higher in the UK than the US and there’s similar questions of when the Central Bank may actually be able to begin cutting rates.
More interesting than that in my opinion, however, is price action and this is a story that goes back a few weeks now.
At the BoE rate decision on May 9th, the bank sounded similarly dovish as they have been. And initially GBP/USD was selling off and pushing below the 1.2500 level. But that move didn’t last for long as buyers showed up at the prior swing low of 1.2450 and pushed a strong response. That daily candle finished as a hammer, and that led into continuation with a major jump on the 15th of the month after the release of US CPI.
Bulls continued to push the move and this week saw re-engagement of the 1.2801 resistance level which held the highs. The pullback from that held support at prior resistance, in the same 1.2692-1.2710 zone I looked at in the Tuesday webinar. And, so far, bulls have held the pullback at a higher-low.
If we do see a USD breakdown next week as the longer-term range fills-in, GBP/USD could remain an attractive venue.
GBP/USD Daily Price Chart
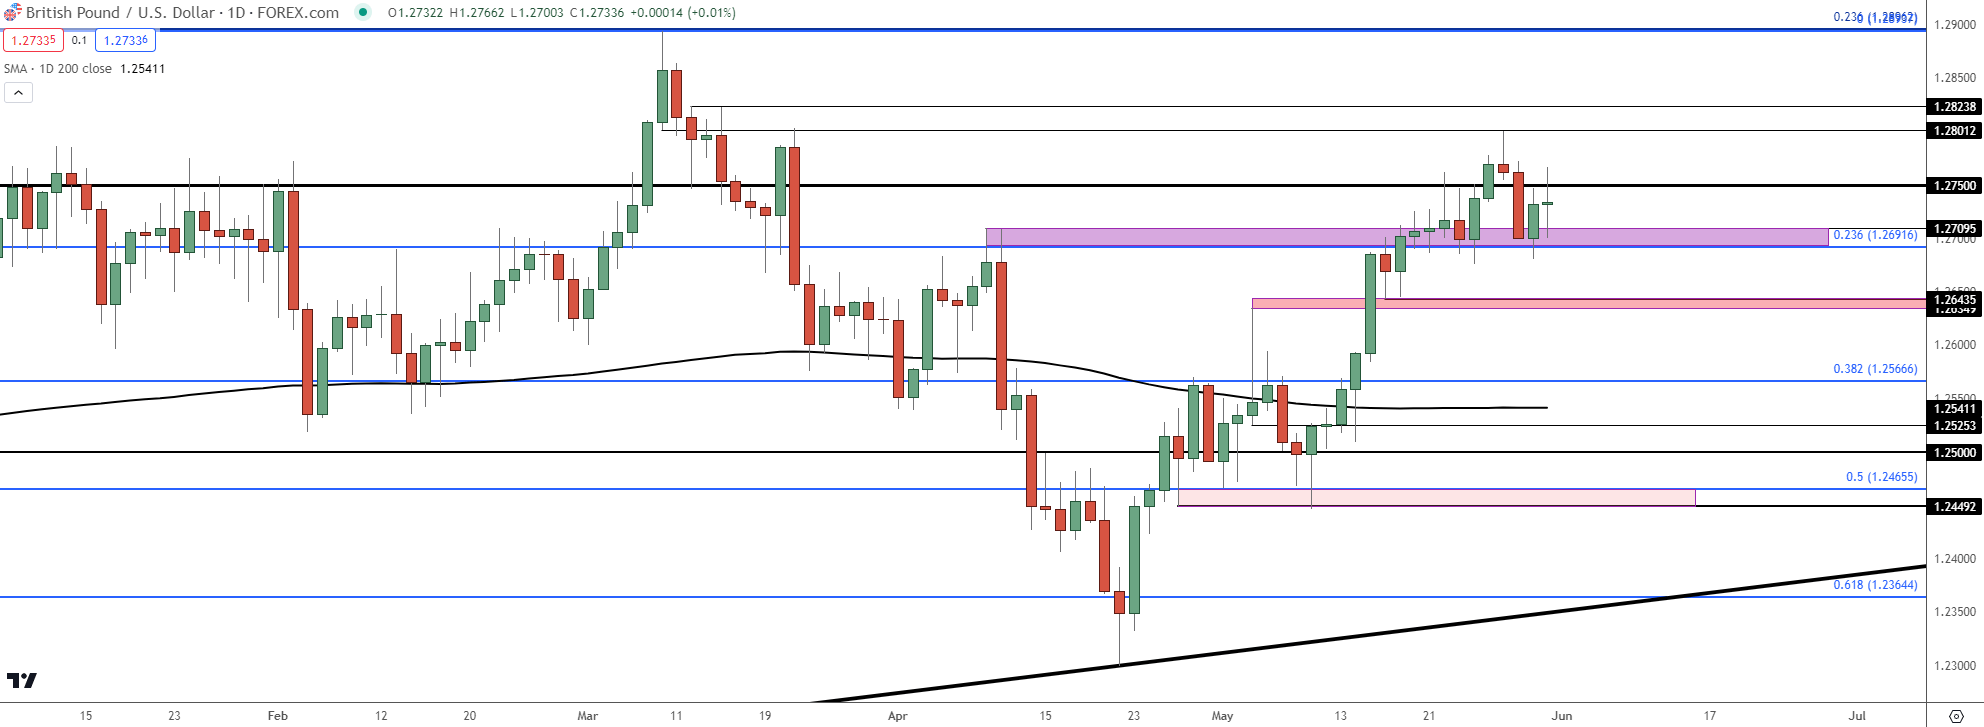 Chart prepared by James Stanley, GBP/USD on Tradingview
USD/CAD
On the other side of the USD, I’ve been tracking USD/CAD as one of the more attractive pairs for scenarios of USD-strength.
While questions remain around when the Fed might be able to cut, economic data in Canada hasn’t been able to keep up with the US and there’s a legitimate chance of the Bank of Canada cutting rates at their rate decision next Wednesday.
The pair has continued to hold support in a key zone of support from prior resistance. And this week, so far, has seen two higher-lows develop above the 1.3600 swing low of the week before.
USD/CAD Daily Price Chart
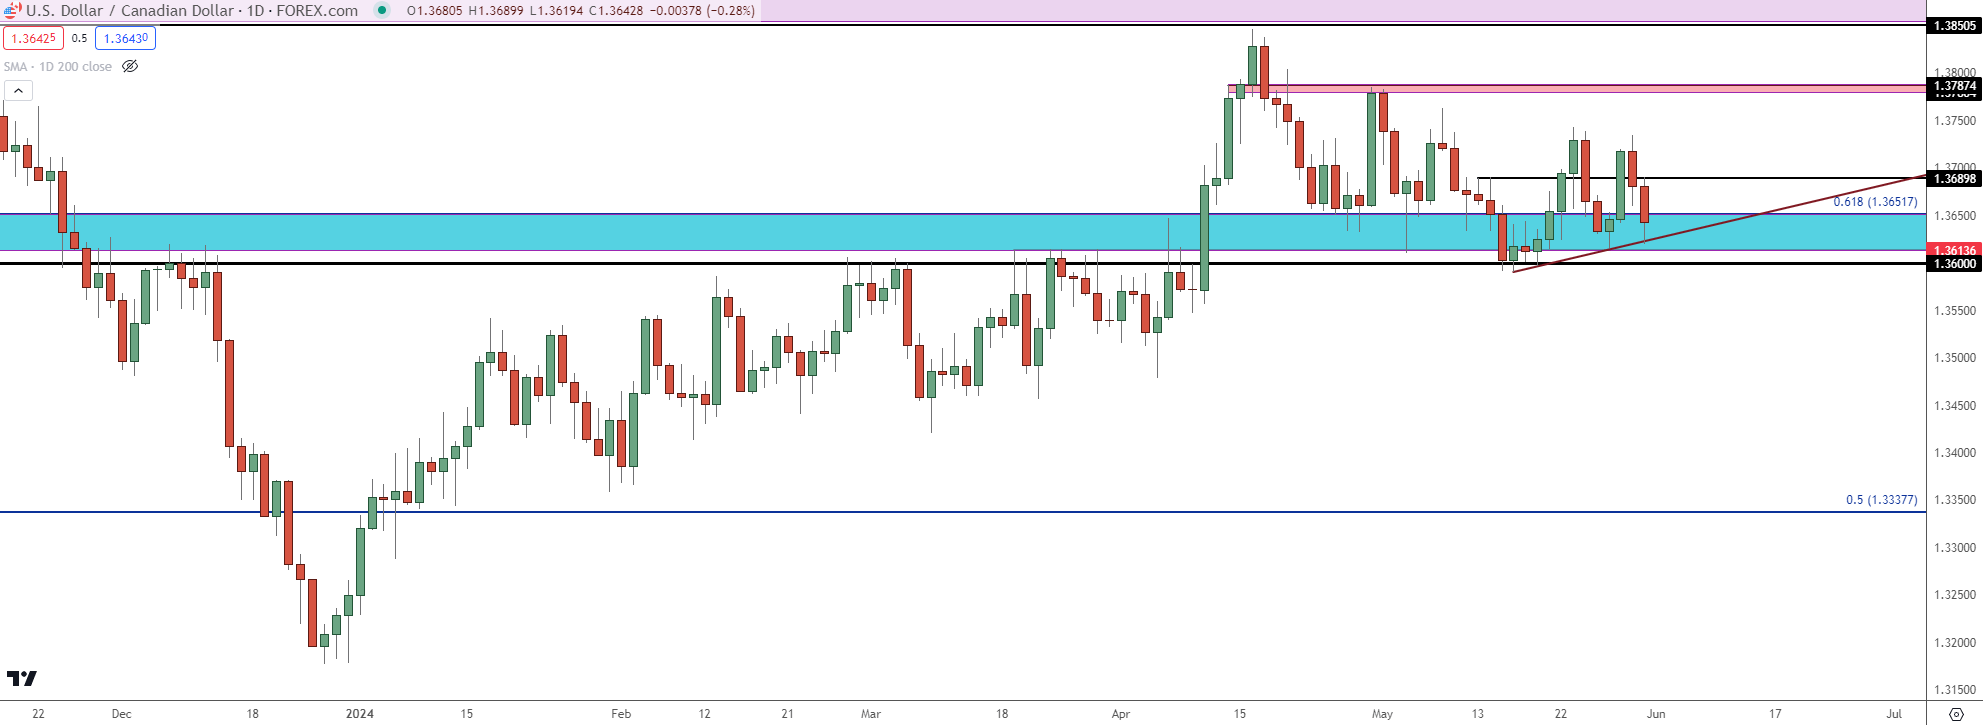 Chart prepared by James Stanley, USD/CAD on Tradingview
USD/JPY
USD/JPY is of interest for a couple of reasons.
First and foremost the carry remains tilted to the long side of the pair, which means longs can earn rollover while shorts are in a position to pay. This motivates on both sides of the trades, where longs might not mind sticking around for longer while shorts have to pay for the right to do so.
This is a push point behind the trend that started in 2021 and allowed for more than a 53% rally, and still hangs on today.
The month didn’t start easy, however, as the BoJ intervened just ahead of the May open to defend the 160.00 level in the pair. And despite burning more than $60 billion to defend the currency that their very own monetary policy is pushing lower, USD/JPY is nearing the end of May very close to where it had started.
USD/JPY Monthly Price Chart
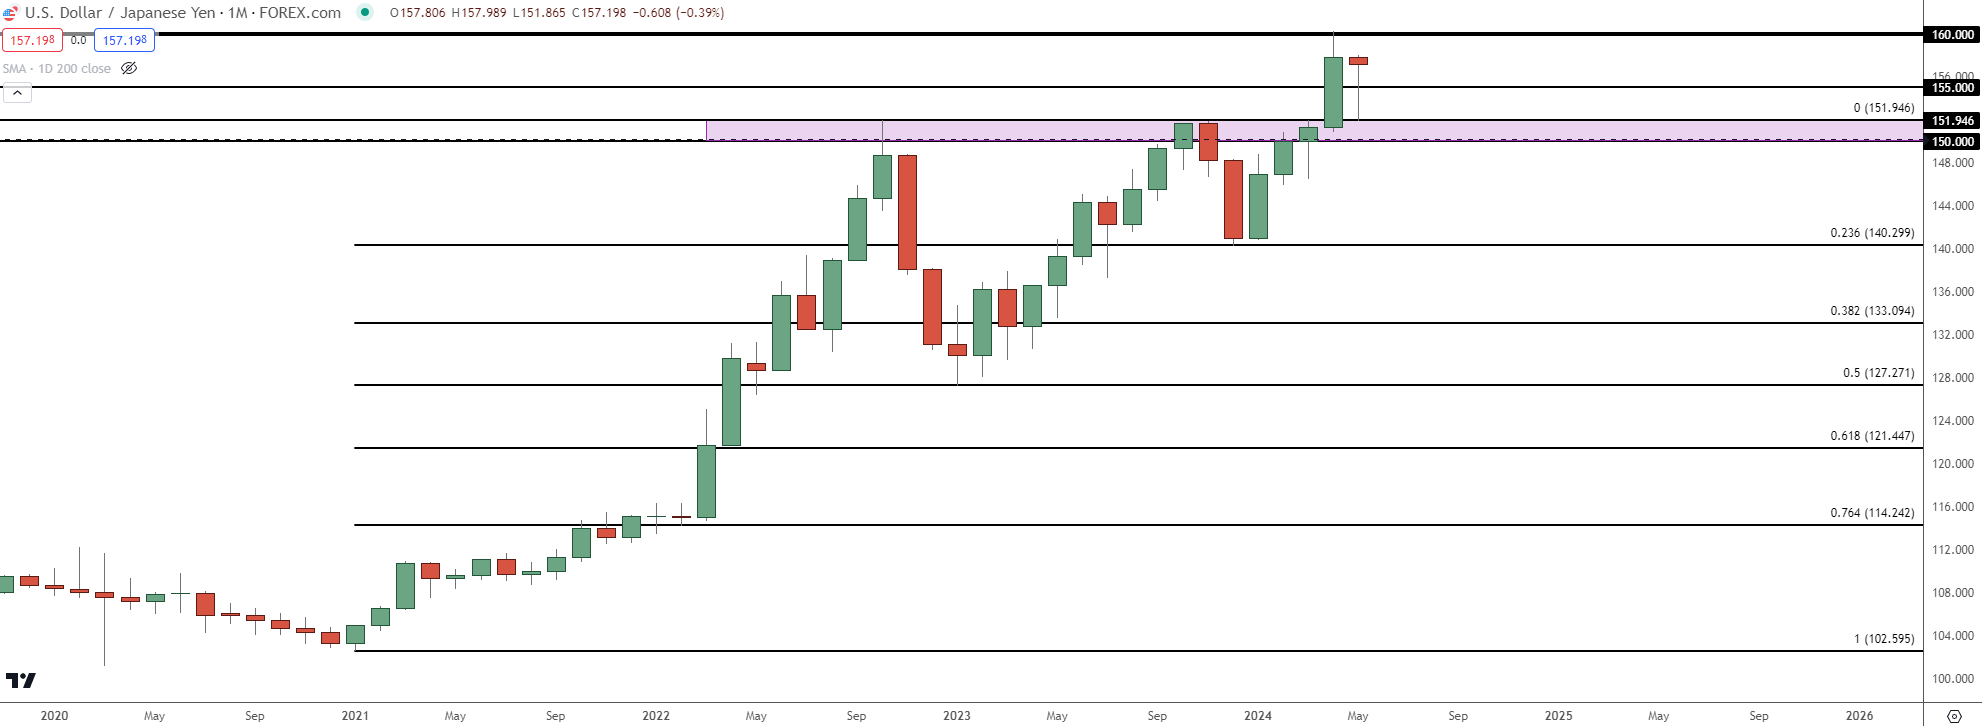 Chart prepared by James Stanley, USD/JPY on Tradingview
USD bulls have continued to drive the pair higher and I had looked at this on Thursday, highlighting the pullback that had shown while also pointing out the responses to pullbacks earlier in the month.
So far in early-Friday trade, that response has been similar with buyers returning to buy the dip and push the bid-higher.
This retains a bullish stance in USD/JPY but what’s perhaps more interesting is the prospect of change. And for that, we’ll likely need to see the US Dollar tanking; or at least fears that something similar might be around the corner. That was the driver behind pullbacks in November each of the past two years and with USD strength returning from the low on December 28th of last year, USD/JPY has continued to hold a bullish bias for much of the time since.
USD/JPY Daily Price Chart
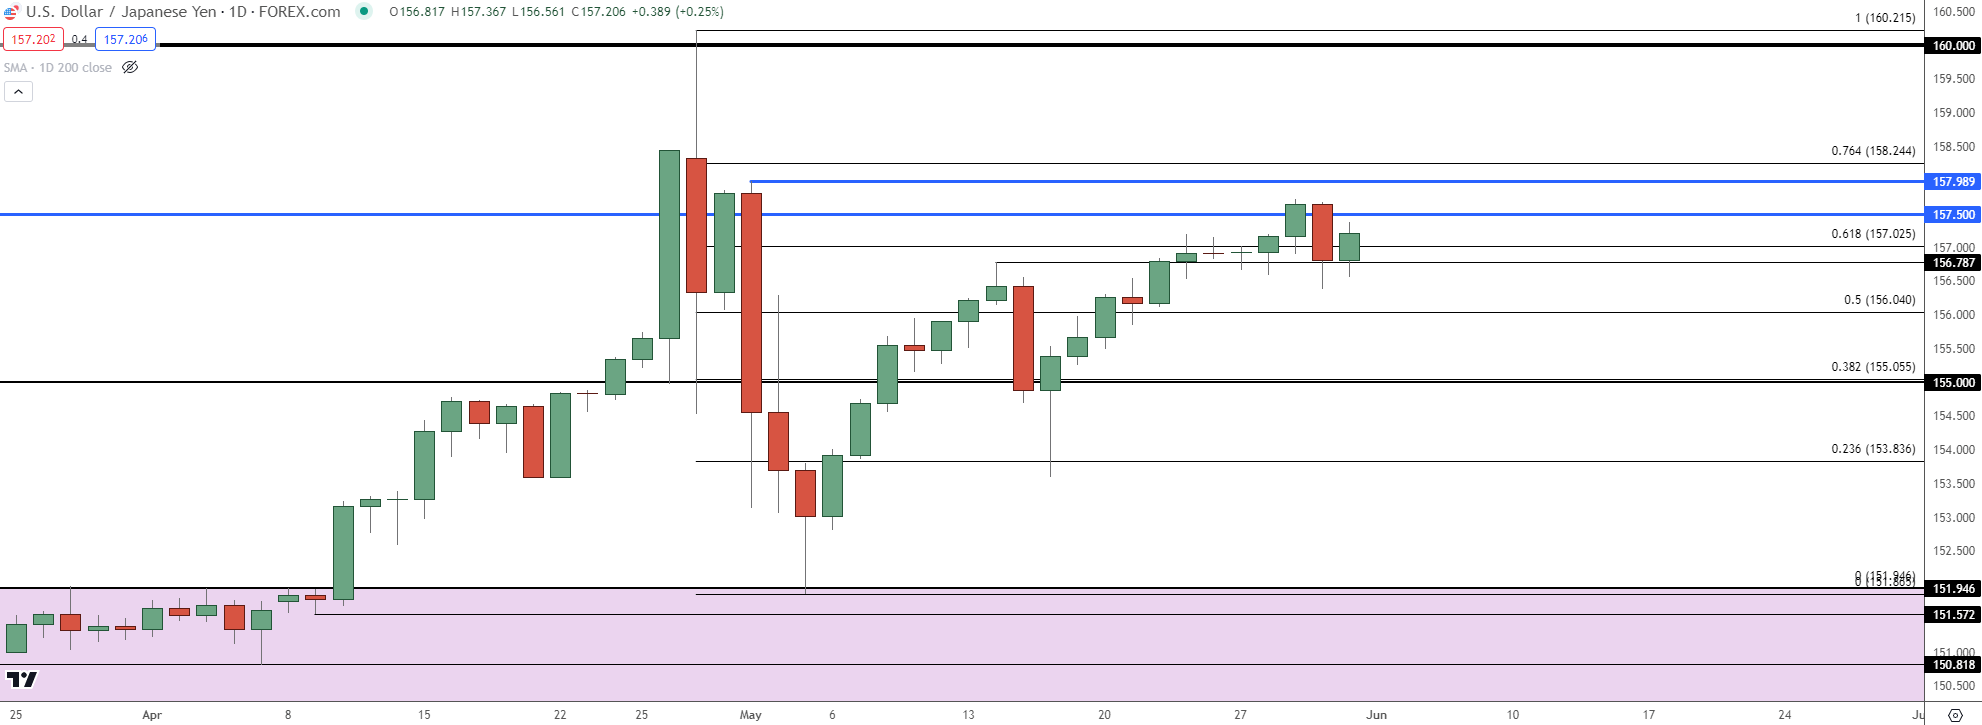 Chart prepared by James Stanley, USD/JPY on Tradingview
Gold (XAU/USD)
Gold is showing a doji on the weekly at this point, which in and of itself doesn’t say much. But, when taken with context there can be greater meaning.
The prior week showed an aggressive bearish outside bar as Gold had its worst week since early-December. But bulls returned and largely held the line this week, with support remaining at the familiar spot around 2325.
Next week is big for Gold as we’ll see whether the bearish outside bar gets follow-through or whether the doji at support in response to the outside bar brings more of a bounce.
Gold (XAU/USD) Weekly Price Chart
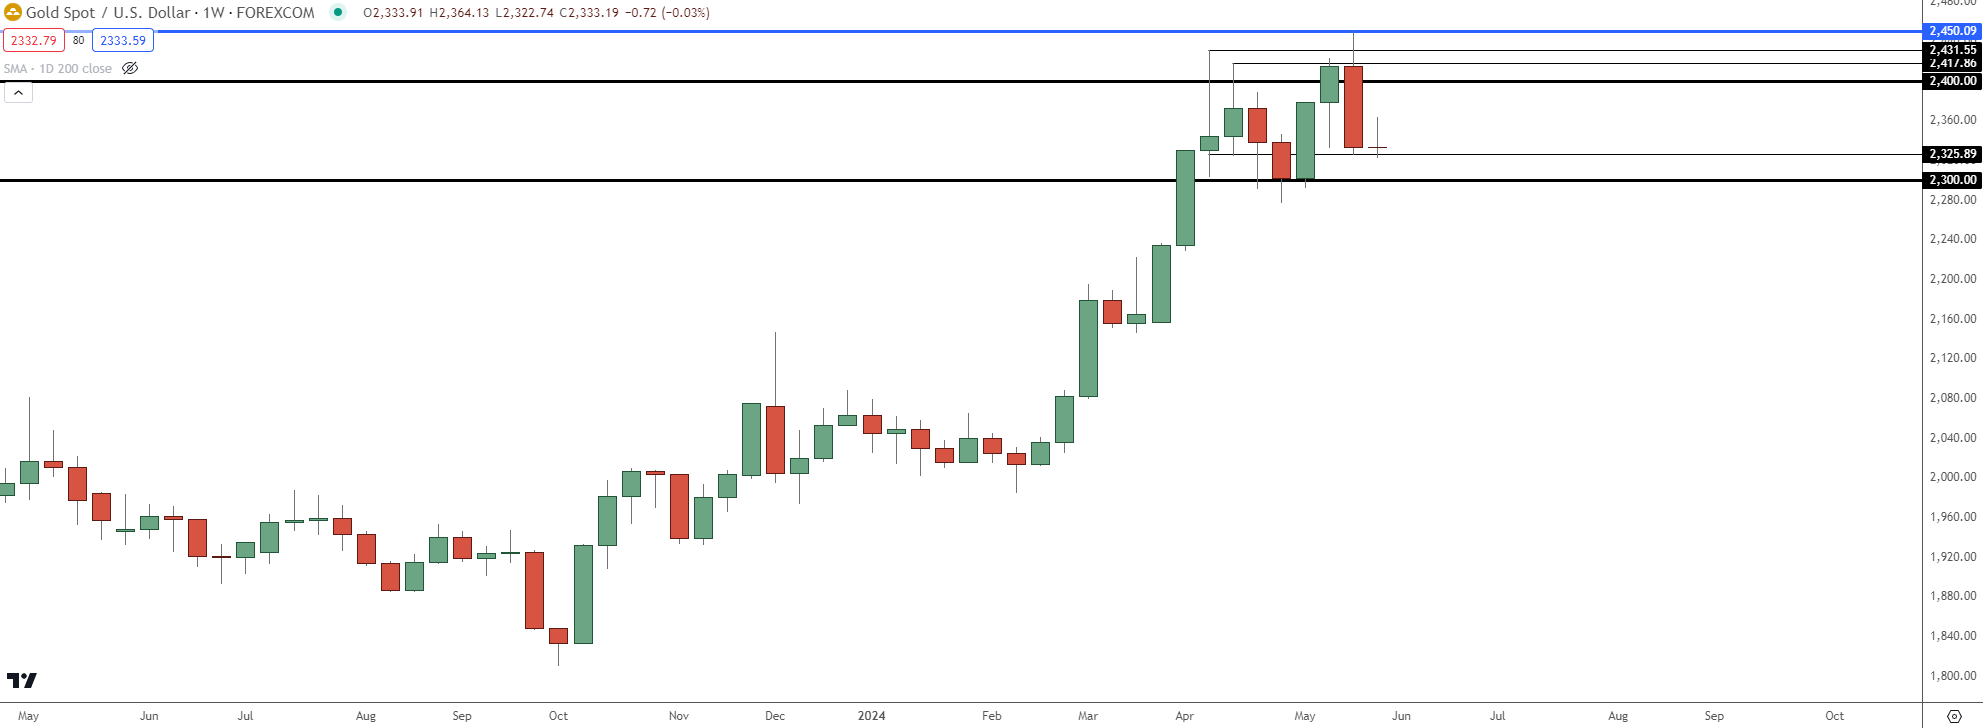 Chart prepared by James Stanley, Gold on Tradingview
From the four-hour chart of Gold we can see a big spot of support coming in to help set this week’s lows, which is right around prior resistance from early-May.
This shorter-term chart also offers a few additional levels of reference, such as the 2305 prior swing low or the 2350-2354 resistance zone, which buyers struggled to hold a move above. The next significant spot of resistance over that is the 2372-2378 zone which was resistance-turned-support earlier in May.
Gold (XAU/USD) Four-Hour Price Chart
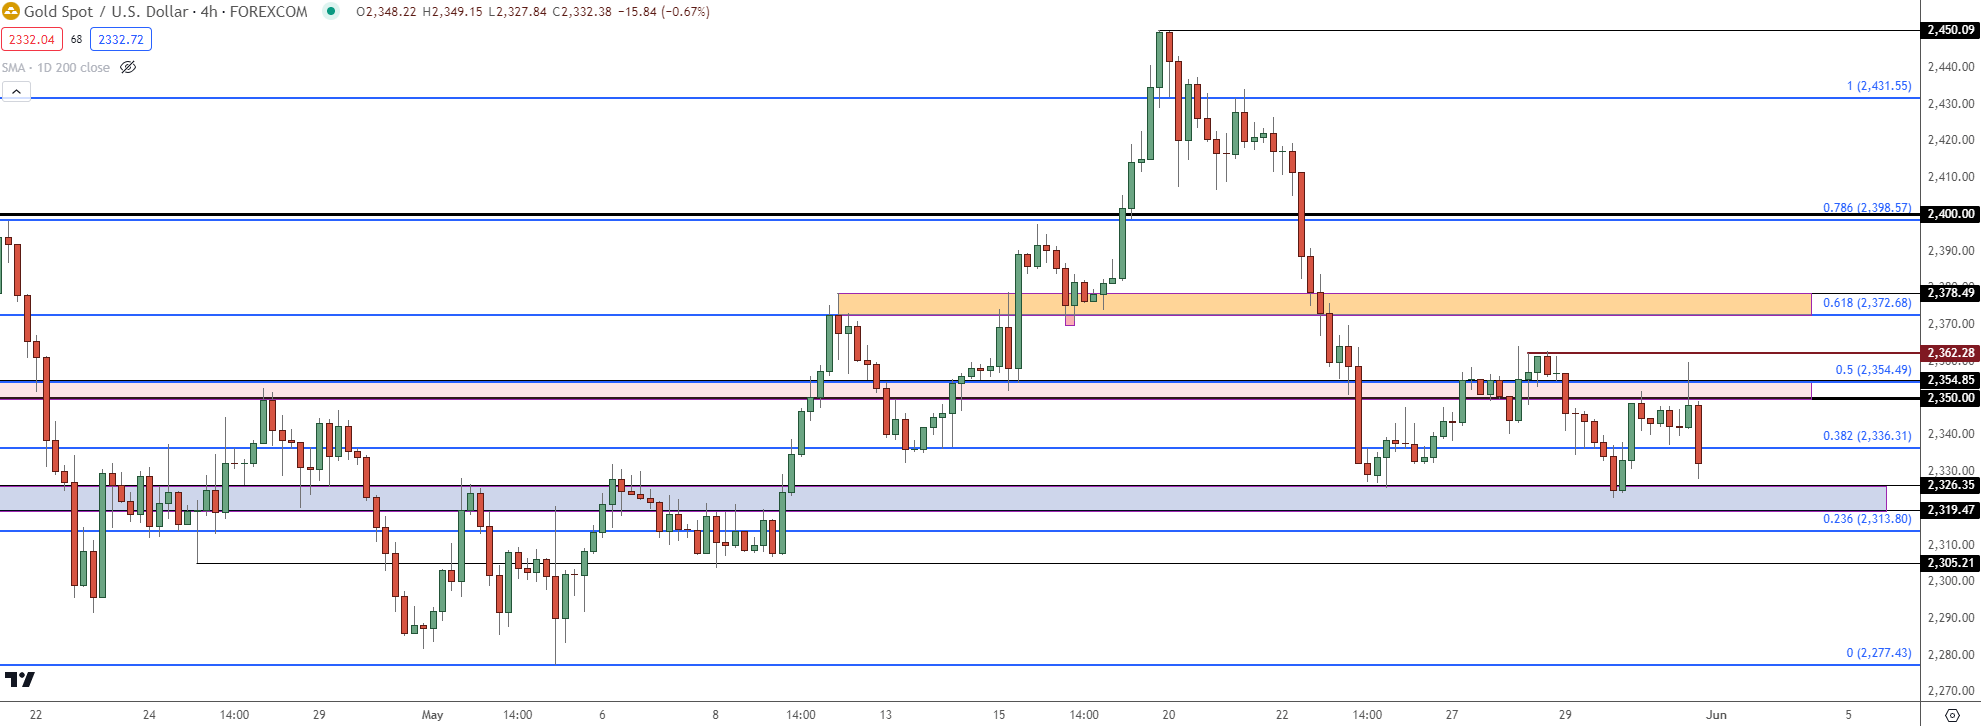 Chart prepared by James Stanley, Gold on Tradingview
--- written by James Stanley, Senior Strategist


