
US Dollar Talking Points:
- The US Dollar held another lower-high after yesterday’s gain, keeping the door open for deeper pullback potential.
- While the bullish run in the USD was loud and clear, the bigger question now remains whether the currency is still too-crowded on the long side as it’s failed to push up to fresh highs after a strong retail sales report earlier this week.
- Related, EUR/USD continues to hold support above the 1.0500 level which keeps the door open for deeper pullback potential there, as we had discussed on the webinar over the past two Tuesdays.
It’s been an abnormal week for the US Dollar so far. While the bullish trend took over for much of the past three months, the current weekly bar is showing as an inside bar with the entirety of this week’s range contained inside of the prior week. This isn’t necessarily abnormal, but it does speak to the overbought nature of the move as we came into the month of October and for the past two weeks, bulls have been unable to push up to a fresh high to continue that move, even with some strong data in the form of a Non-farm Payrolls report and a very strong outing for retail sales earlier this week.
Interestingly, the data item that did seem to excite USD bulls was the data point that was largely in-line, with last Thursday’s CPI report. But, as I had noted at the time, it appeared that strength came back a bit too quickly for it to be a trend continuation type of scenario.
On the other side of the matter, however, USD bears haven’t exactly been able to get much run of late, either, as DXY hasn’t yet retraced 23.6% of that prior bullish move. A part of that likely has to do with the Euro and the fact that bulls haven’t been able to muster much for a pullback there, despite the oversold reading that showed in the pair a few weeks ago following a stern downside run.
In the USD, the challenge is positioning with price so near that recent high, combined with the fact that there’s been a build of lower highs as buyers have been shying away from re-tests of late. I had talked about this in the Tuesday webinar and below I’m looking at the updated weekly chart.
US Dollar Weekly Price Chart (indicative only, not available on Forex.com platforms)
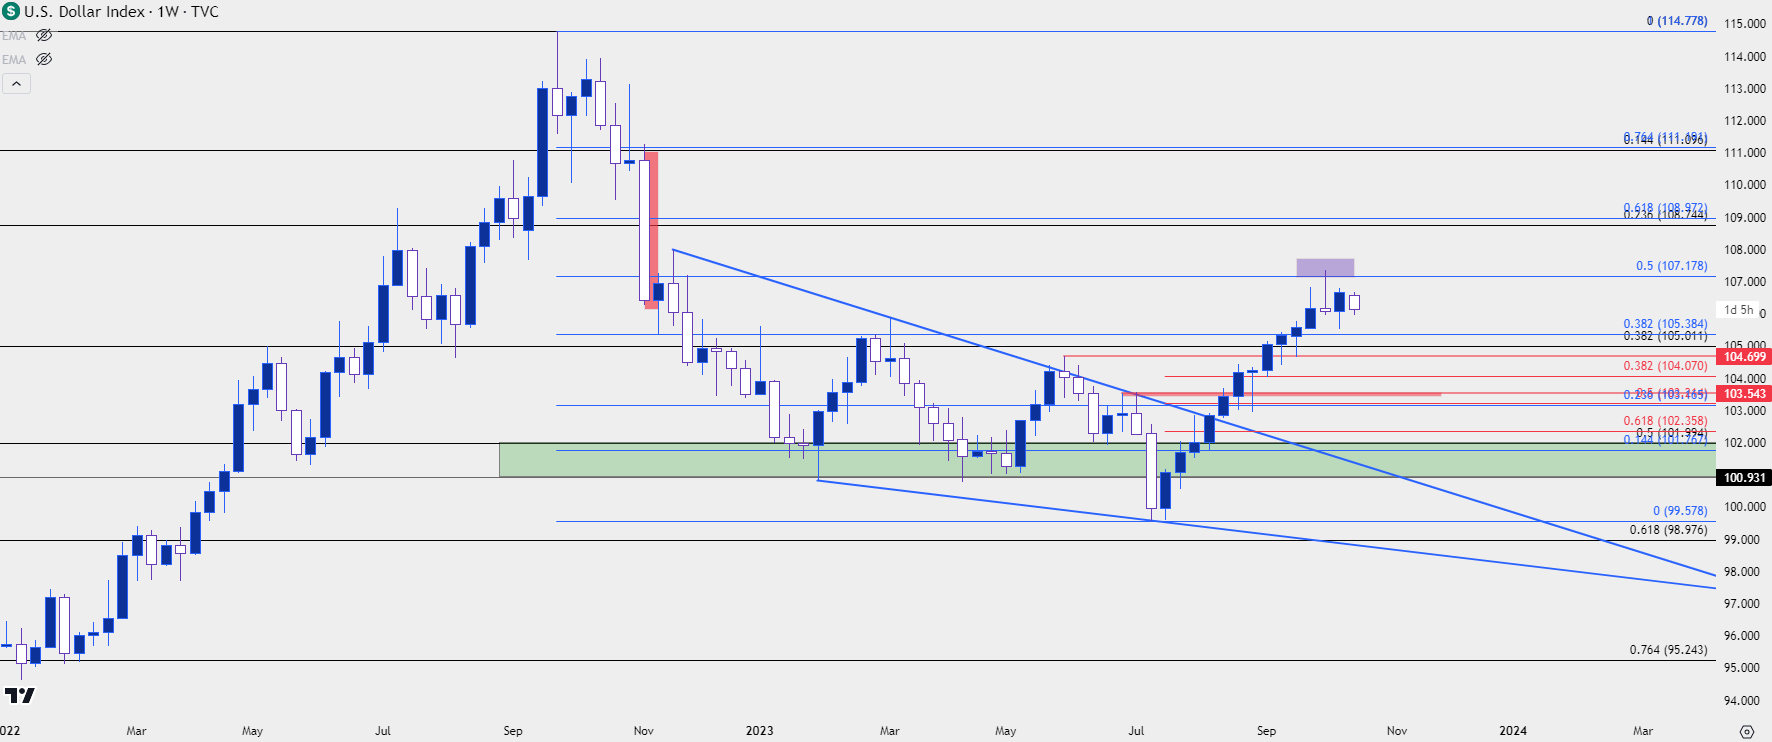 Chart prepared by James Stanley; data derived from Tradingview
From the below daily chart, we can get a better view of that recent impasse that’s led to the build of the inside bar on the weekly. I’ve added two blue lines to indicate the range that’s held so far this week, with short-term resistance around 106.63 and short-term support above the 106.00 handle. To be clear, fundamentals have appeared to remain strong for the US, and the fact that price has stalled in the bullish trend indicates that the move had become too crowded, and this is what alludes to the possibility of a deeper pullback.
For deeper support potential, there’s a nearby spot around the recent low down to the 23.6% Fibonacci retracement of the recent bullish run. Below that is a major zone that runs from 104.70 up to the 105.00 level, which has a couple of different things going on. It’s a major psychological level on top of the 38.2% retracement of a longer-term major move, adding a bit of confluent at that spot. The 104.70 price remains relevant as this was the swing-low from the FOMC meeting in September, and ideally, bulls would probably want to see the higher-low hold above that level.
US Dollar Daily Price Chart (indicative only, not available on Forex.com platforms)
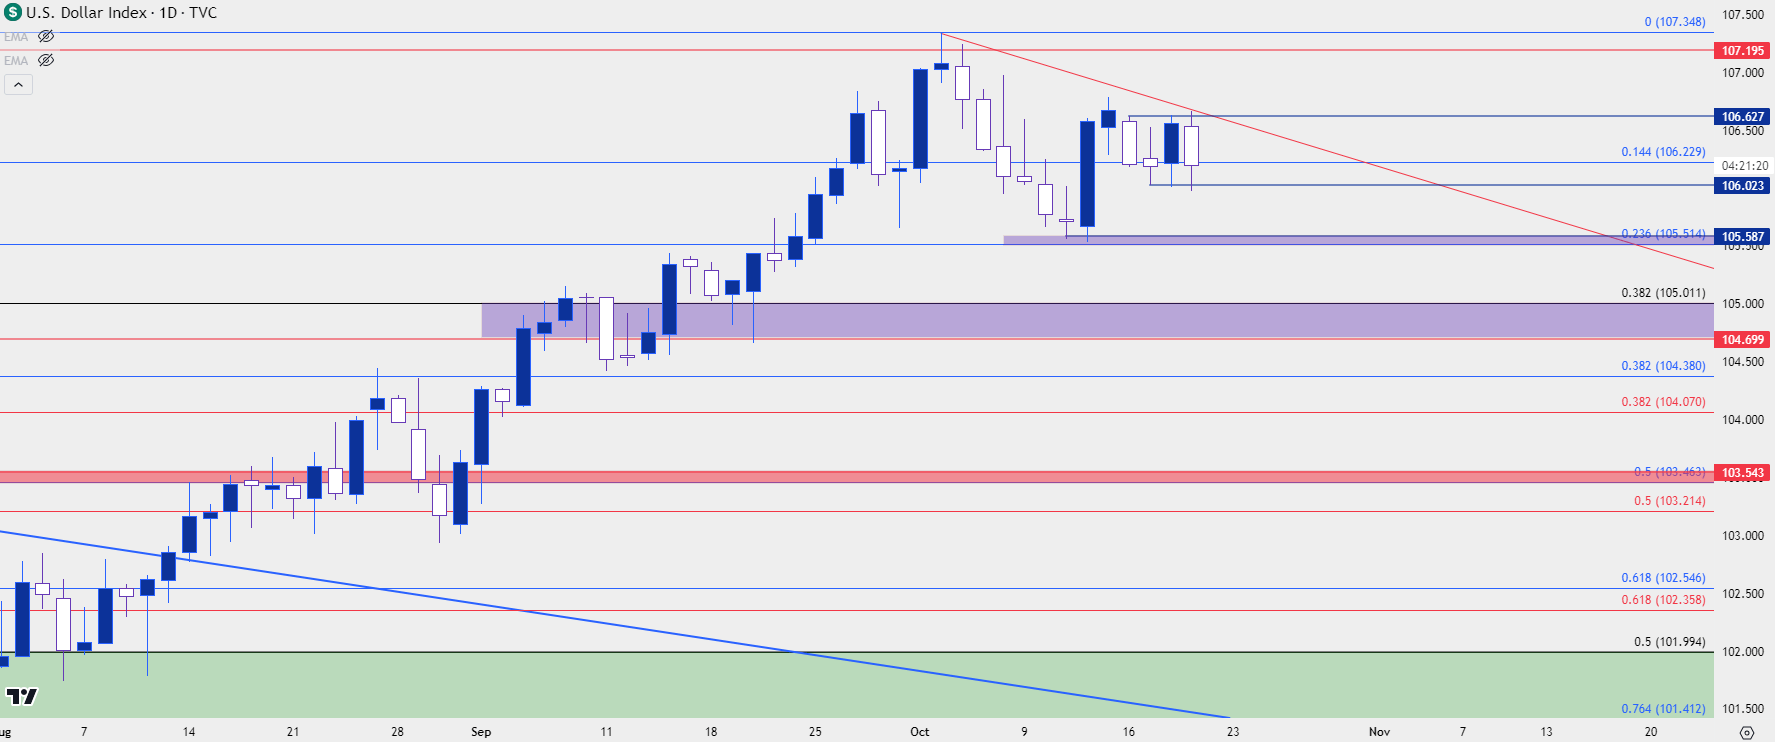 Chart prepared by James Stanley; data derived from Tradingview
EUR/USD
If the US Dollar is going to muster a deeper pullback, it’s likely going to need some help from Euro bulls, which has seemingly been evasive of late.
I’ve been talking about the 1.0500 level in EUR/USD for pretty much all of October so far. The price started to come back into play in late-September, helping to set a short-term low in the pair. Sellers went for another test below the big figure but couldn’t get below 1.0448 before another pullback started to develop. Since then, it’s been a sequence of higher lows, with 1.0488 coming into play on the morning of NFP, or 1.0500 coming into play the Friday after. So far this week that support structure has remained defended and we haven’t yet seen a re-test at 1.0500.
But – on the other side of the matter each time price has pushed up for a re-test of resistance, sellers have swatted it back down. The 1.0611-1.0636 zone remains key, and the latter level was in-play last week which led to a strong response from sellers.
Sellers have pushed up for another re-test of the 1.0611 level today and that’s since held as resistance. But from the below chart, we can see where prices are testing above the bearish channel that’s governed the move for the past three months. If bulls can push above 1.0636, there’s likely some stops sitting above that level, which could prod some additional demand in the market. This can open the door for a visit at the 1.0673 level, or perhaps even as deep as 1.0766 if bulls can start to take on a bit more control of the near-term move.
EUR/USD Four-Hour Price Chart
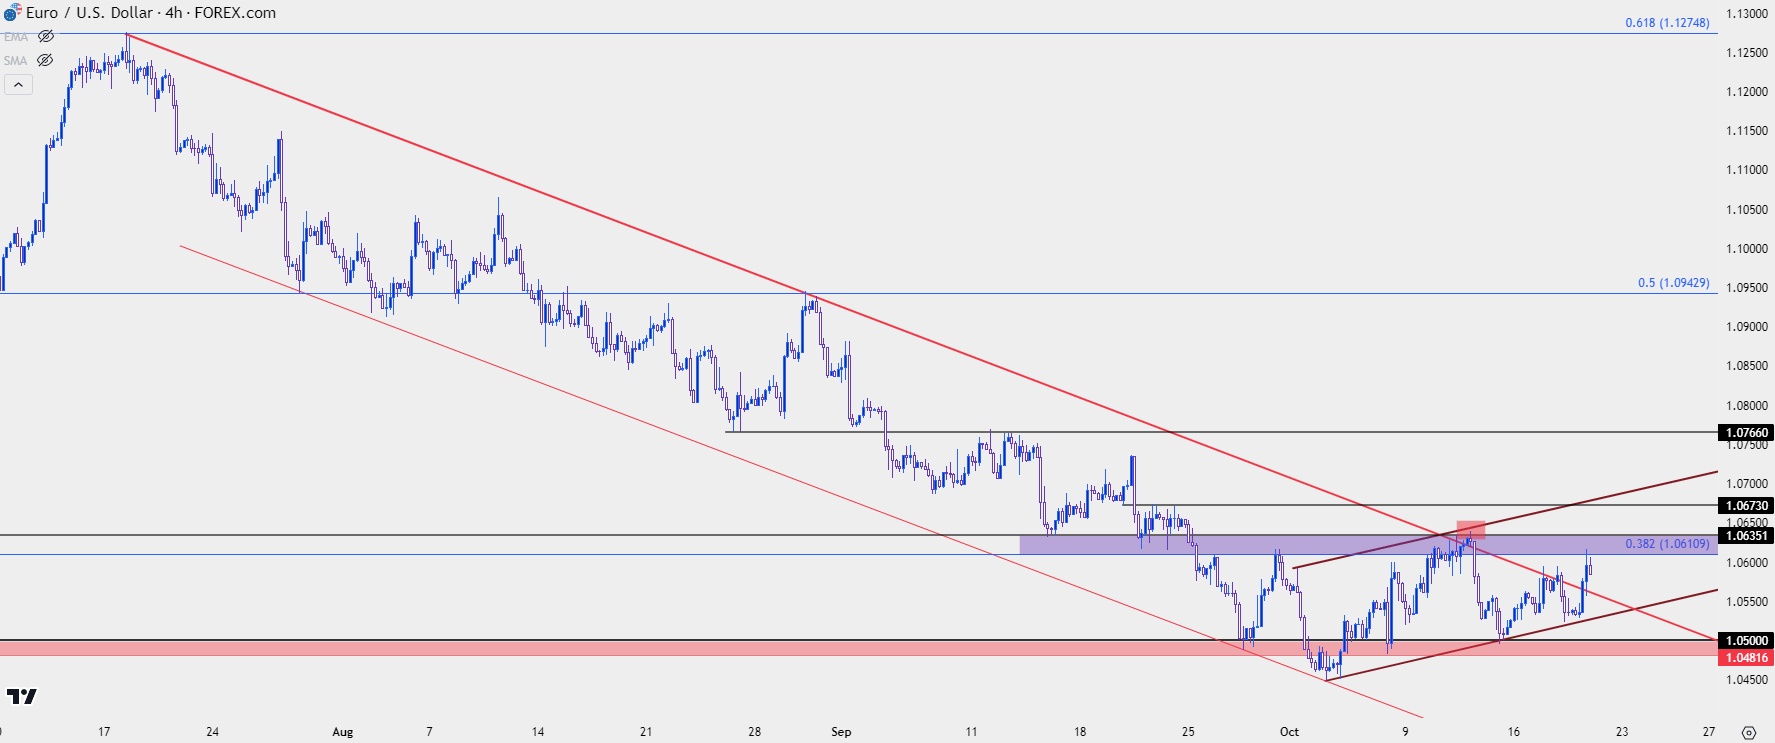 Chart prepared by James Stanley, EUR/USD on Tradingview
GBP/USD
There’s been a similar lack of interest of late from British Pound bulls, and GBP/USD sees price holding very near recently established lows just above the 1.2000 big figure. This morning saw a bounce develop into confluent resistance, around 1.2190, that saw a response from sellers and that’s helping to create a doji on the daily chart.
The challenge here appears to be for bears, as price remains so close to an actual low which is just above a possible support level at the 1.2000 handle. This could be a challenge for bears looking to work with the trend and this is somewhat of a less-bullish picture of what we looked at above in EUR/USD.
This further alludes to pullback potential in the US Dollar, given the stretched state of each market. There’s a confluent resistance level at the 1.2300 handle but there’s also a spot of interest around 1.2223, which held highs on Friday, Monday and Tuesday. A breach of that level opens the door for a re-visit to 1.2266, after which the confluent 1.2300 level could come into the picture.
GBP/USD Daily Price Chart
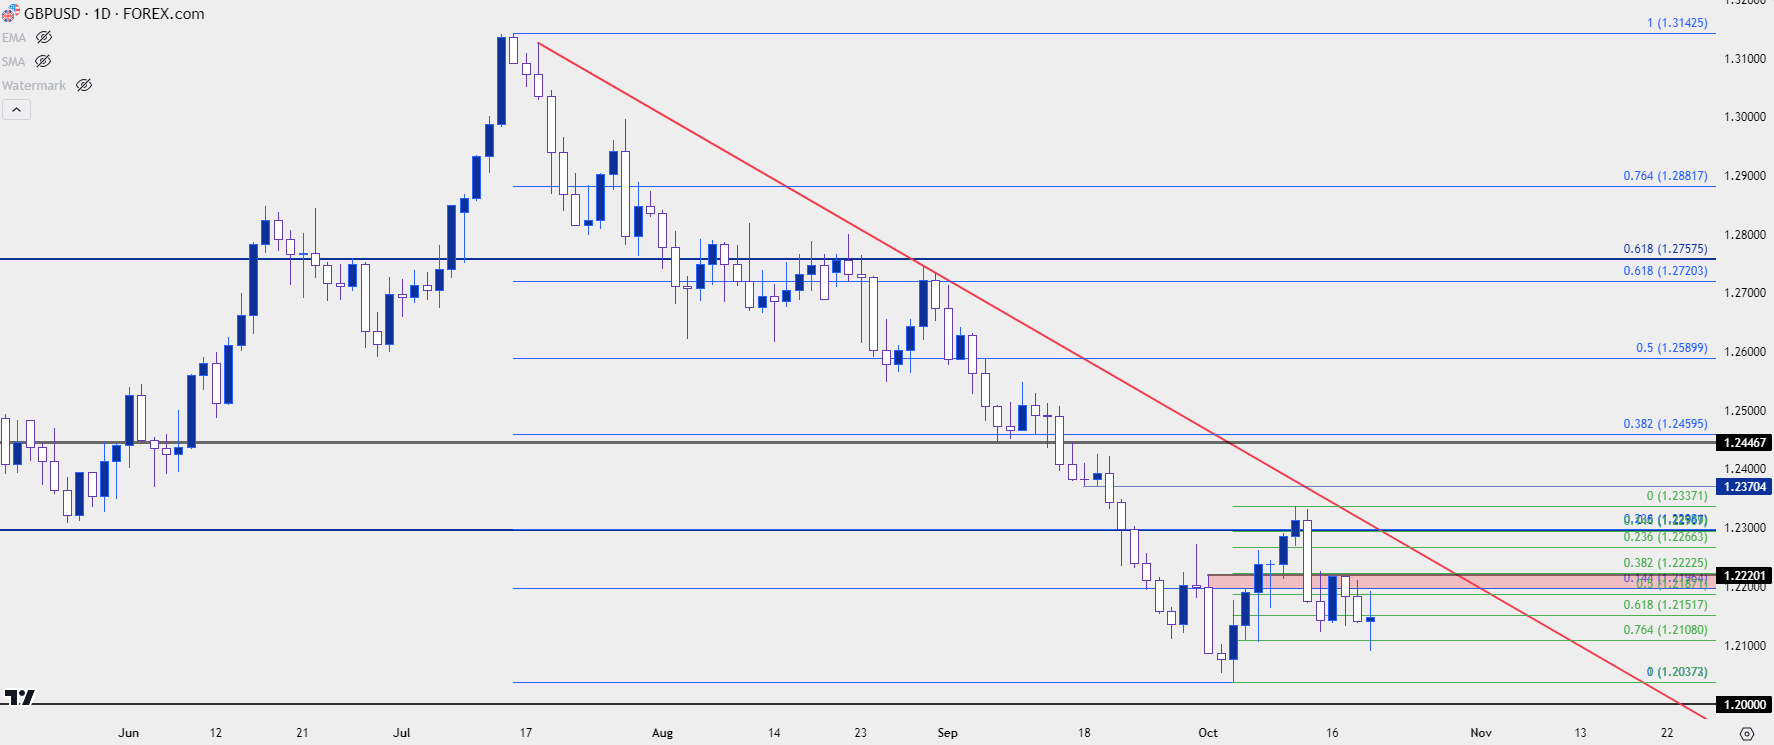 Chart prepared by James Stanley, GBP/USD on Tradingview
USD/CAD Re-Tests Breakout
It’s been a big week for the Canadian Dollar, with both the Canadian inflation report earlier in the week and the Bank of Canada rate decision yesterday. Collectively, this has led to CAD-weakness and USD/CAD is testing a breakout above a big level on the chart at 1.3652. That’s the 61.8% Fibonacci retracement of the 2020-2021 major move, and this level has seen multiple inflection points already this year.
It had helped to hold bulls at bay when a breakout was testing earlier in the month, and it helped to build a doji last week. This could become a spot of interest for short-term support for USD/CAD bulls looking to work with pullback themes.
USD/CAD Weekly Chart
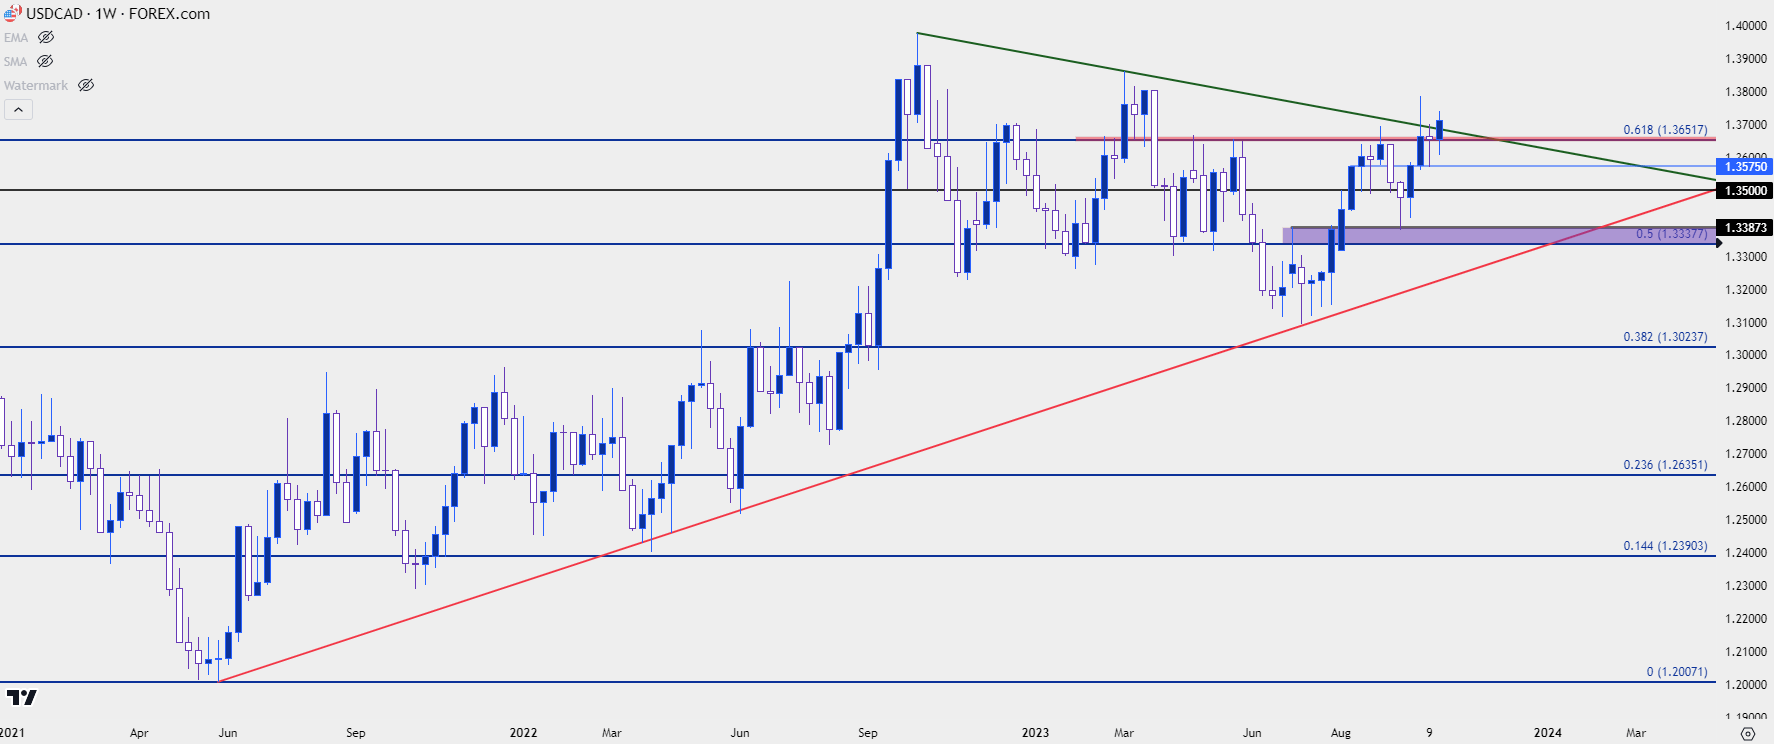 Chart prepared by James Stanley, USD/CAD on Tradingview
USD/JPY: 150 – Will They, or Won’t They?
USD/JPY presents a challenging picture. Price is holding very near the 150 psychological level and the last time that bulls forced a test above that price, it led to a 250+ pip pullback in a very short amount of time. In essence, it ran through a number of stops on long positions before support before buyers returned to the matter.
And for the past two week’s they’ve been continuing to return to the matter but there hasn’t yet been another test over the 150.00 level, as there’s the possible threat of intervention beyond that price.
But thickening the plot is the fact that the 150 reaction two weeks ago may not have been an intervention-driven move. Reuters reported after-the-fact that BoJ money market data indicates that it may not have been intervention from the Bank of Japan, which may help to explain why traders have been so willing to force price right back towards the big figure.
This presents a challenging scenario around possible risk-reward. For bulls, even if price does press above 150, for how long might that run? Last year, the BoJ intervened before 152.00 traded, so perhaps that’s a level to keep in mind. But if the intervention run can quickly shave 250 or 300 pips off of price, that becomes a difficult trade to justify, even with the fundamental backdrop remaining tilted to the long side of the pair.
USD/JPY Daily Price Chart
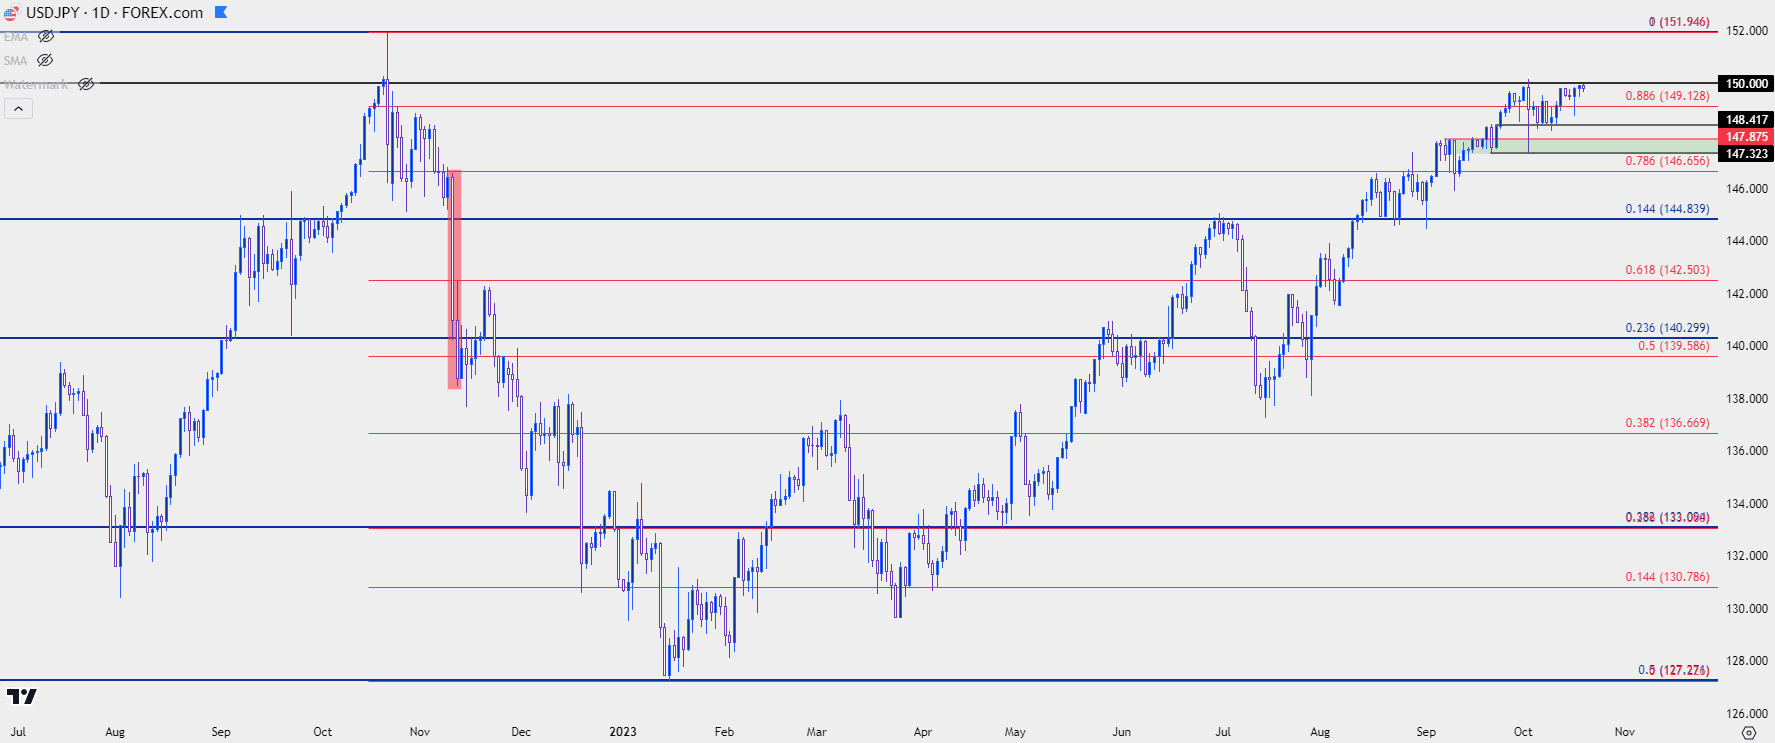 Chart prepared by James Stanley, USD/JPY on Tradingview
--- written by James Stanley, Senior Strategist


