US Dollar, EUR/USD, GBP/USD, USD/CAD, AUD/USD Talking Points:
- The US Dollar has so far put in a net move of weakness on the week but, notably, DXY has so far held above key support at 100.87.
- The past week was full of headline risk events and next week shifts the focus back to inflation, with US CPI data set to be released on Wednesday and PPI on Thursday.
- I’ll be discussing these themes in-depth in the weekly webinar on Tuesday at 1PM ET. It’s free for all to register: Click here to register.
The FOMC rate decision on Wednesday and the NFP report on Friday kept the US Dollar in the spotlight over the past week, not to mention the ECB rate decision on Thursday. Next week shifts the focus back to inflation data with the Wednesday release of CPI data out of the United States which is followed by the release of PPI data on Thursday.
I had looked into the US Dollar on Thursday, just ahead of the NFP release, and as I had shared there, the USD had worked into a near-term range, testing resistance and a fresh three-week-high on Monday only to fall back towards range support near the 101 level on Wednesday, just after the Fed.
Interestingly, it was the ECB rate decision the morning after that brought DXY back to life, with bulls showing up around a 25 bp rate hike from the European Central Bank. Resistance held at a familiar level of 101.64 and that set the stage for NFP, with the net impact of that release bringing the USD back below short-term support around 101.30. And that NFP release was strong, with a beat on the headline number, the Average Hourly Earnings component and the unemployment rate, with the lone item of weakness a revision to last month’s headline number.
US Dollar - DXY Four-Hour Price Chart (indicative only, not available on Forex.com platforms)
 Chart prepared by James Stanley; data derived from Tradingview
US Dollar Longer-Term
At this point, DXY and USD remain very near longer-term support at the yearly low of 100.87. As long as that support holds, there’s a possible double bottom at play, and that’s the type of formation that can open the door to reversal themes if it comes to fruition. But for the formation to trigger bulls are going to need to go to work as there’s been a penchant for sellers to swat DXY down after a trip above the 102 handle. This week did see a higher-high, technically speaking, but bulls still need to defend the lows to keep the door open for this scenario.
That 100.87 level may even have some link with the 1.1100 level in EUR/USD as that’s remained somewhat of an elusive spot for EUR/USD bulls so far, with this week bringing a lower-high after last week’s swing topped out at 1.1096.
US Dollar - DXY Weekly Price Chart (indicative only, not available on Forex.com platforms)
 Chart prepared by James Stanley; data derived from Tradingview
EUR/USD
EUR/USD is working on yet another doji on the weekly chart and this was perhaps the most interesting driver on the USD over the past week. The FOMC rate hike saw the Fed add 25 bps to US rates and the ECB also pushed a 25 bp rate hike at their meeting the morning after. But – the Fed hike had a dovish lean whereas the ECB’s hike had a bit more of a hawkish push, with Lagarde highlighting inflation and the need to continue addressing the matter while Powell was a bit more passive on the matter.
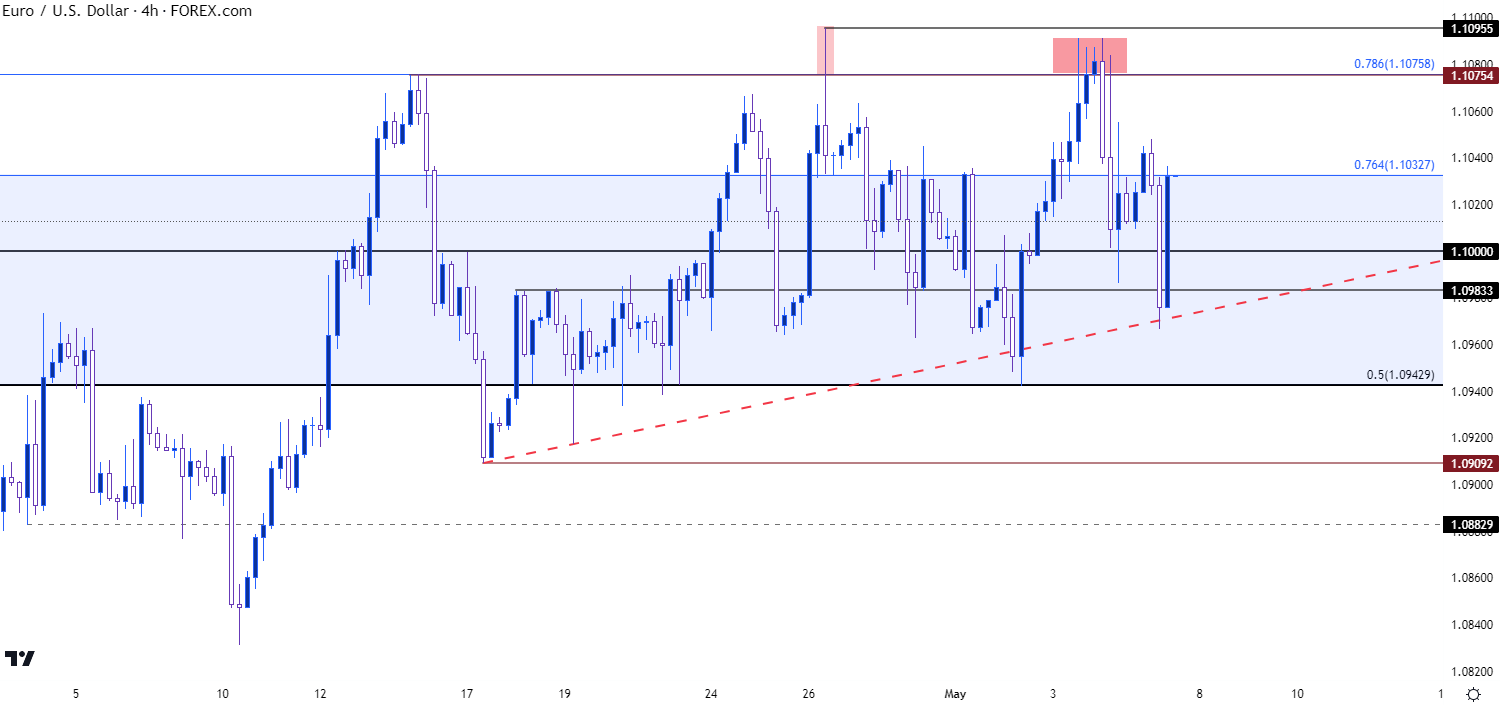
Nonetheless, the ECB hiked by 25 bps as opposed to 50 and the response was weakness in the Euro. In EUR/USD, the pair had held at a key resistance level going into that rate decision, the same 1.1076 level that helped to set the high in the first half of April trade.
At this point, and like the DXY short-term setup looked at above, EUR/USD is holding in a range. Support was in-play at the Fibonacci level of 1.0943 on Tuesday and resistance was in-play on Thursday, just head of the ECB, around the 1.1076 level.
EUR/USD Four-Hour Price Chart
 Chart prepared by James Stanley, EUR/USD on Tradingview
EUR/USD Longer-Term
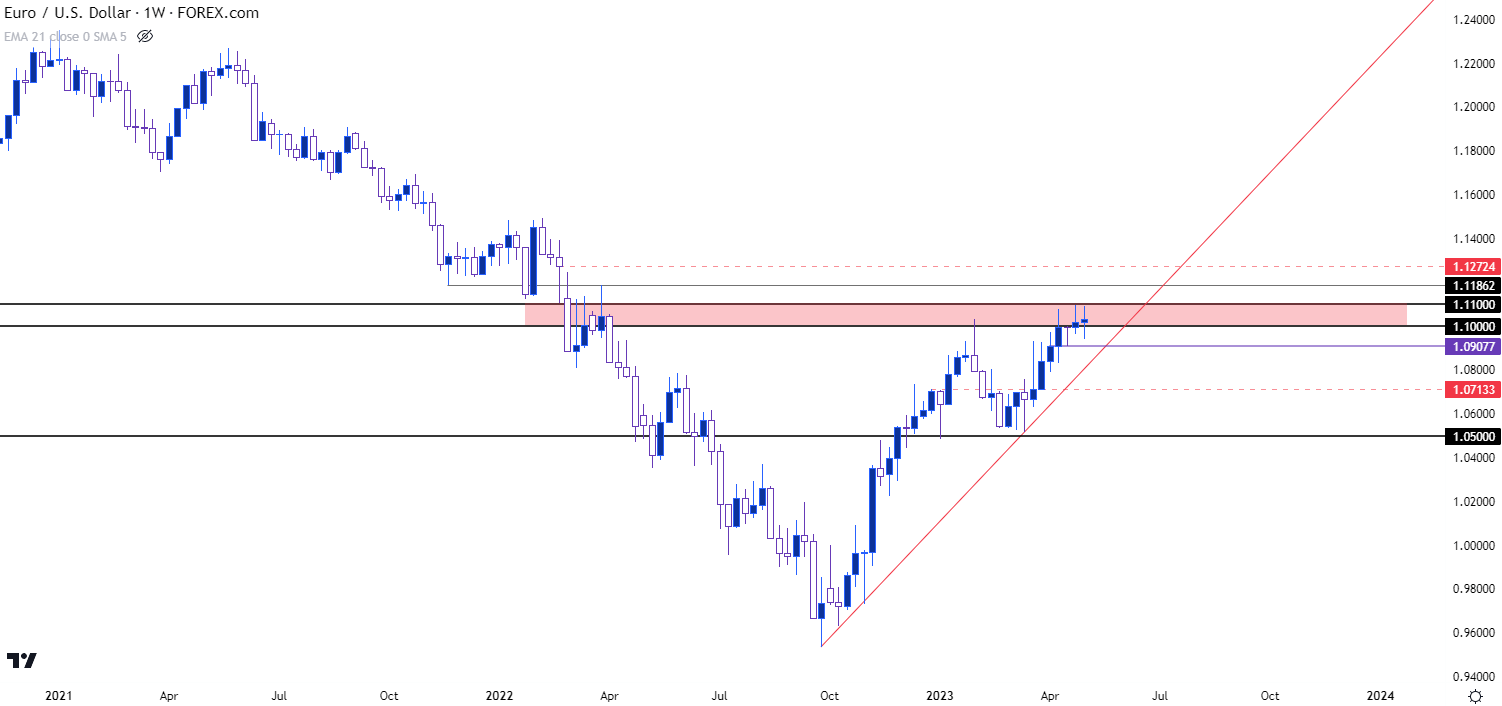
We can scroll out to a longer-term chart to put that range into context, and as we can see from the weekly, this range has essentially been building around longer-term resistance. The past two weekly bars have illustrated indecision and at this point it looks like we’re heading for a third. This can be simple to consider as a bearish setup, given the hold of resistance at a key spot. But there’s another side of this that needs to be taken into account – and that’s the fact that sellers have had an open door to take-control of price action and, so far, they haven’t.
For support in the longer-term setup, a breach of the 1.0908 level would mark a fresh multi-week low and this would be an ideal first step. On the resistance side of the coin, if we do see bulls finally test for breakouts above the 1.1100 handle, there’s a spot of potential resistance around 1.1187 and another around 1.1272.
EUR/USD Weekly Price Chart
 Chart prepared by James Stanley, EUR/USD on Tradingview
GBP/USD: A Strong Week
GBP/USD hasn’t yet set a fresh yearly high but it’s put in some considerable progress over the past week. On Tuesday, as USD strength had showed to start the week, GBP/USD moved down to test a familiar level at 1.2444, which had twice held the high in December and then January.
The prior week saw the first sustained push over the 1.2500 handle, and this week’s early pullback showed support right at that prior spot of resistance. This was followed by an aggressive bullish response and the weekly candle at this point is showing as a hammer formation, which indicates ongoing bullish potential.
Next Thursday brings a Super Thursday rate decision from the Bank of England, which means updated forecasts and projections to go along with the rate decision and the press conference. In GBP/USD, price is very near another key zone which is currently marking the yearly high, starting around 1.2667 and spanned up to 1.2758. The latter level is the 61.8% Fibonacci retracement of the 2021-2022 major move and the 38.2 of that same Fibonacci study helped to set the low in early-March around 1.1836.
GBP/USD Weekly Price Chart
 Chart prepared by James Stanley, GBP/USD on Tradingview
USD/CAD
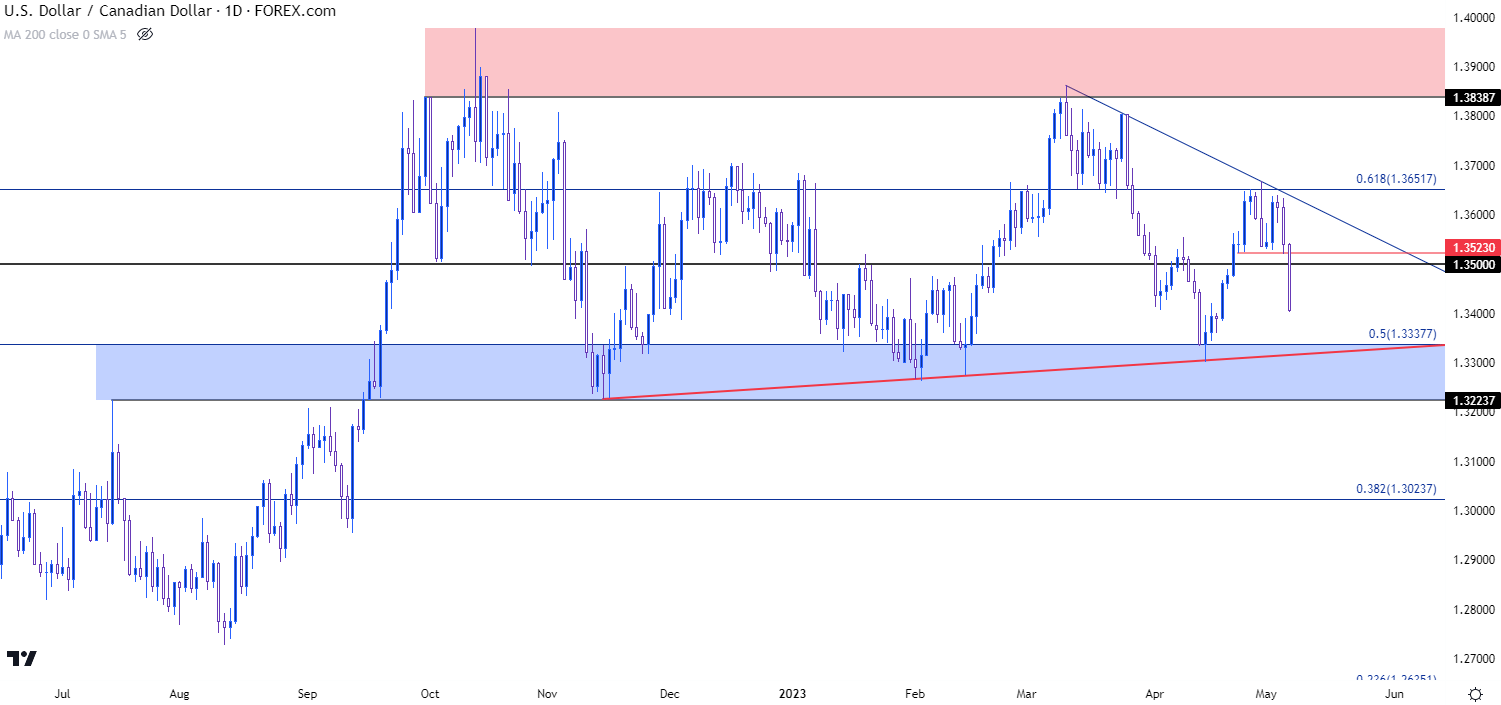
USD/CAD had put in a strong bullish move in late-April, jumping from range support until finally re-testing resistance at the 1.3652 Fibonacci level. Coming into Friday trade the pair had held above the psychological level at 1.3500 but, as I had shared in the article on Thursday, there was a build of lower-high resistance with a bearish trendline coming into play.
Friday morning saw the release of Canadian jobs alongside the NFP report and that resulted in a strong move lower in USD/CAD. The pair is now working back towards the same range support that was in-play a couple of weeks ago, starting around 1.3338, with the bottom of the zone at the 1.3224 level. There’s also a bullish trendline in-play that had helped to catch the low in April and this is generated from the November 2022 swing low, connected to the February 1st swing low.
USD/CAD Daily Price Chart
 Chart prepared by James Stanley, USD/CAD on Tradingview
AUD/USD
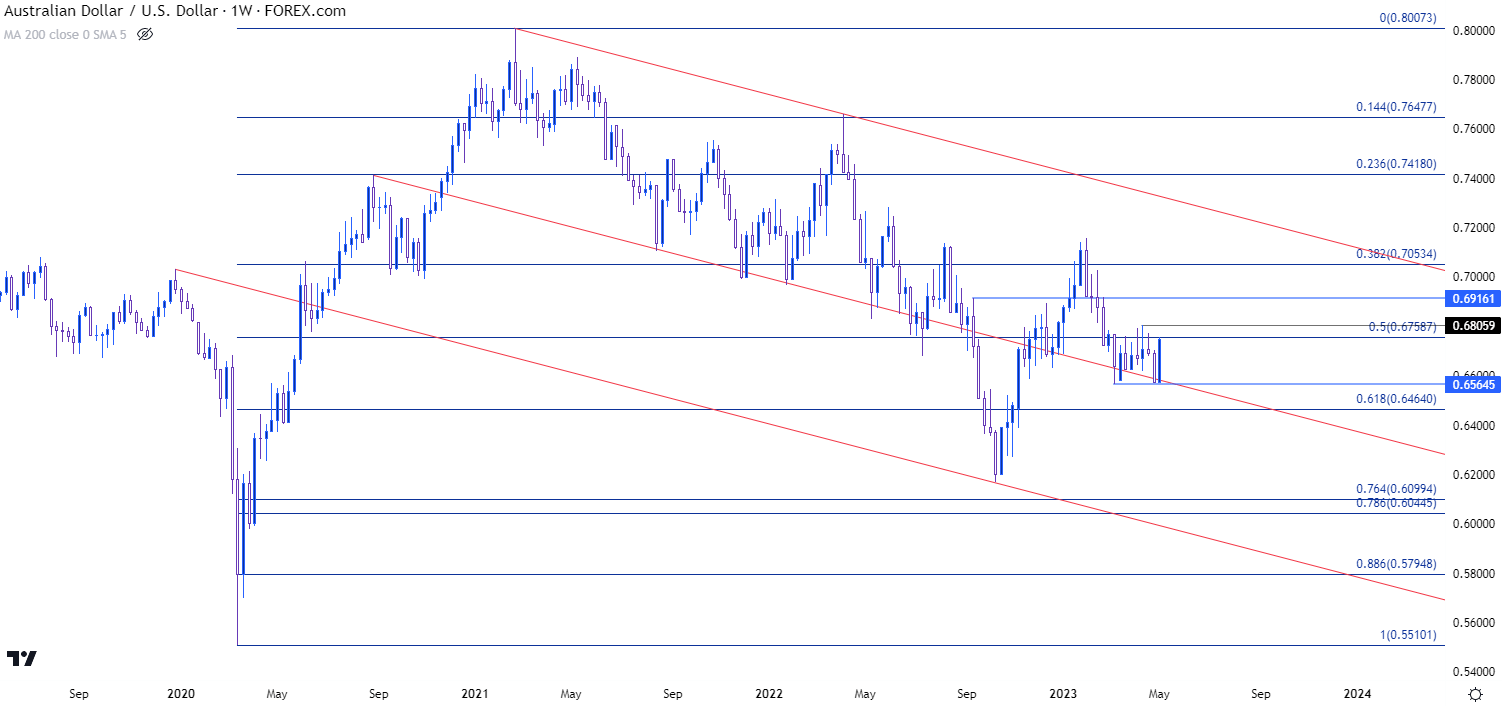
I haven’t written about Aussie much lately as I haven’t had a great feel for AUD/USD and price action has remained choppy from my point of view. There’s been a penchant for resistance at the 50% mark or the 2020-2021 major move, plotted around the .6750 psychological level and that led to a test of the 2023 low around .6570.
This week however is showing as an outside bar with price making a fast push up to that resistance. This opens the door for breakout potential, and this could be an attractive scenario to follow for themes of USD-weakness, if we do get the breach of the 100.87 level in DXY.
The current two-month-high in AUD/USD is at .6806, and a break above that exposes the next resistance zone around the .6916 area. A breach of the low at .6565 negates bullish scenarios as we’d then be looking at fresh 2023 lows in the pair.
AUD/USD Weekly Price Chart
 Chart prepared by James Stanley, AUD/USD on Tradingview
--- written by James Stanley, Senior Strategist


