
US Dollar Talking Points:
- The US Dollar has snapped back from resistance at 106, helped along by a speech from Chair Powell last week and the NFP report on Friday.
- This has continued the range in both DXY and EUR/USD and there’s a few different spots of resistance for EUR/USD sitting overhead. GBP/USD is testing a big spot of resistance already and USD/JPY has so far held support above the 160.00 level.
- I’ll be discussing these themes in-depth in the weekly webinar. It’s free for all to register: Click here to register.
US Dollar Snaps Back from 106 Resistance
Continuing from last week’s discussion, the US Dollar has pulled back from resistance at the 106.00 handle on DXY and this provides some bearish near-term scope for the currency. Given the Euro’s heavy allocation of 57.6% in DXY, the fact that the major pair is nearing a few points of resistance provides some context to the US Dollar.
At the time of the webinar USD had pulled back to test resistance at prior support, around the 105 handle in DXY. There’s a couple of spots just a bit higher at 105.32 and 105.51.
US Dollar Four-Hour Price Chart
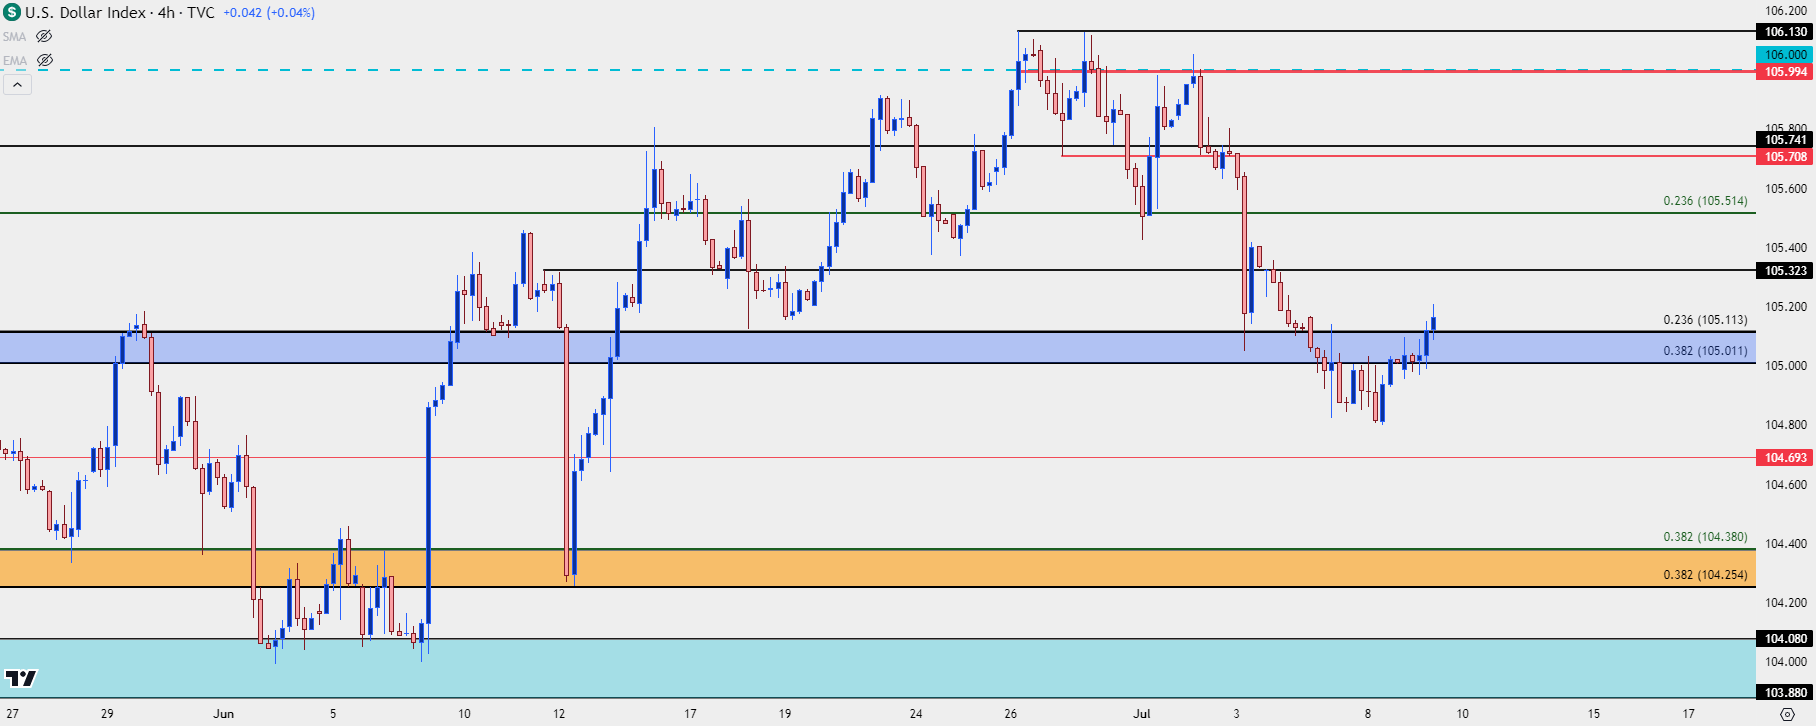 Chart prepared by James Stanley; data derived from Tradingview
EUR/USD
I had looked into EUR/USD on Monday as the pair has pushed towards longer-term range resistance, and there’s a few different spots of note. In the webinar, I showed the context around the 1.0943 level as this is the 50% mark from the same Fibonacci study that caught the highs at the 61.8 last July, and then the 2024 lows at 1.0611 in April.
EUR/USD Weekly Price Chart
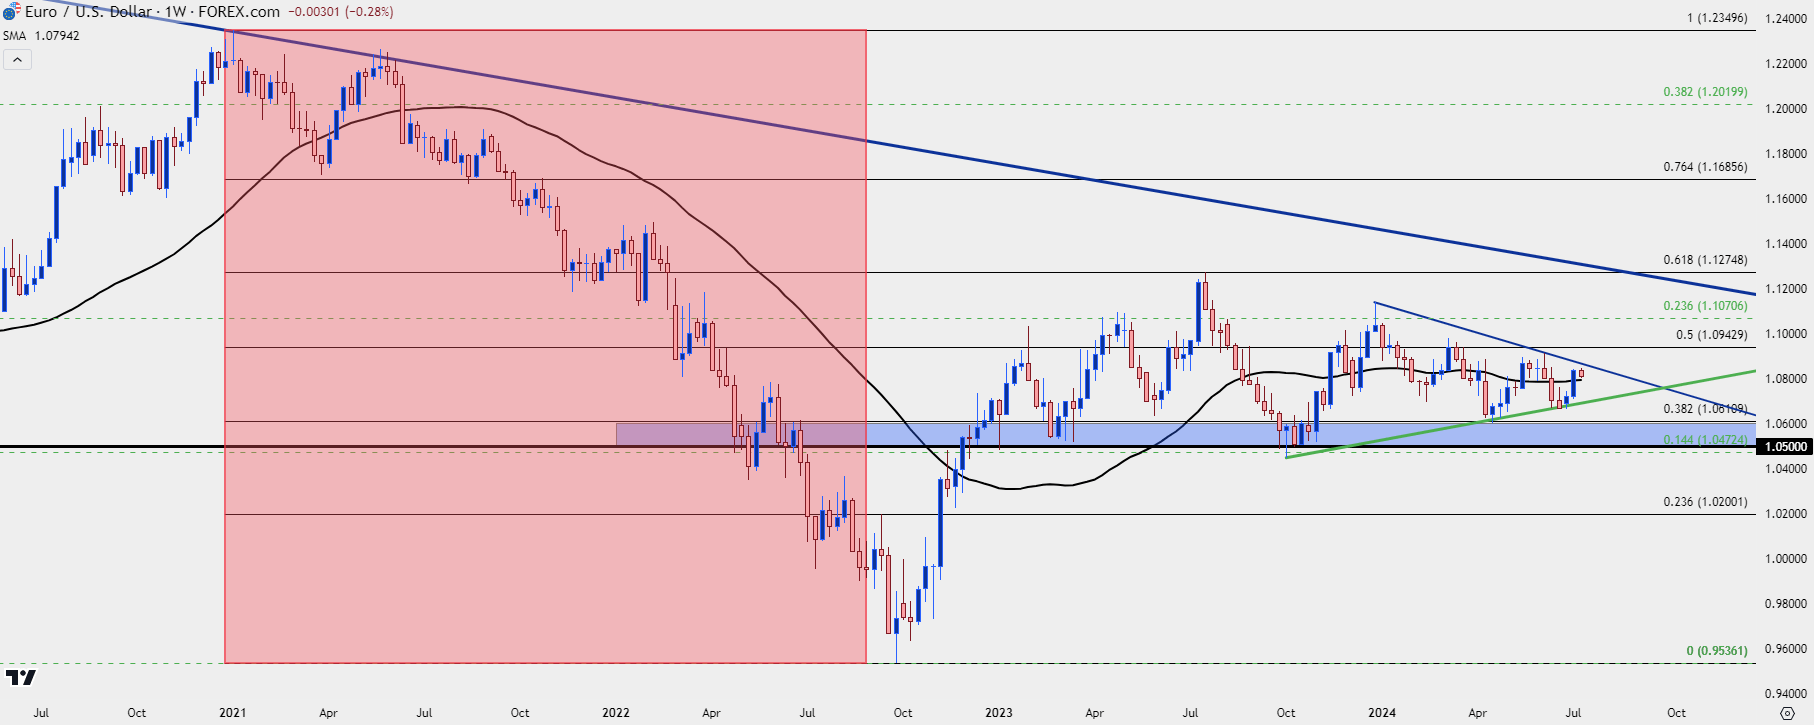 Chart prepared by James Stanley, EUR/USD on Tradingview
That resistance helped to hold the highs in March, and in May, sellers came in to defend a lower-high inside of the 1.0900 handle. There’s also the 1.1000 level that remains of issue in the event that bulls can force stretch above the Fibonacci level, and that price had set the high twice in the first couple weeks of the New Year.
At the time of the webinar, EUR/USD has started to test the support I looked at in Monday’s video.
EUR/USD Daily Price Chart
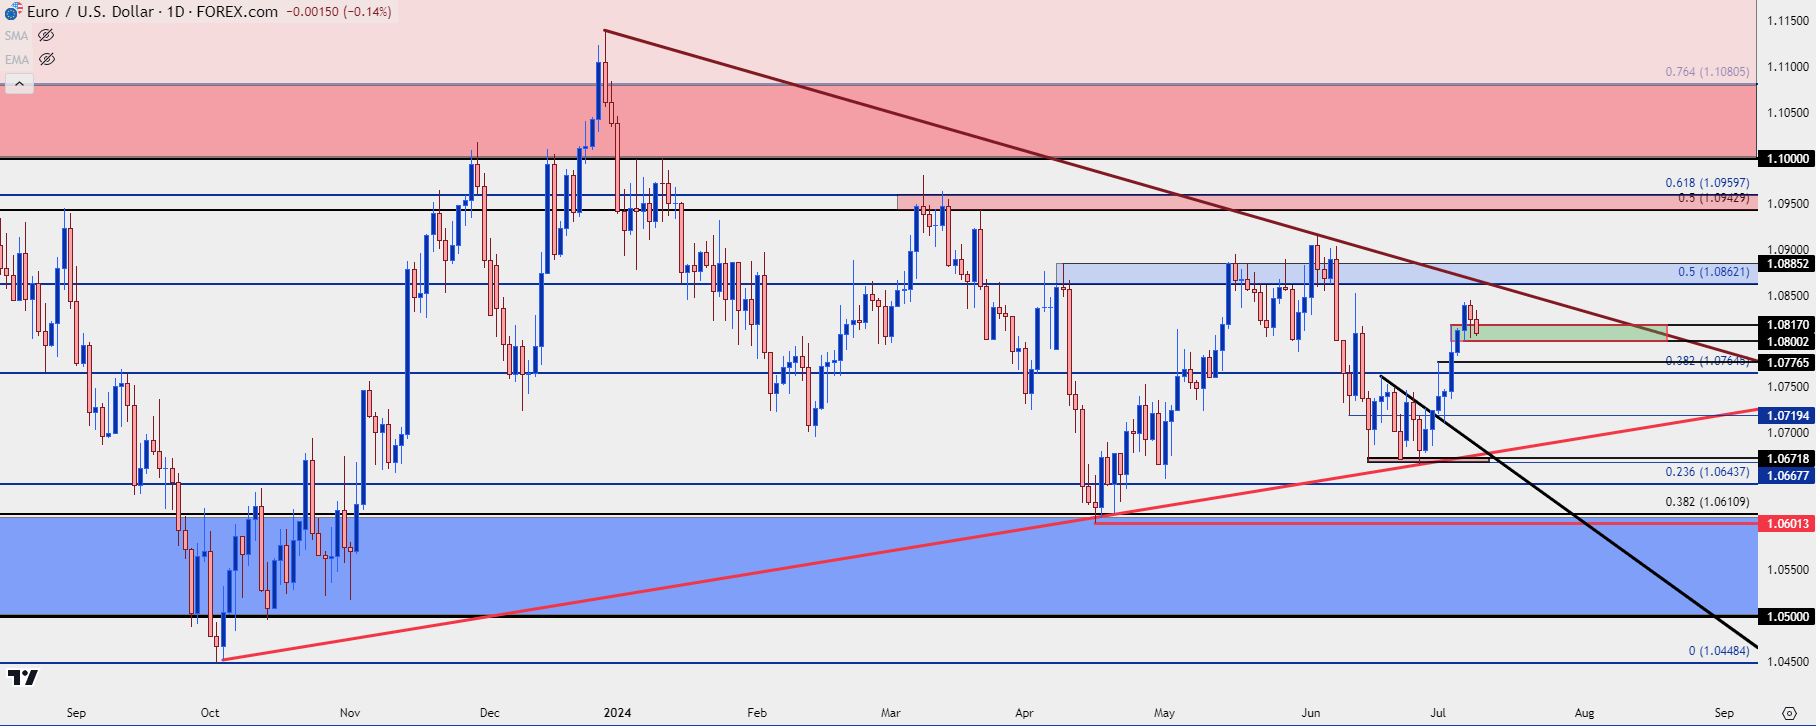 Chart prepared by James Stanley, EUR/USD on Tradingview
GBP/USD
GBP/USD has started re-test of a resistance zone that’s been rigid so far this year. From the 1.2800 handle up to 1.2900, bulls have faced a number of challenges on tests of that zone going back to December. As I had highlighted in the webinar, this would necessarily be something that I would consider a direct bearish driver, especially considering how quickly strength has shown in the pair.
This does, however, highlight support potential at prior resistance for bullish continuation scenarios, and this may have something of note for the longer-term backdrop in GBP/USD.
GBP/USD Daily Price Chart
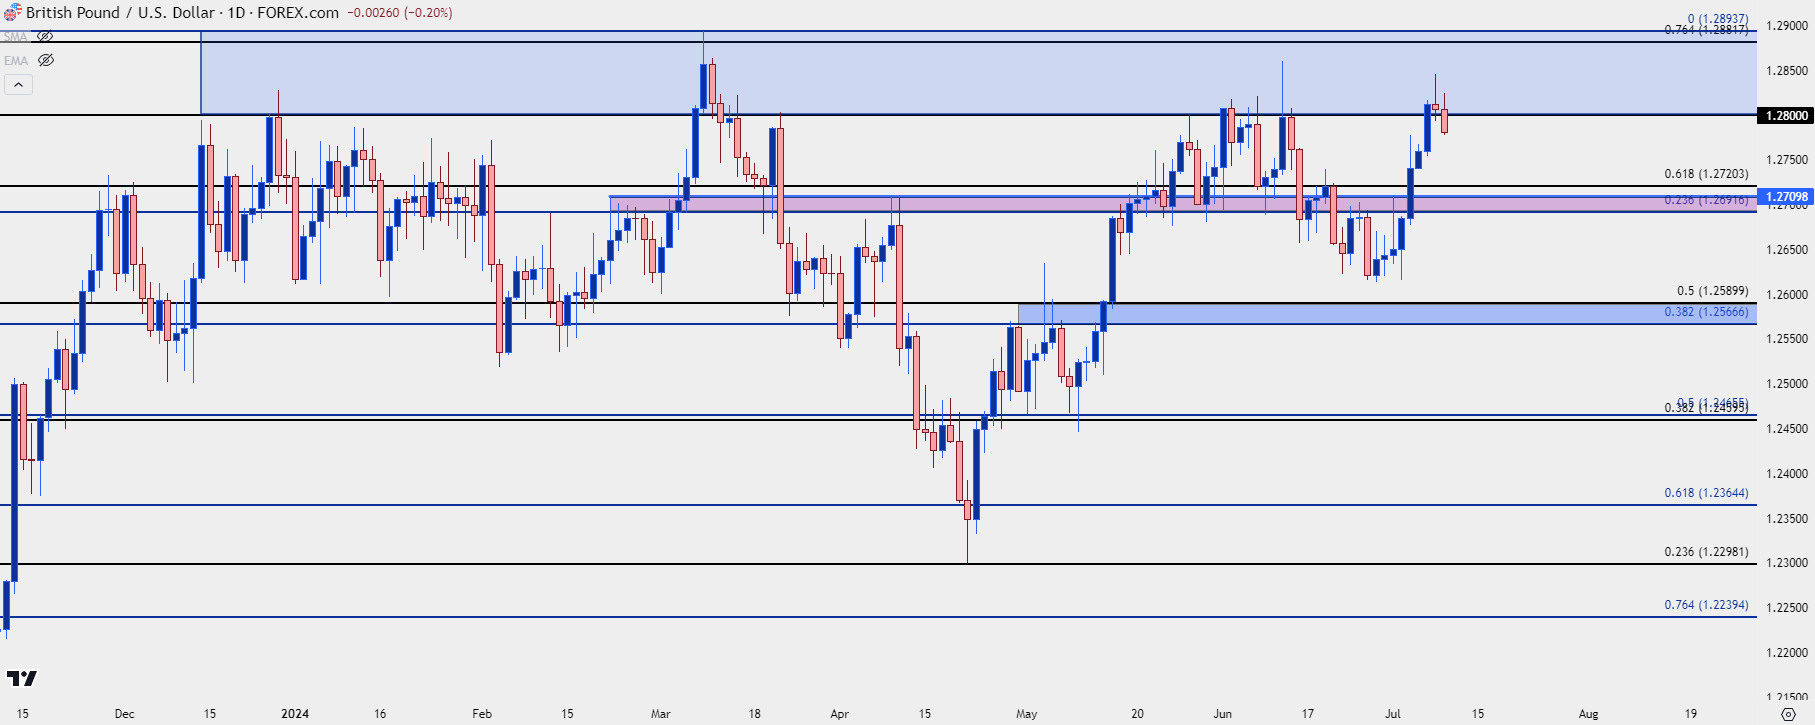 Chart prepared by James Stanley, GBP/USD on Tradingview
GBP/USD Bigger Picture
I didn’t identify this until after the webinar had ended, but from the weekly there’s an inverse head and shoulders pattern brewing which further puts focus on resistance. I think the US Dollar would need to put in a stern move of weakness to allow for the breakout to happen, but the context is there if bulls can push to a fresh high.
The big level sitting above that resistance is the 1.3000 psychological level, which was only briefly tested last year.
GBP/USD Weekly Price Chart
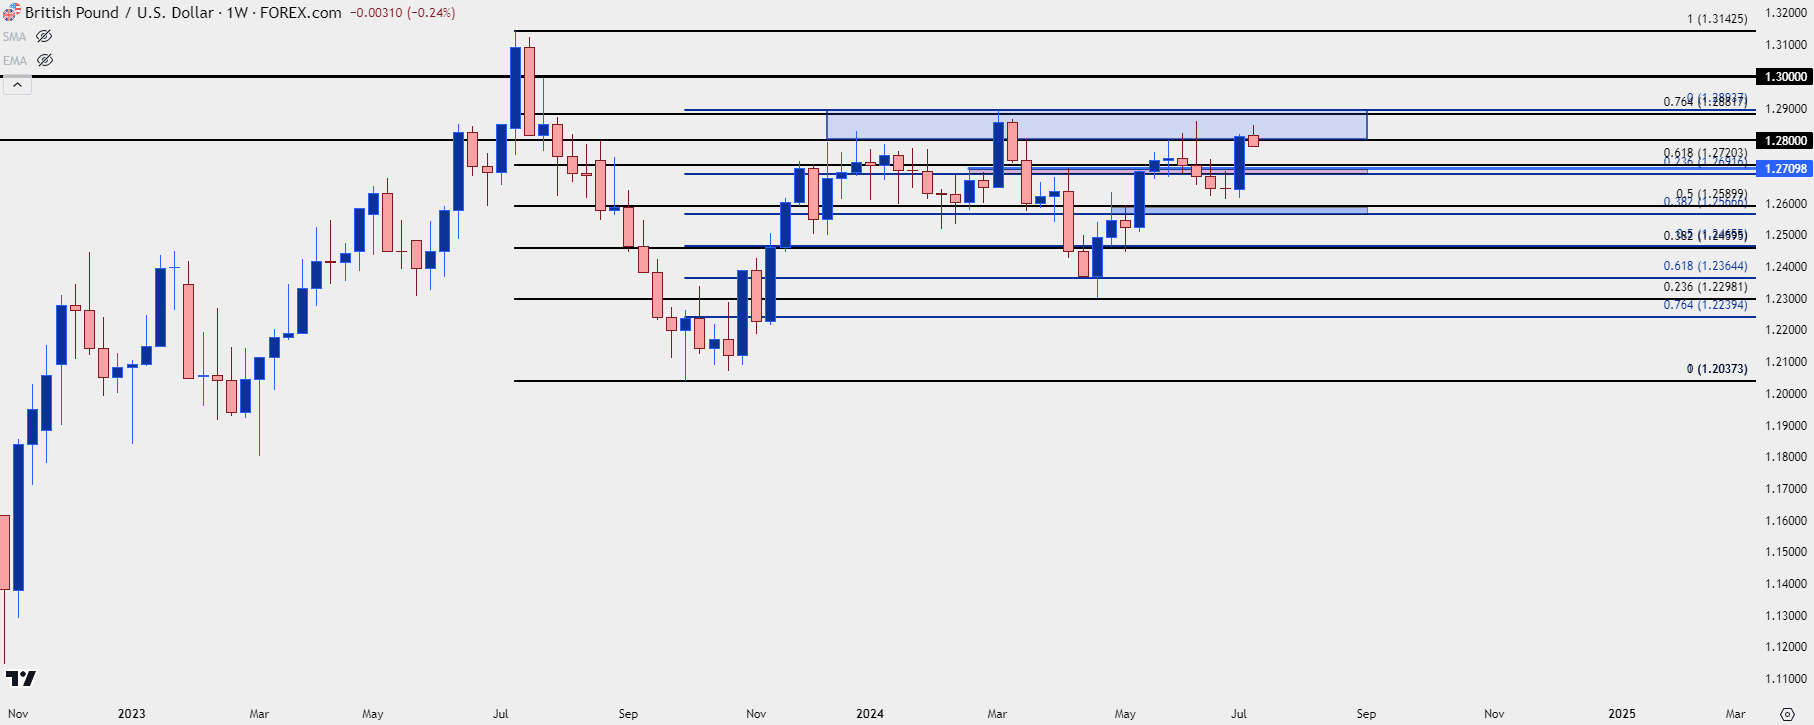 Chart prepared by James Stanley, GBP/USD on Tradingview
AUD/USD
One pair that I’ve been tracking for USD-weakness of late has been AUD/USD. The pair was previously testing resistance from a longer-term trendline, helping to make up a symmetrical triangle formation.
That trendline was in-play for six of seven weeks, helping to hold resistance, and bulls have recently started to budge through. There’s now support potential from prior resistance, around the .6704-.6714 zone, and then resistance sitting overhead in the .6781-.6824 zone.
AUD/USD Weekly Price Chart
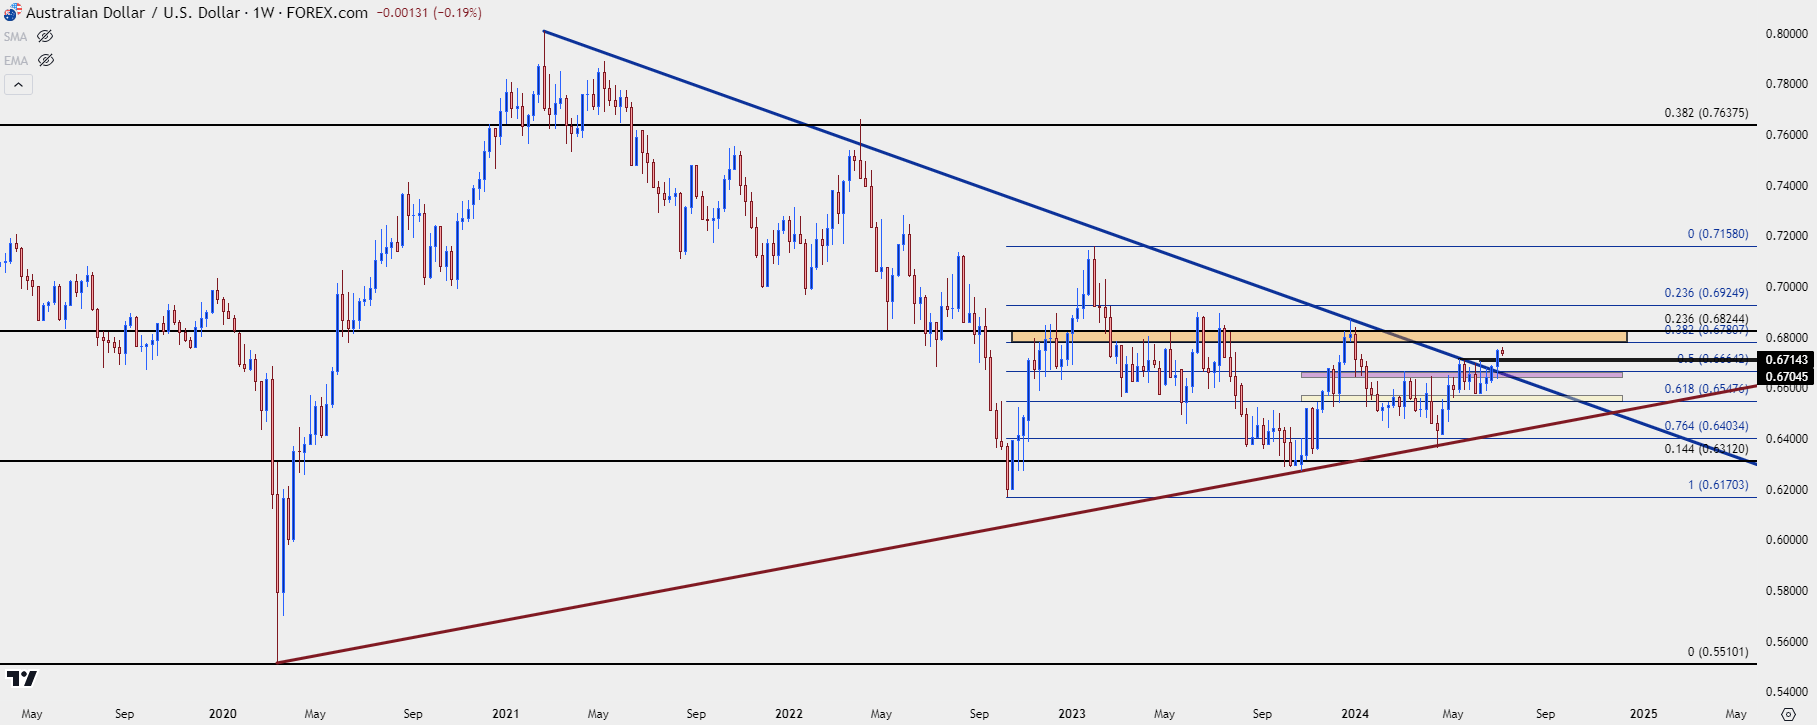 Chart prepared by James Stanley, AUD/USD on Tradingview
Gold (XAU/USD)
Gold had a very range-bound Q2, and there was even the build of a couple of different bearish formations given bull’s lacking ability to push through resistance.
I had looked into those in the prior webinar while also highlighting the other side of the matter, which was perhaps even more important; and that’s the fact that bulls have continued to defend support at lows even with the context of a descending triangle and a head and shoulders pattern.
Since the last trip to that trendline, Gold bulls have been building both higher highs and lows. The Fibonacci retracement produced by the May sell-off has a number of levels that remain of interest, such as the $2350 level that’s in-play again today to help with support. The price of $2368.47 is the 50% mark of that same study, and that held resistance earlier in the session. Above that, the level at $2387 remains notable as that’s the next major spot before a re-test of the $2400 psychological level.
Gold (XAU/USD) Daily Price Chart
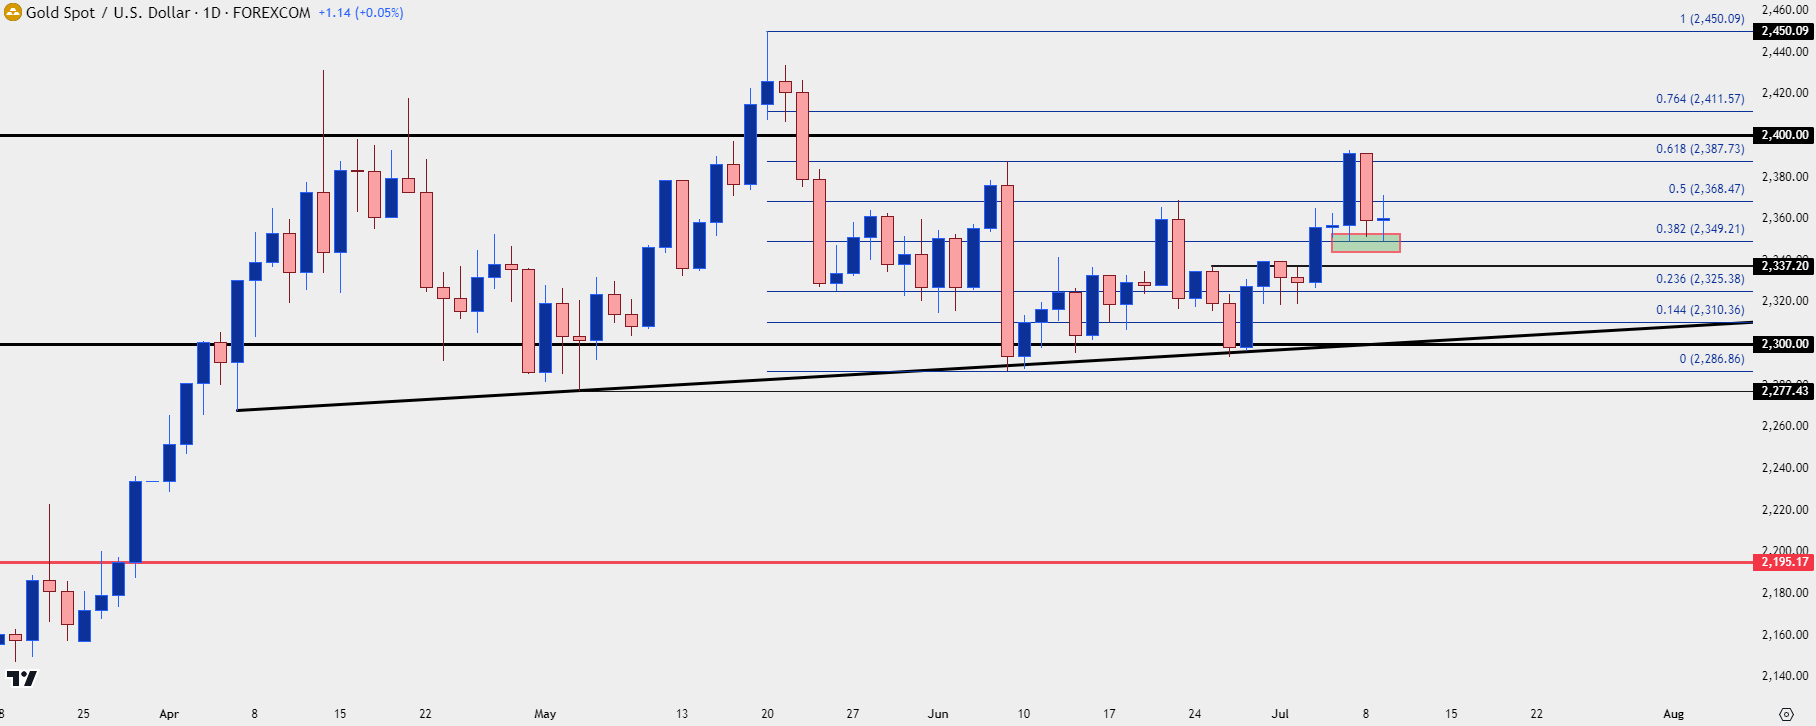 Chart prepared by James Stanley; data derived from Tradingview
--- written by James Stanley, Senior Strategist


