
US Dollar Talking Points:
- The US Dollar spent most of last quarter above the 200-day moving average, with five weeks of support tests from the weekly chart.
- The currency also started Q3 very near resistance from the range that’s been in-place for 18 months now, putting focus on EUR/USD range support that runs from the 1.0500 handle up to the 1.0611 Fibonacci level.
- I’ll be discussing these themes in-depth in the weekly webinar. It’s free for all to register: Click here to register.
US Dollar Spends Q2 Above the 200-DMA, but Will the Fed Push a Break?
The US Dollar had a spirited bullish trend in 2021 and 2022 as the Fed was initially saying that inflation was transitory and then, playing catch up. There was a fast retracement in Q4 of 2022 as the European Central Bank had to hike rates to stem inflation; but since then, both the US Dollar and EUR/USD have been range-bound.
With the ECB cutting rates in June and the Fed holding off on any rate moves given continued strength in the data, the US Dollar has angled up to range resistance, re-testing the 106.00 level in DXY as the door opened into Q3. The big question now is whether the Fed will allow for a break by retaining a relatively-hawkish stance. In the webinar I shared my opinion and from the below weekly chart, we can see that theme of strength as noted by the currency’s relationship with the 200-day moving average, combined with the push towards longer-term range resistance.
US Dollar Weekly Price Chart
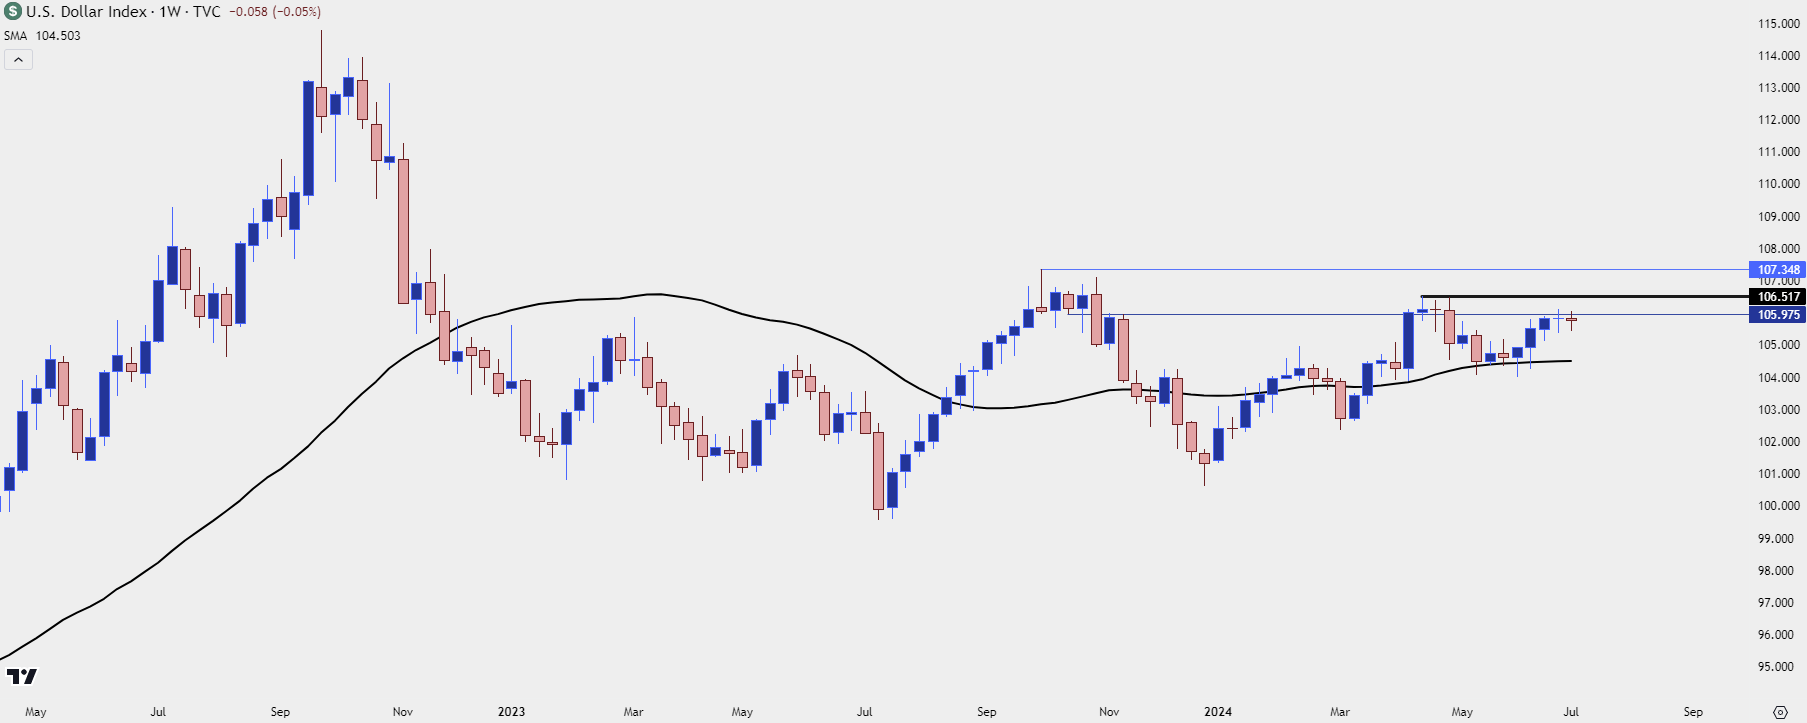 Chart prepared by James Stanley; data derived from Tradingview
US Dollar Daily
From the daily chart we can see that Q2 strength which was largely concentrated to the final month of the quarter. There was a strong bounce from the 104.00 support zone around the NFP report in early-June, with another strong boost around the FOMC rate decision on the 12th. But, more recently, that strength has been slowing as the 106.00 handle has come into play and there’s a major spot of resistance above that at 106.50.
US Dollar Daily Price Chart
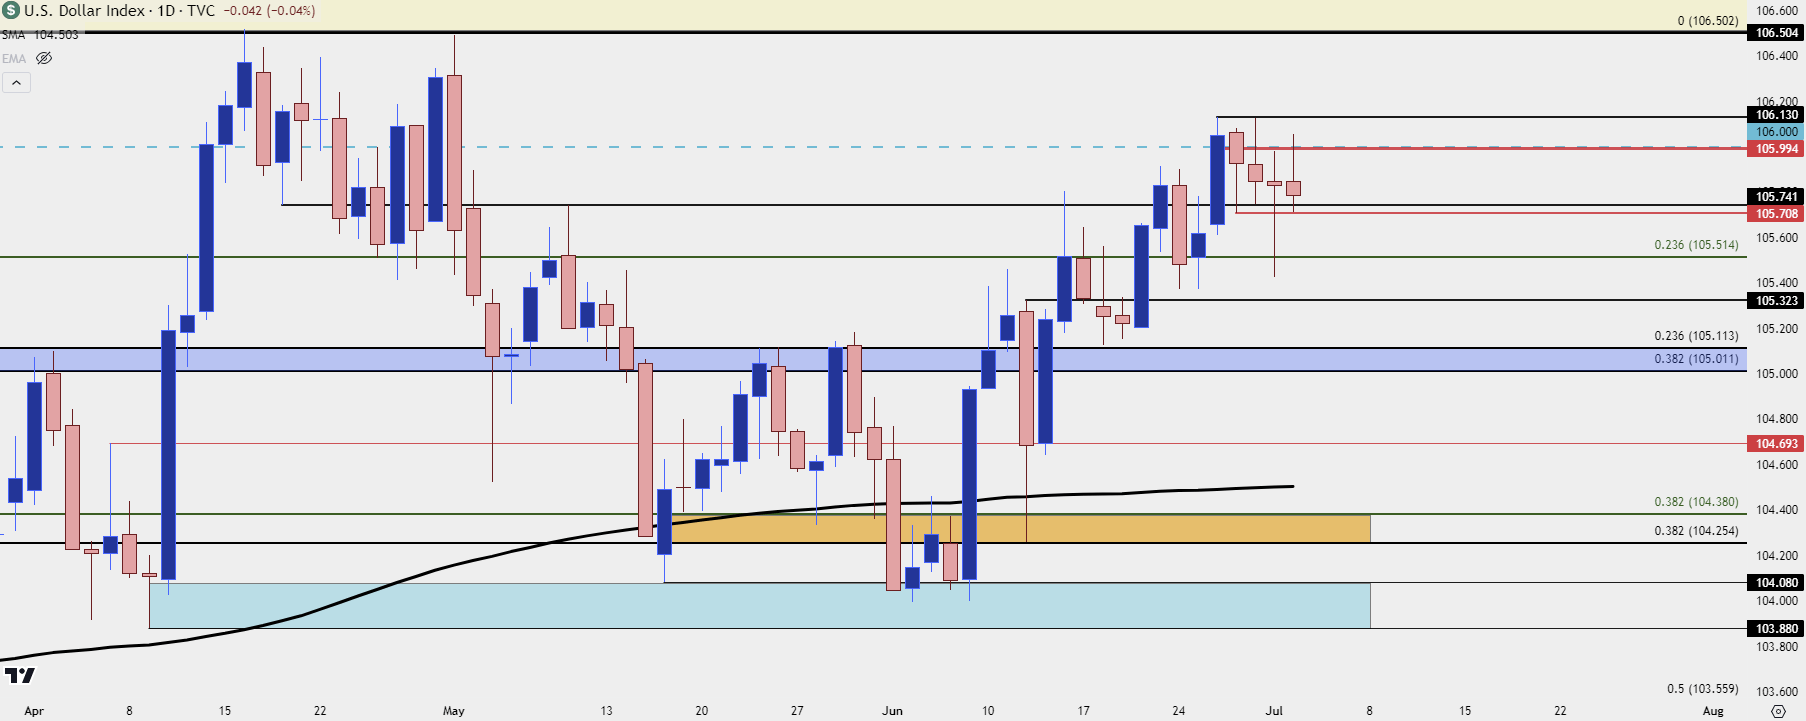 Chart prepared by James Stanley; data derived from Tradingview
EUR/USD
The other side of the above scenario in the US Dollar shows in EUR/USD. The Euro is 57.6% of the DXY quote, so its difficult to imagine prolonged trends in one without at least some participation from the other.
And as we heard the Fed oscillate between dovish and hawkish leanings, there’s often been a case of the ECB on the other side of the matter which has helped the range to build in both markets.
In EUR/USD, the currency held a higher-low in June despite the rate cut, and that was a higher-low from the April incident which saw price dig in support right at the top of the longer-term support zone.
At this stage, we have compression inside of the range but as I shared in the webinar, there’s a few ways of working with this.
EUR/USD Weekly Price Chart
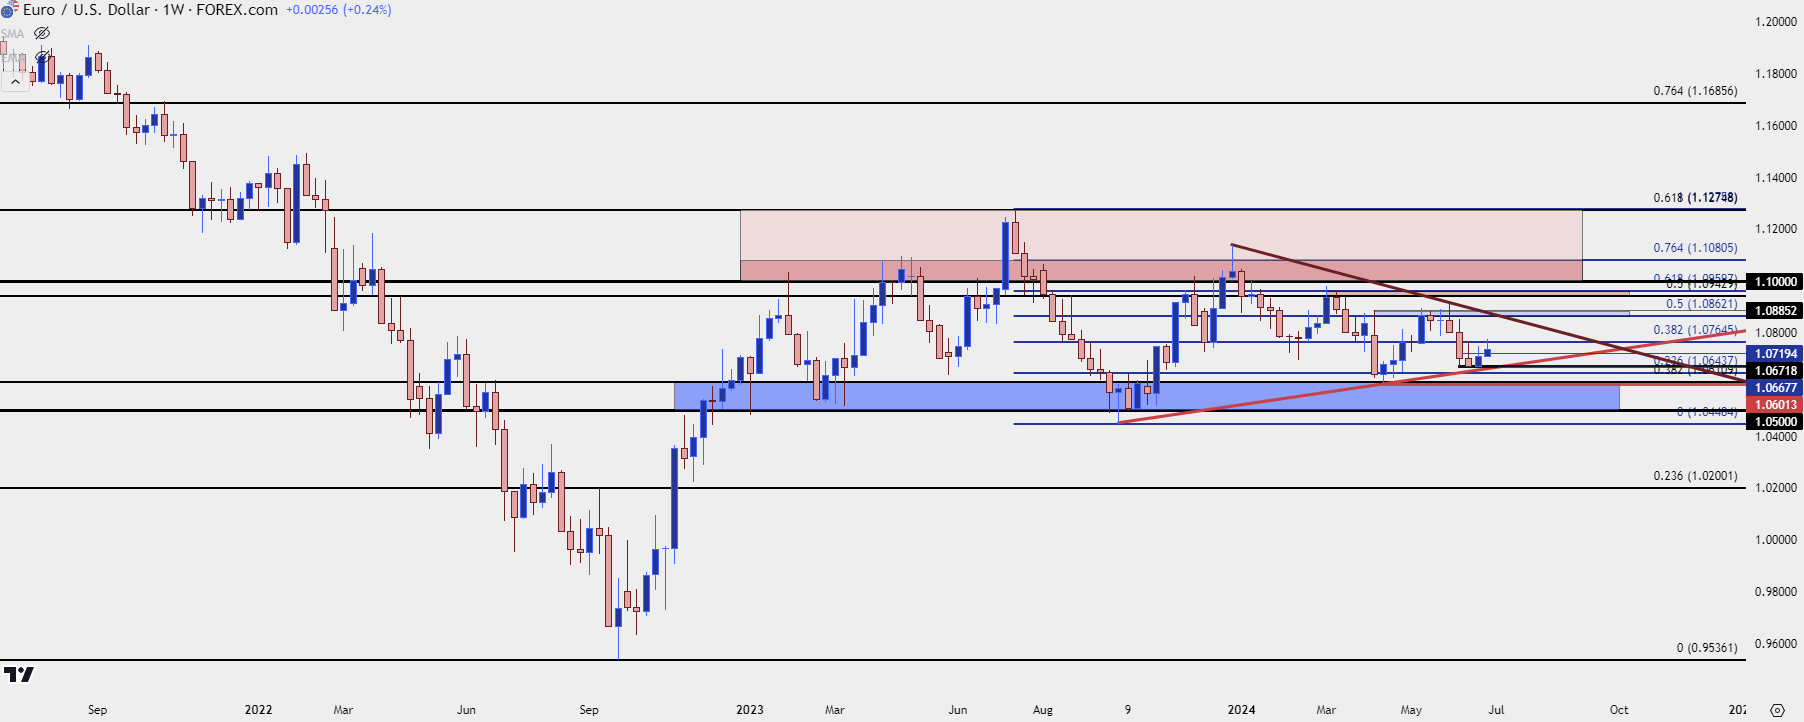 Chart prepared by James Stanley, EUR/USD on Tradingview
Using a shorter-term chart in EUR/USD can open the door to working with short-term trends in the context of that longer-term range. And given the recent hold of higher-low support as looked at above, the four-hour chart shows a recent higher-high to go along with a possible higher-low, as taken from a bearish trendline that setup in the back-half of June trade.
EUR/USD Four-Hour Price Chart
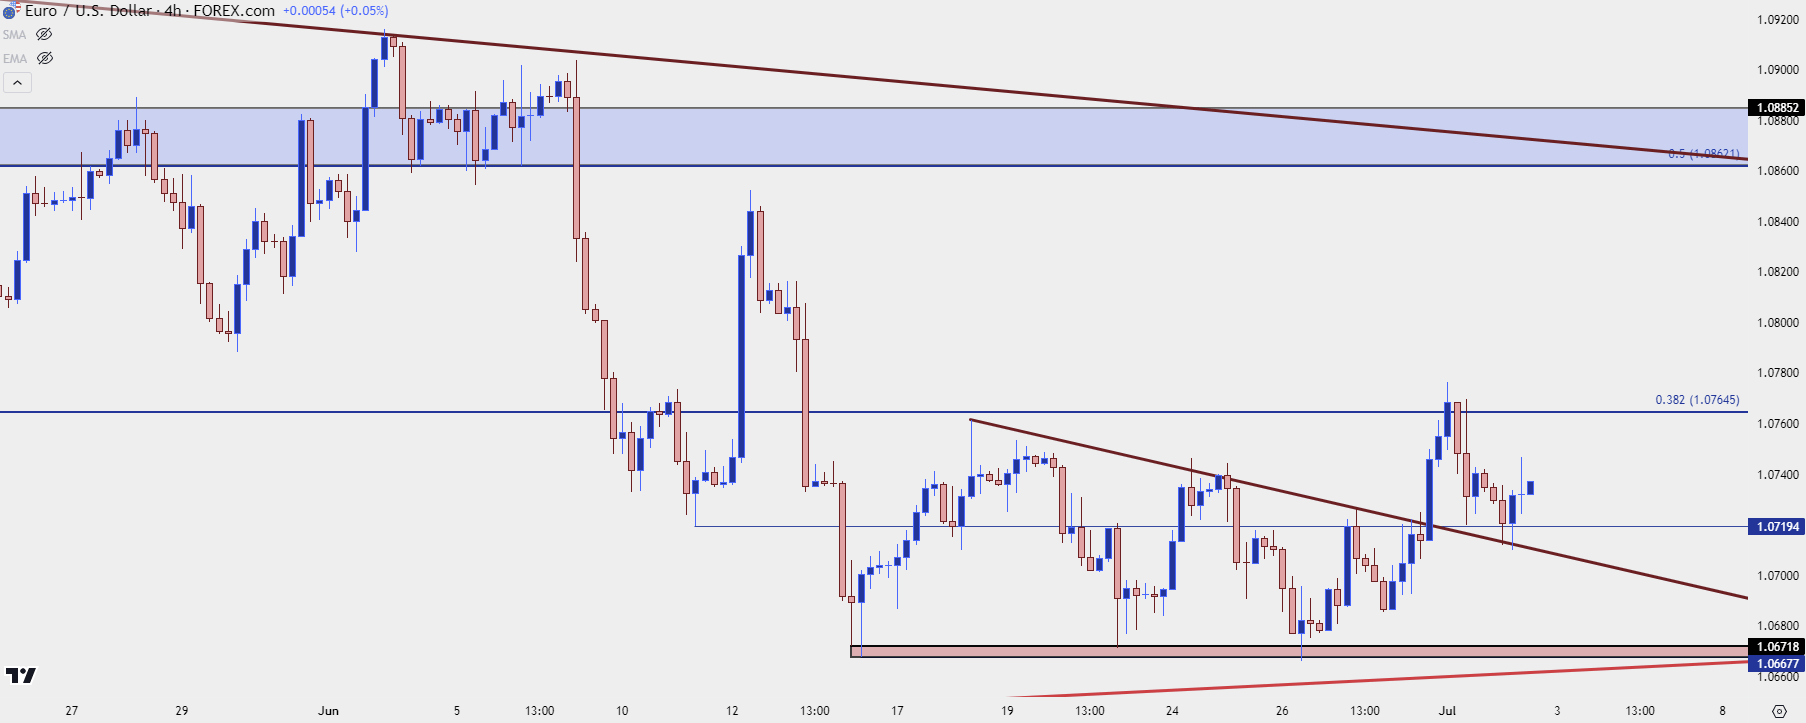 Chart prepared by James Stanley, EUR/USD on Tradingview
AUD/USD – USD Weakness Scenarios
If we do see the US Dollar take a step back from that longer-term range resistance, AUD/USD is of interest to me. There’s a longer-term trendline that’s been in-play as resistance for six of the past seven weeks. AUD/USD bulls have continued to push, even during times of USD-strength, and this highlights the fact that there’s bullish breakout potential if USD buyers do take a step back.
AUD/USD Weekly Price Chart
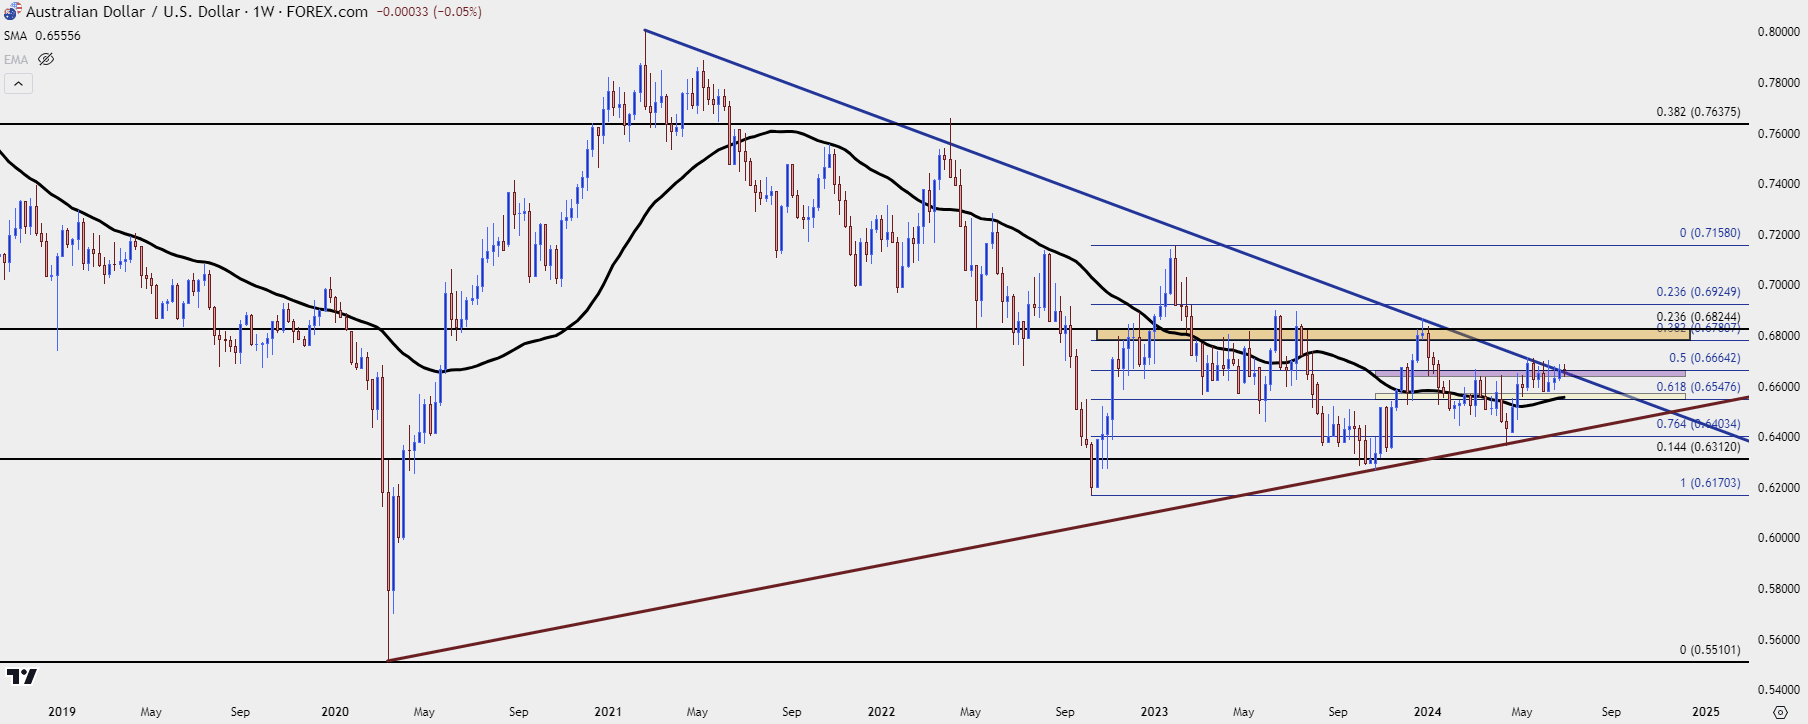 Chart prepared by James Stanley, AUD/USD on Tradingview
Gold
It was a ranging Q2 for Gold and it was especially indecisive in the month of June as Gold futures printed a spinning top for the month. After extended upper wicks in both April and May, that gives the longer-term chart the appearance of an oncoming pullback. But, as I shared in the webinar, the way that these matters roll out isn’t so clear cut.
Gold Monthly Price Chart
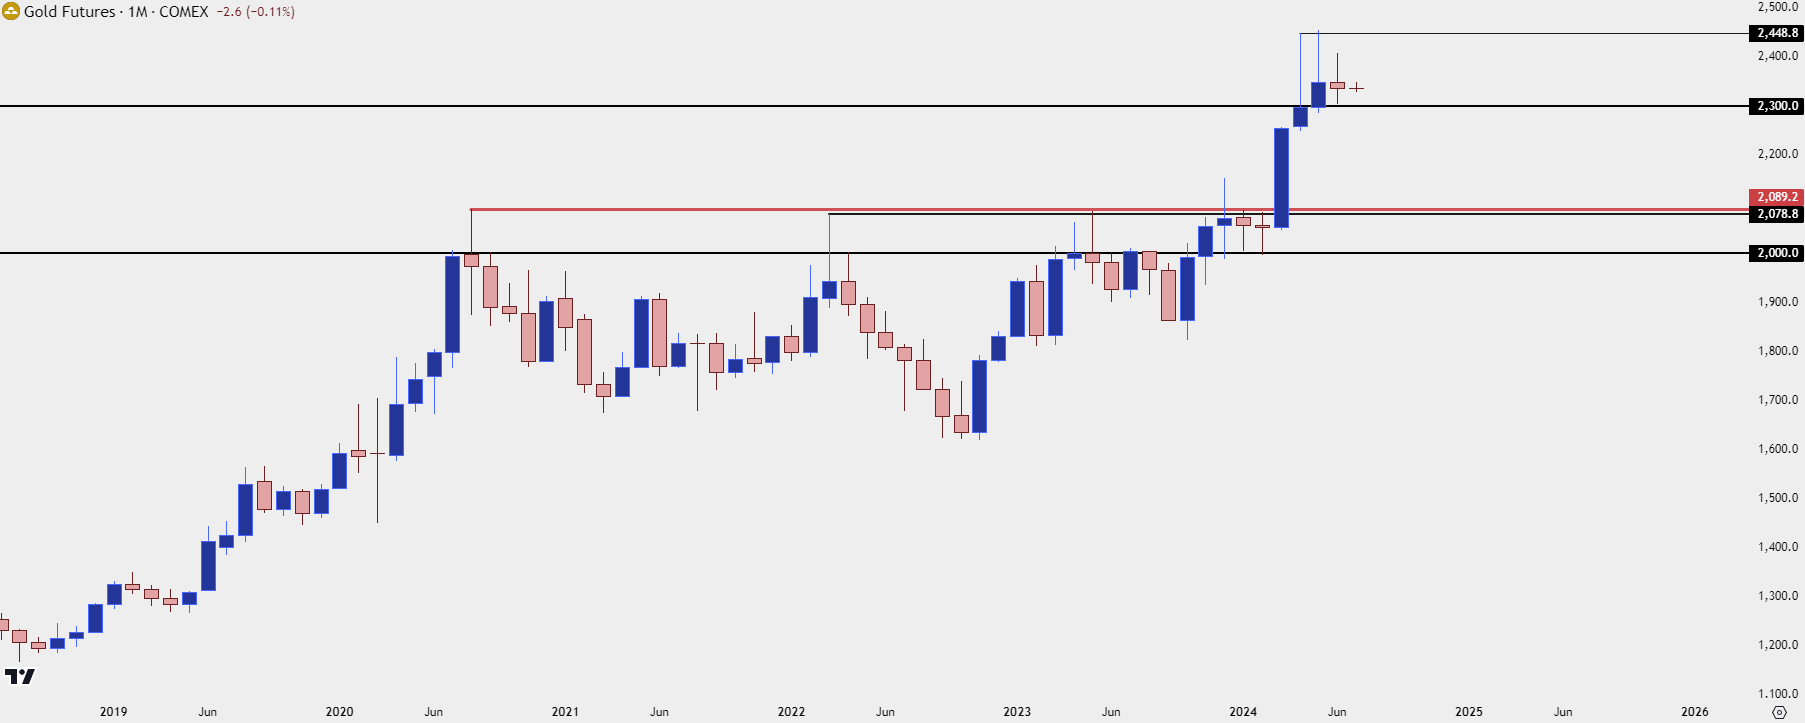 Chart prepared by James Stanley; data derived from Tradingview
On a shorter-term basis, there’s a few different bearish items that I had highlighted in the webinar.
A case can be made for both a head and shoulders pattern and a descending triangle, both of which put the focus on support for breakdowns to trigger either formation. There’s also a recent bear flag, the underside of which has so far held resistance at a familiar spot of 2350.
But – notably – bears have had an open door to make that push for a month and, so far, they’ve failed; and if anything, there’s been continued bullish anticipation by the supported hold of higher-lows, most recently at the 2304 spot.
If that support gives way the backdrop can quickly change to bearish as the above formations would show further progress. But, for now, bulls have continued to hold that key support and that remains the more important item, in my opinion.
Gold Daily Price Chart
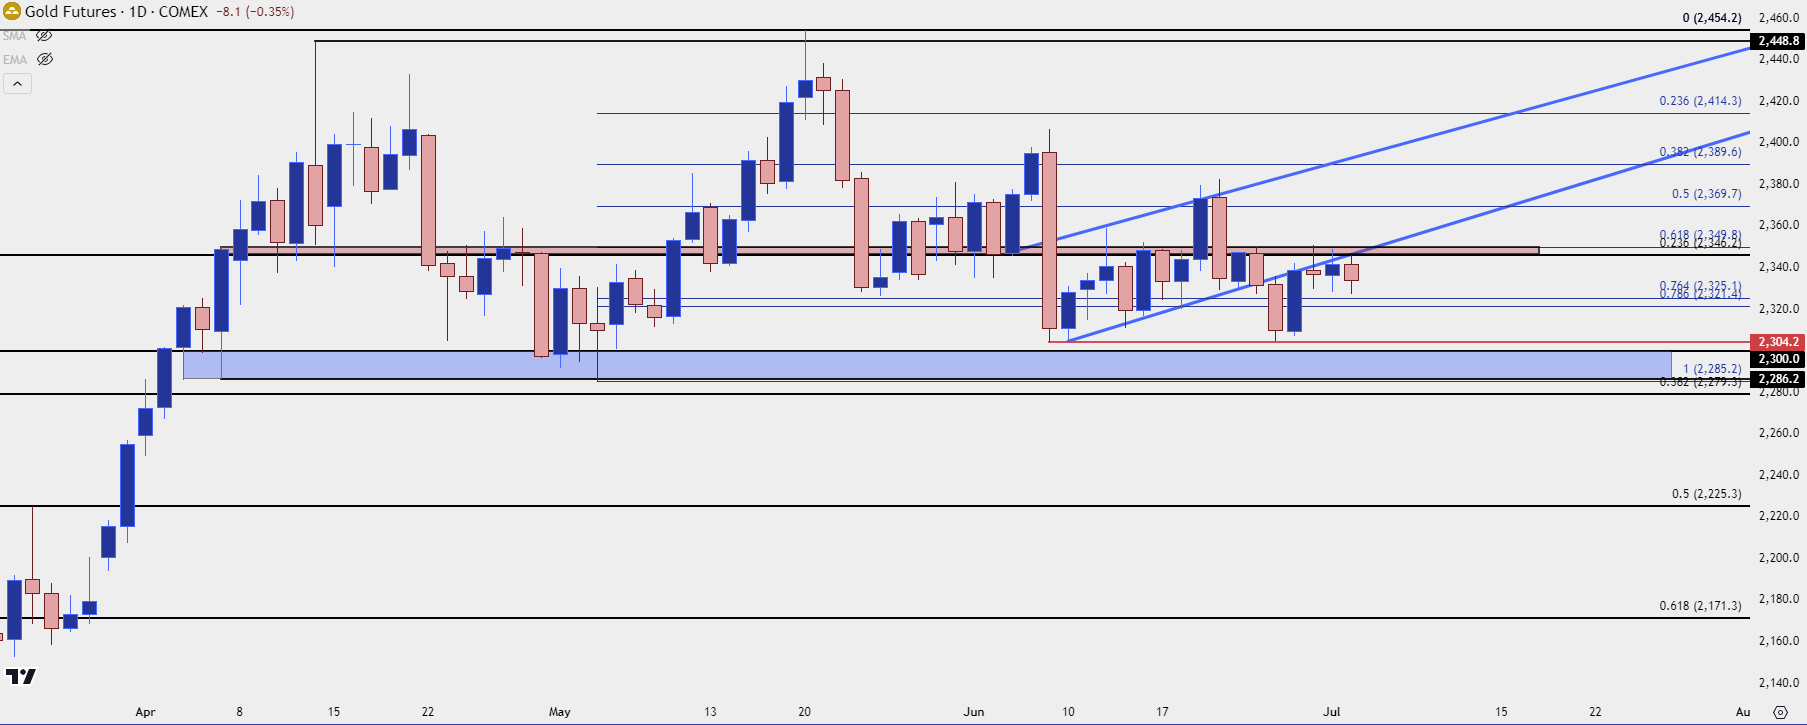 Chart prepared by James Stanley; data derived from Tradingview
Bitcoin
In the webinar I went over a historical sample of what I consider to be interplay between Gold and Bitcoin, drawing back to August of 2020.
As Gold has ranged since the Q2 open, so has Bitcoin, and BTC/USD has been in a consistent bearish trend since the NFP report was released in early-June.
Last week saw a test below the 60k handle, but it couldn’t last as bulls came back in to leave an extended lower wick on that candle. There was a bit of follow-through, as well, with a higher-low right at the 60k level on Friday of last week. That’s led to continued strength and at this point, there’s the possibility of a short-term bullish trend sparking in the longer-term range.
Bitcoin (BTC/USD) Daily Price Chart
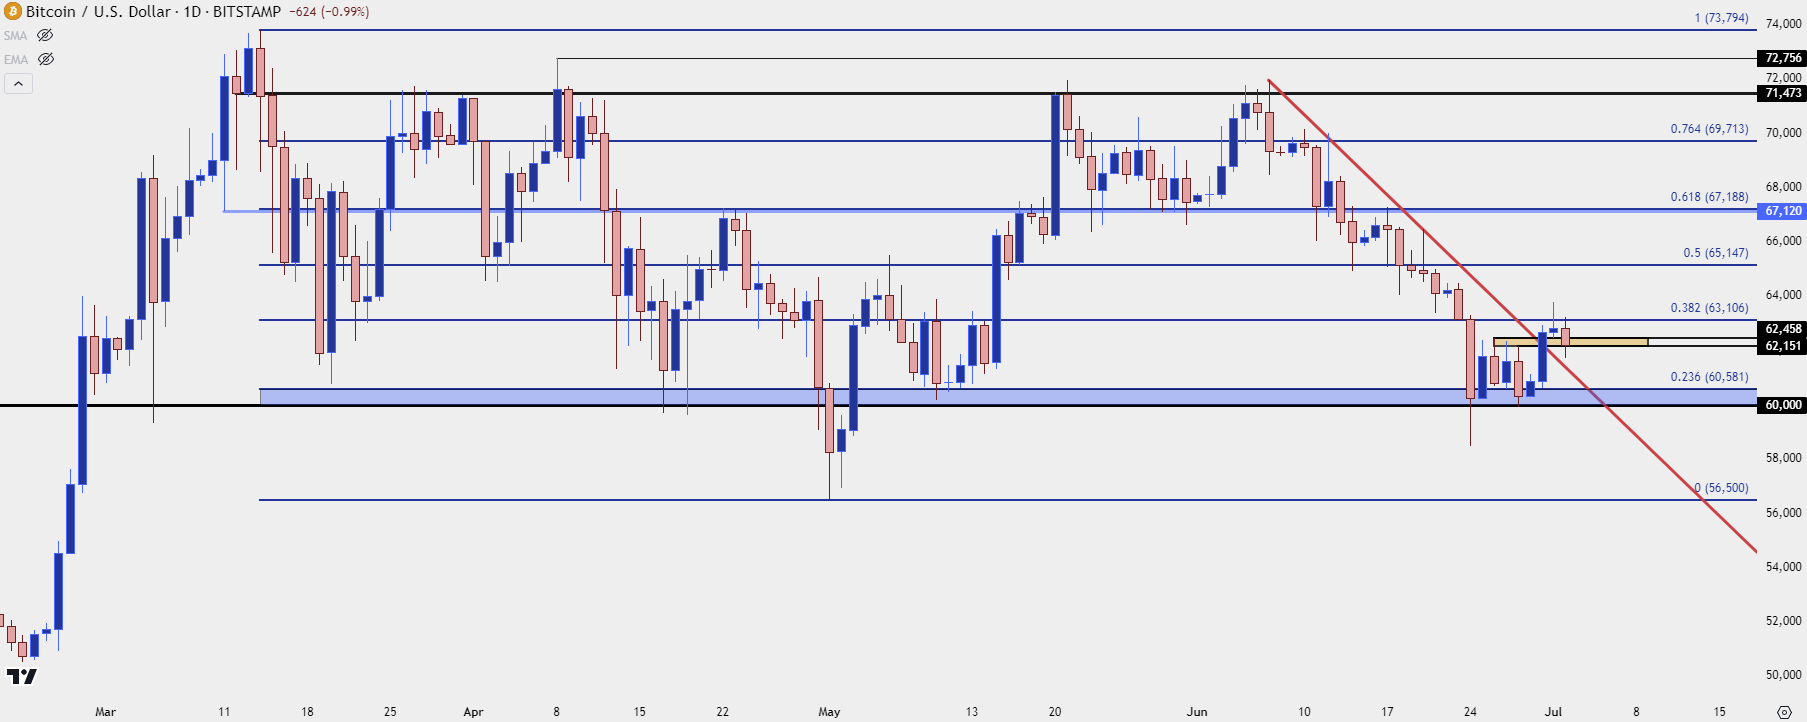 Chart prepared by James Stanley; data derived from Tradingview
On shorter-term charts, we can see that push up to a near-term higher-high, and the question now is whether bulls can hold yet another higher-low. Given that the last higher-low was at the 60k level, bulls would need to show up before another re-test there to keep the sequence alive, further opening the door for bullish continuation.
Bitcoin (BTC/USD) Four-Hour Price Chart
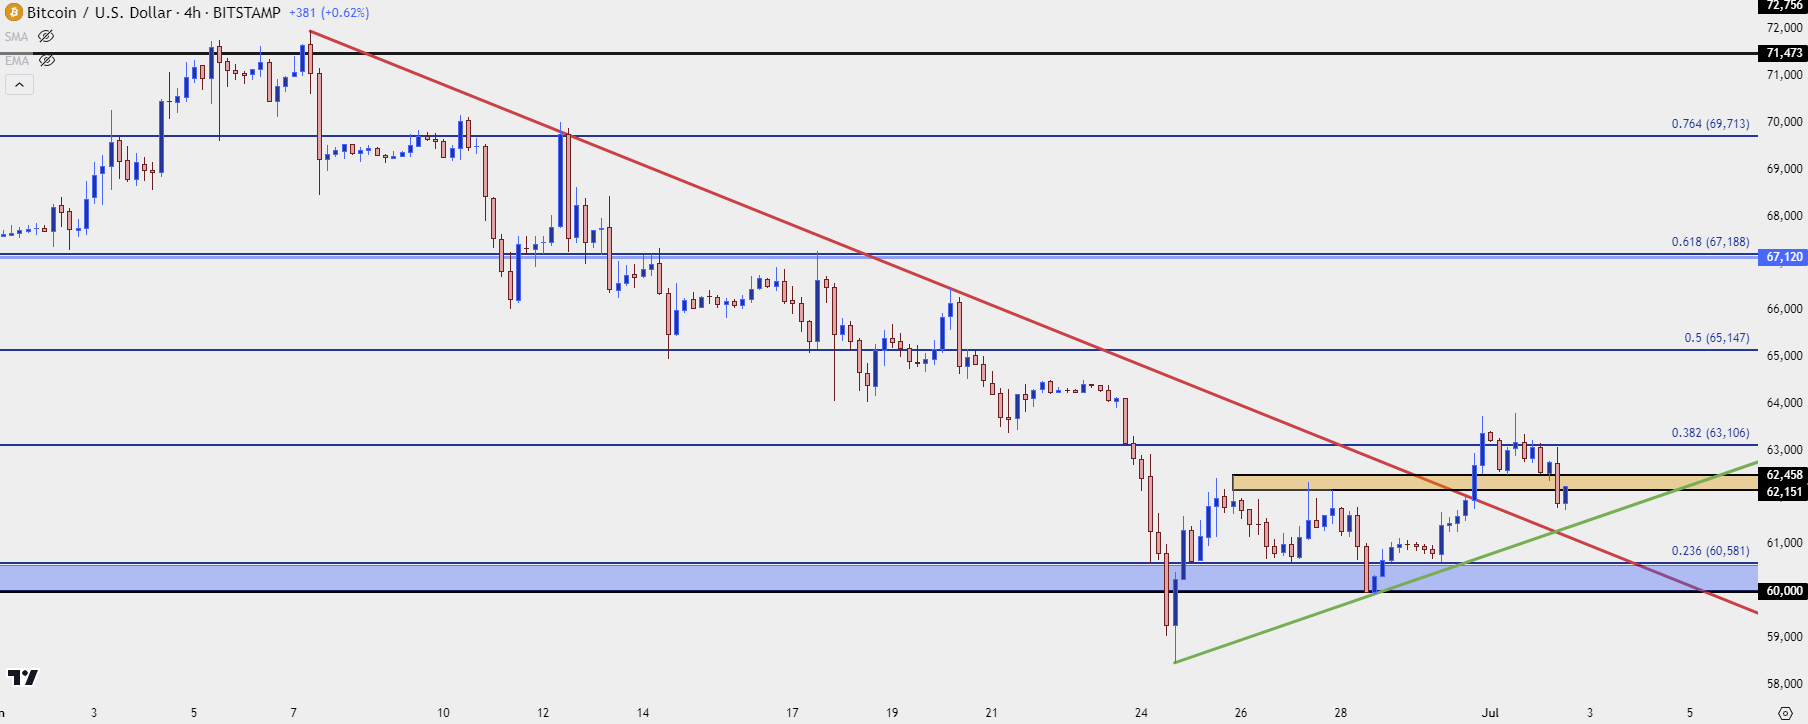 Chart prepared by James Stanley; data derived from Tradingview
--- written by James Stanley, Senior Strategist


