
US Dollar Talking Points:
- The US Dollar is continuing the bounce from support that was looked at yesterday.
- GBP/USD has pulled back before a 1.3000 test and RSI on the daily remains in overbought territory, as of this writing. USD/JPY has held trendline support, and EUR/USD is working around a possible higher-low after last week’s breakout. The big story on the day is gold, which has broken out to a fresh all-time-high after retaining support at a bullish trendline in late-Q2 trade.
- This is an archived webinar and you’re welcome to join the next installment: Click here to register.
The US Dollar had a harsh start to Q3 as the currency continued to sell-off from the 106.00 handle in DXY. As looked at yesterday, the USD was red for ten of 12 days, including a large push last Thursday after the release of US CPI data. And while the crowd cheered headline CPI hitting a flat 3-handle, expectations for rate cuts this year heated up, with markets now looking for three consecutive 25 bp cuts in the final three meetings of the year.
For a Fed that has traditionally avoided tampering with policy around Presidential elections, markets are now expecting the bank to go aggressively-dovish as we move into the next one.
In response, the USD put in a large move last Thursday on the back of that print, re-engaging with the same 104.08 level that was in-play last quarter. I had looked at that support zone in the prior webinar, on Tuesday, highlighting the importance of bulls defending that to keep the range in-play.
So far that has happened: The bounce on Thursday saw sellers go back in but, they were once again thwarted at 104.08. The level held through yesterday’s trade and that bounce has held through this morning for another boost in the USD, and this provides scope for bullish scenarios, particularly from a short-term basis as looked at in the webinar. Bigger picture, however, it’s too early to decipher whether this is a mere pullback to a lower-high or the start of a bullish sequence within the broader range. I looked at setups on both sides of the matter, some of which are included below.
US Dollar Daily Price Chart
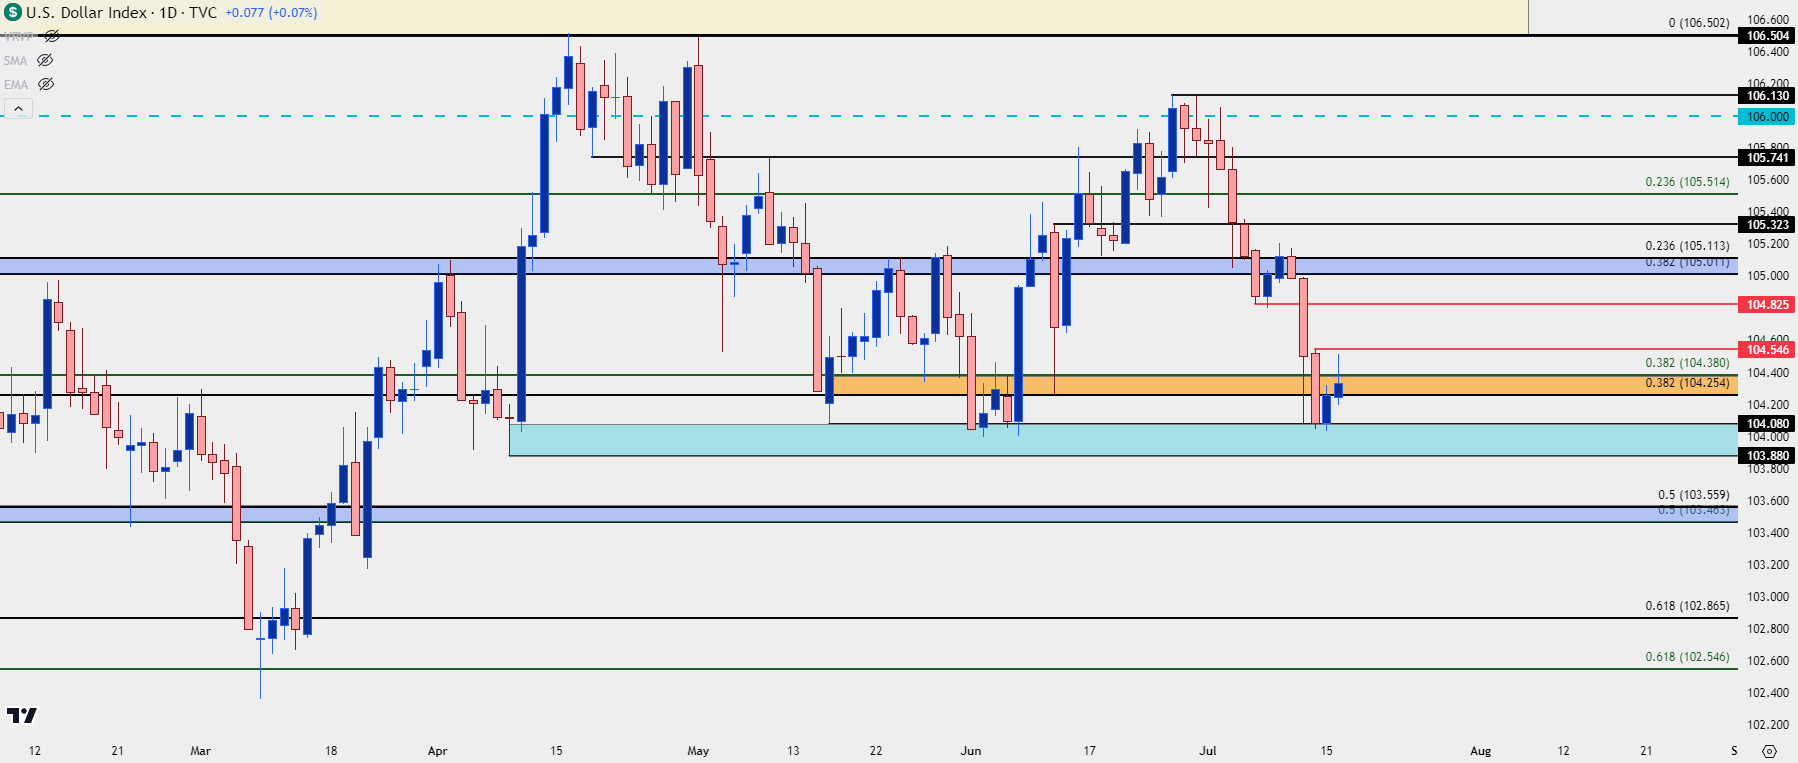 Chart prepared by James Stanley; data derived from Tradingview
EUR/USD Range Resistance But There’s More Overhead
The Euro is 57.6% of the DXY quote so, logically, if the USD is going to bounce from that longer-term support, it’s probably going to need some help from the Euro.
Last week I looked into the EUR/USD pair and highlighted higher-low support potential in the webinar. And today, there’s a similar backdrop there where last week’s breakout has since calmed and, at this point, there’s a show or support at prior resistance.
Overhead is another level of importance at 1.0943. That’s the 50% mark from the same Fibonacci study that caught the high last year at the 61.8% (1.1275) and the low this year at the 38.2% (1.0611). The 50% mark of that move plots at 1.0943 and this was last in-play in March, helping to hold the highs before that 2024 low posted a little more than a month later.
I’m connecting 1.0943 to another Fibonacci level at 1.0960 to create a resistance zone; and above that, the 1.1000 level looms large.
EUR/USD Daily Price Chart
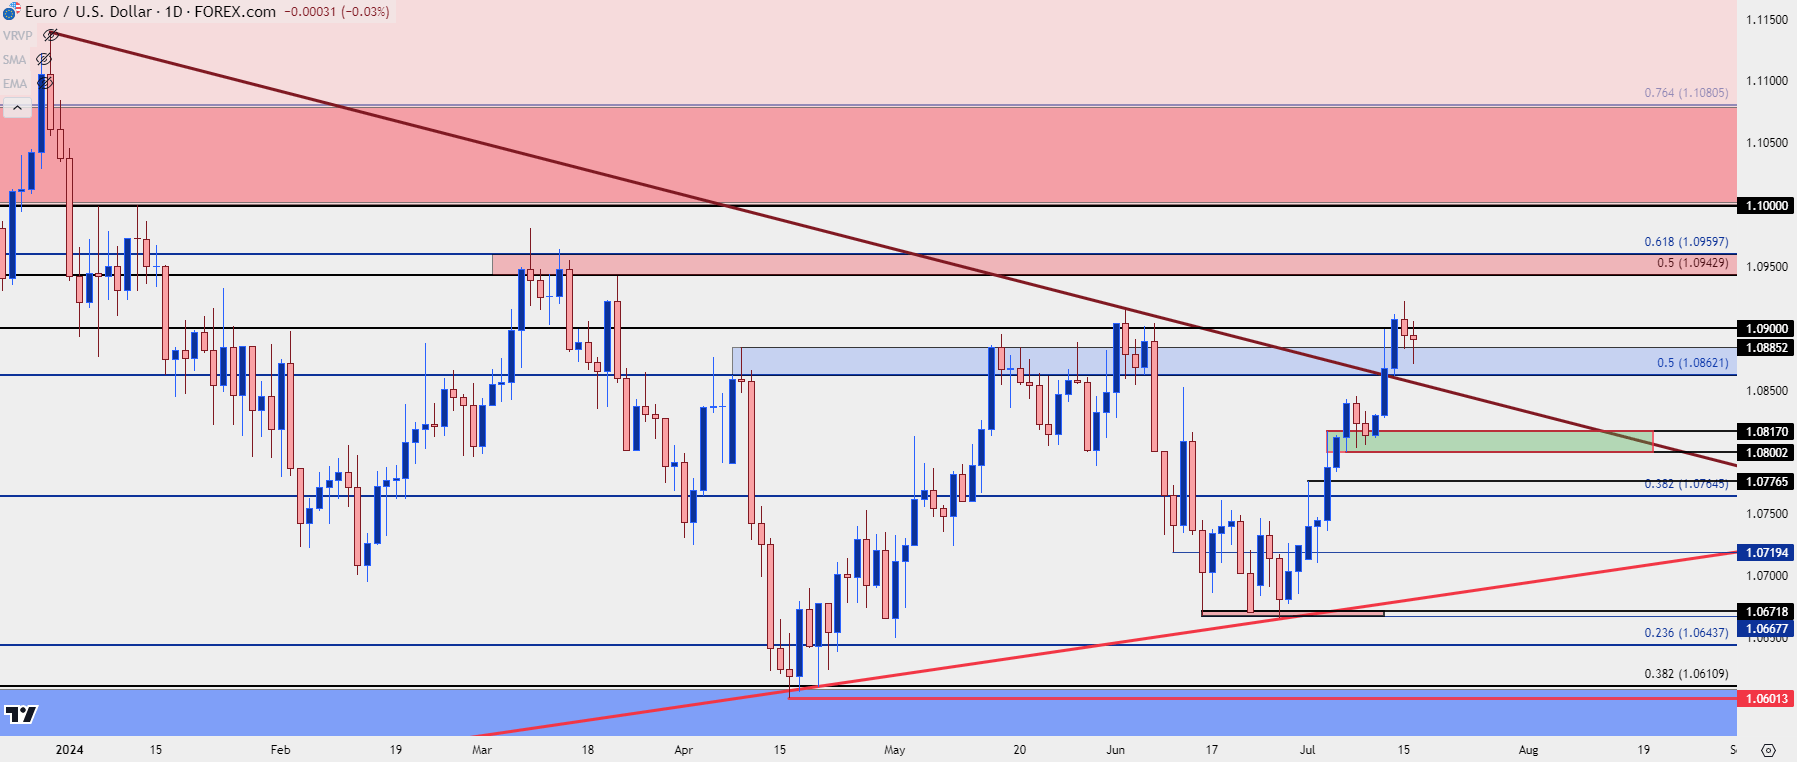 Chart prepared by James Stanley, EUR/USD on Tradingview
GBP/USD
While EUR/USD has a more debatable backdrop with multiple spots of resistance overhead, GBP/USD has run up to a major level at the 1.3000 handle.
I talked about this in the webinar, as the big figure hasn’t yet come into play and that can be symptomatic of the level itself, as prices five or ten pips away can make for a less appealing backdrop for bulls to chase the move. That can then lead to pullback, but the big question with sustainability of the trend is when, where and how bulls re-enter to bid support. The more aggressive they are, then, ideally, the faster that would happen.
But going along with that near-1.3000 test is an overbought RSI reading on the daily and this further reinforces difficulty of chasing the move after a massive breakout.
If GBP/USD does poke its head above 1.3000, there could be reversal themes to entertain, particularly if the test happens quickly while RSI is still in overbought territory.
GBP/USD Daily Price Chart
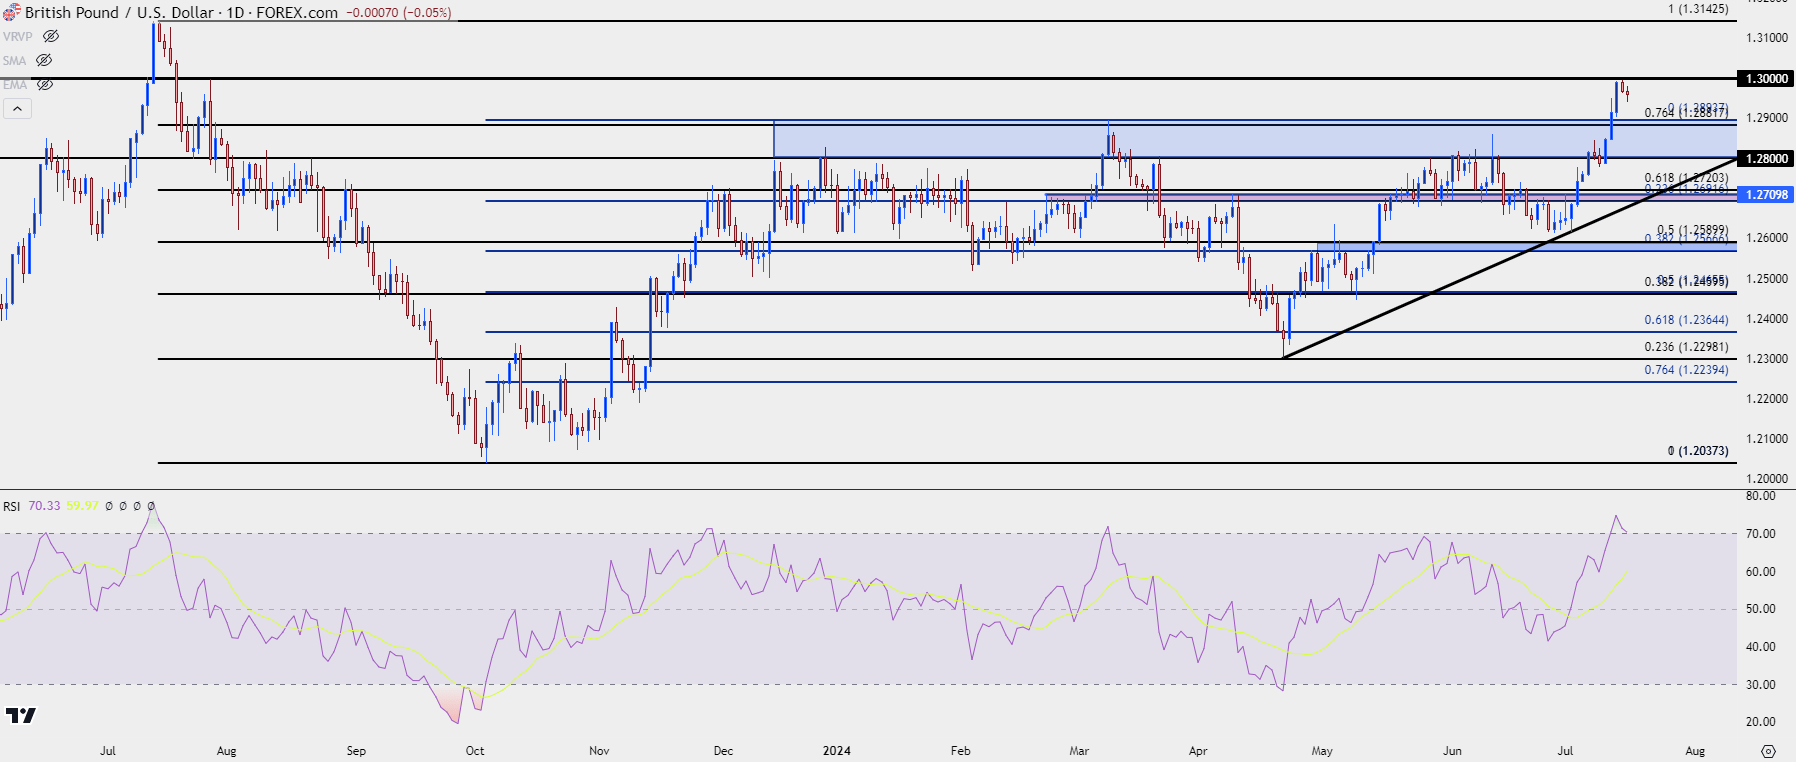 Chart prepared by James Stanley, GBP/USD on Tradingview
USD/JPY
One of the contributing factors to the USD weakness last week was another round of intervention from the Bank of Japan. This showed on Thursday just after the CPI report, and it looks like there was another push on Friday.
This propelled USD/JPY back-below the 160.00 level and on Friday, support showed at a bullish trendline. That has so far held the lows with a bounce showing on Monday and continuation so far today.
USD/JPY Daily Price Chart
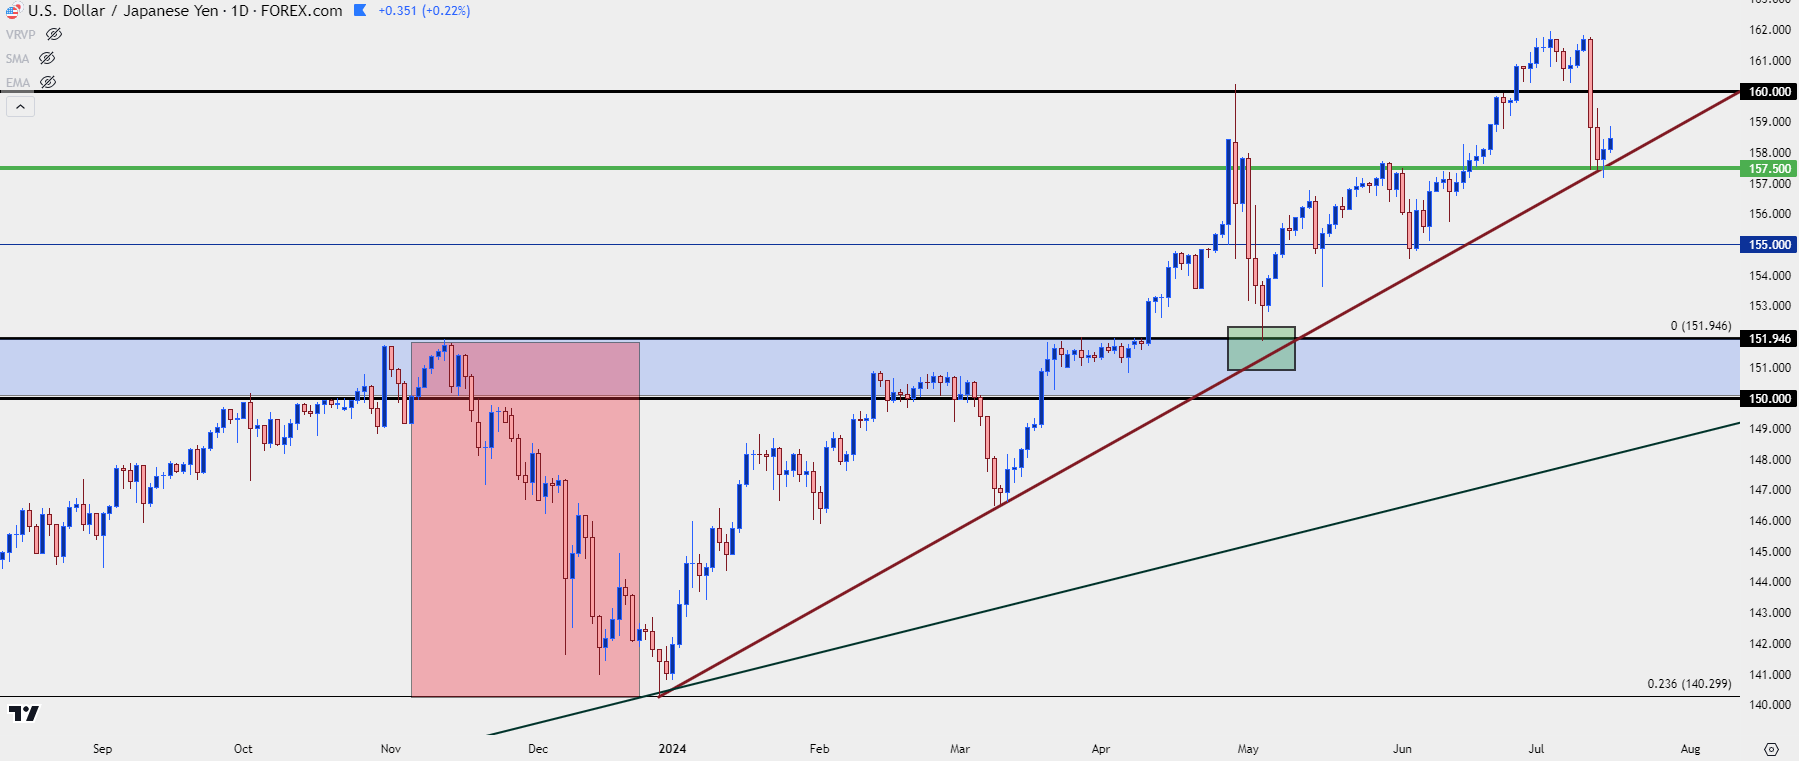 Chart prepared by James Stanley, USD/JPY on Tradingview
Gold (XAU/USD)
The big story on the day is gold, which is breaking out to a fresh all-time-high.
Gold bears had multiple opportunities to push for a deeper pullback in Q2. There were extended upper wicks on the monthly bars for April and May, and those types of intra-bar reversal can often lead to follow-through. But, that’s not what happened in June: Instead, price clung to a trendline that had held support for most of Q2 and that held into the final week of the quarter.
And then as USD began to fold over from the 106.00 level in DXY, helped along by both a dovish Powell and softening inflation, gold shot-higher, and has continued that path for the past three weeks.
At this point, gold is flexing its muscle as it makes a fast run at the $2,500 psychological level.
Gold (XAU/USD) Daily Price Chart
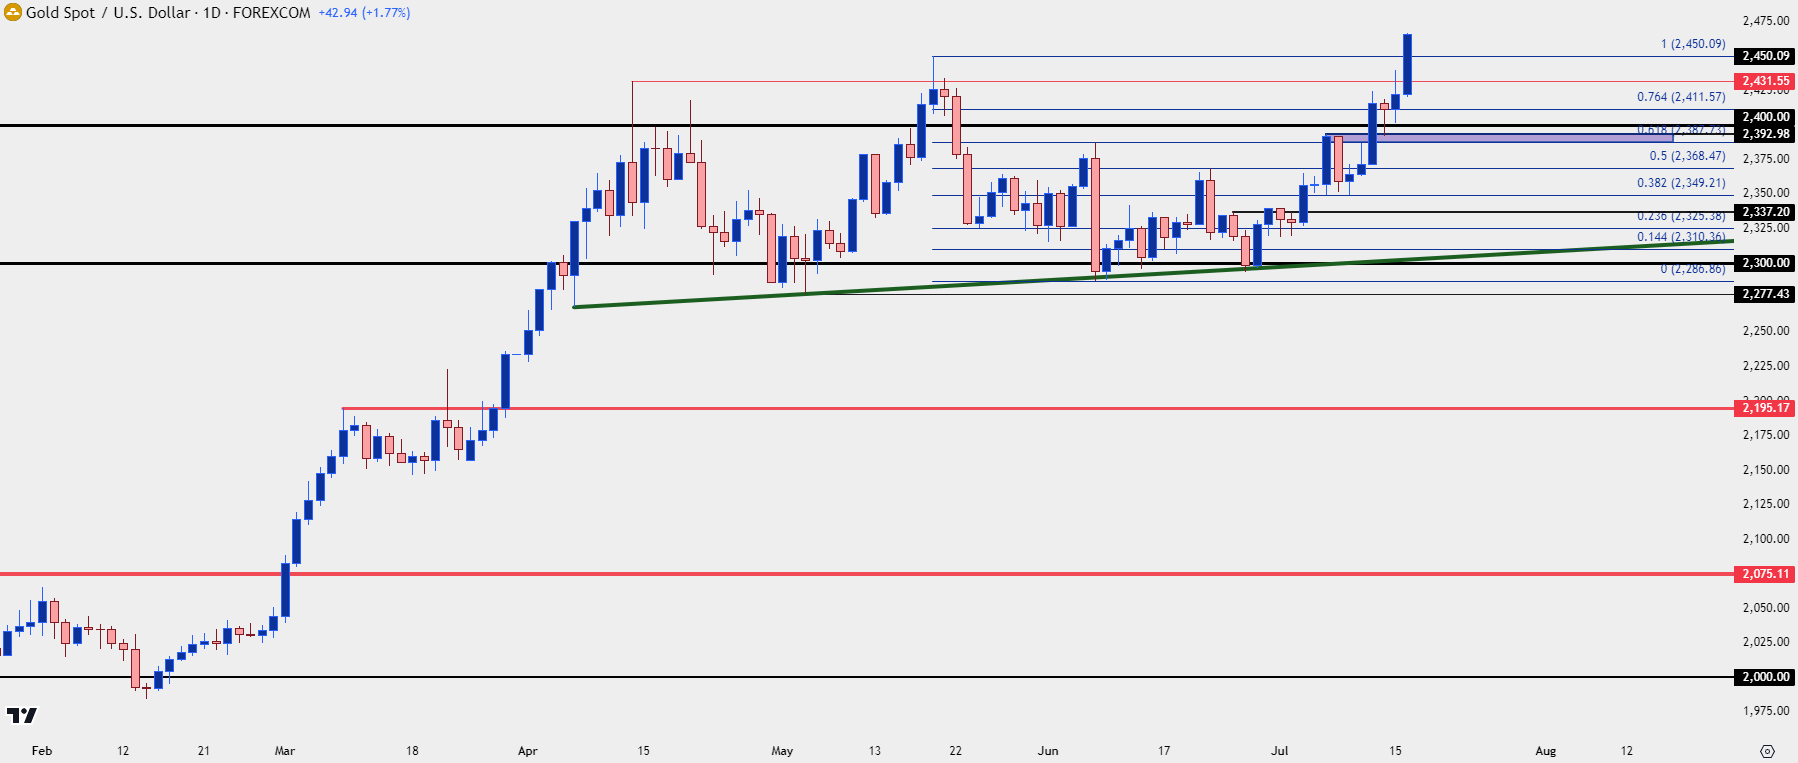 Chart prepared by James Stanley; data derived from Tradingview
Gold $2,500
Major psychological levels can be important inflection points. Take for instance the $2k level in gold, which first came into play in the summer of 2020. It didn’t stop bulls initially as buyers were able to push all the way up to $2,075 – but the move also couldn’t hold for long as a reversal developed shortly after, and then seven months later gold was back-below $1700. Gold took another few shots at the $2k level and, eventually, was able to mount above it last December with the breakout to fresh ATHs hitting in March.
The big question now is whether bulls can retain the pace through the next big figure of $2,500. There was already a few months of stall at $2400 but bulls were there to defend the other side, with that bullish trendline building around the $2300 level.
From the four-hour, bringing in RSI, we can already see where the move is stretched with RSI pushing over the 80-level. The last time RSI on the four-hour chart of gold was in this territory was back in May, when the prior ATH was setting at $2450.
So, if gold bulls can stretch up to the $2500 level, there could be scope for pullback – and it’s from that pullback that we can get a read for how aggressive bulls remain to be. Logically, the $2450 level and $2431 level become higher-low support potential; but the main key for continuation will be lacking acceptance of prices below $2400, similar to what showed in Q2 with bullish defense of $2300.
Gold Four-Hour Price Chart
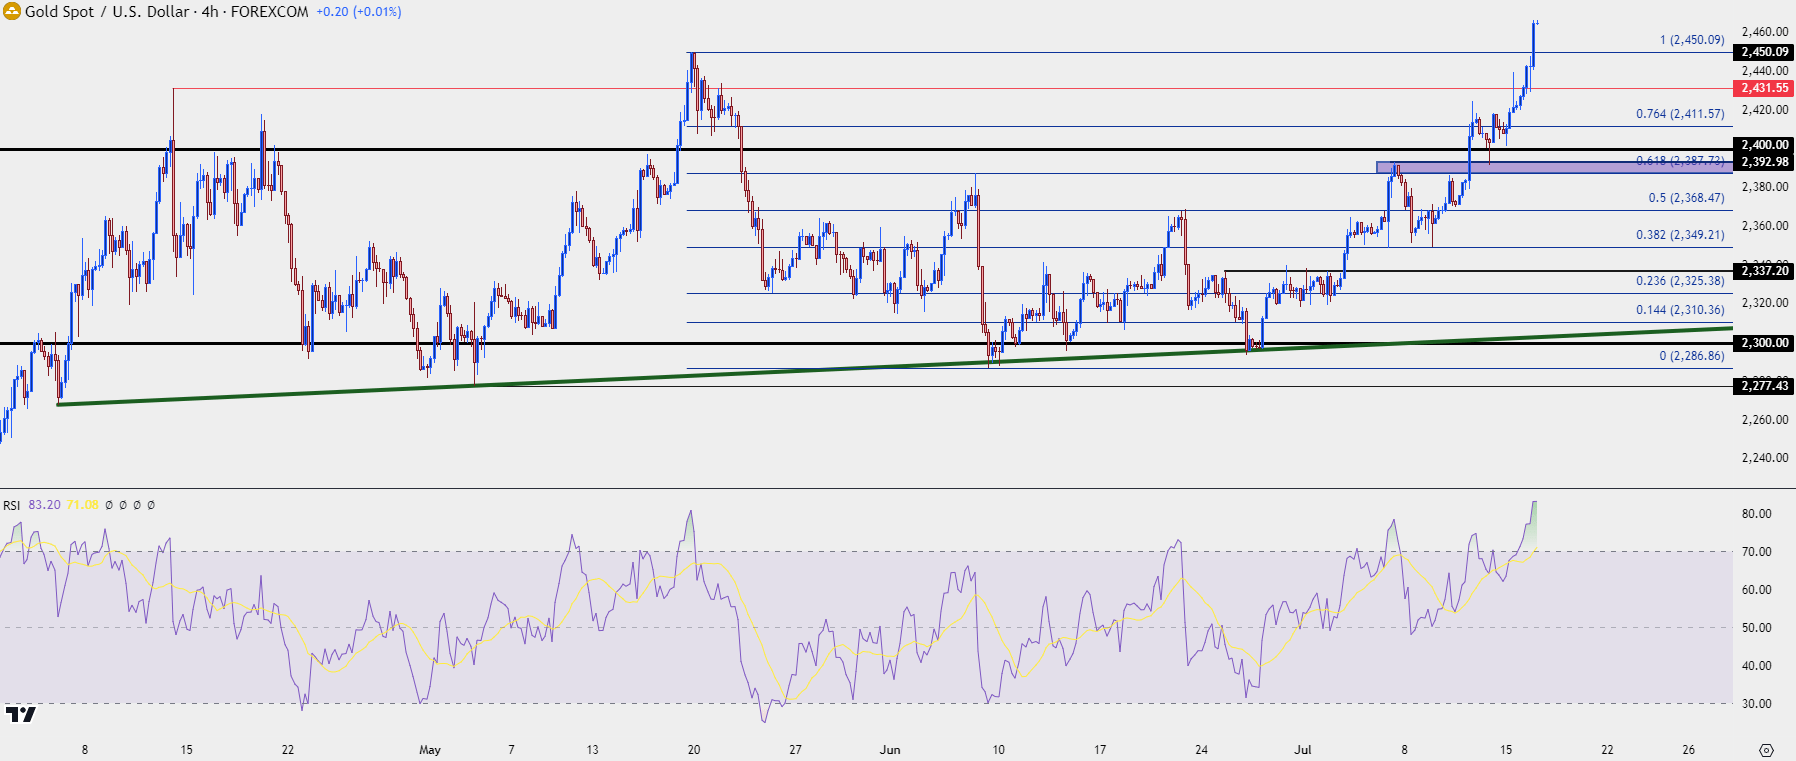 Chart prepared by James Stanley; data derived from Tradingview
--- written by James Stanley, Senior Strategist


