
U.S. Dollar Talking Points:
- The U.S. Dollar has continued to pull back from the 104.78-105.00 resistance test and that pullback theme is now going on two weeks.
- The comment from Austan Goolsbee the day after the CPI report echoes what I’ve been referring to regarding Fed-speak, in which the Central Bank hasn’t really seem too bothered by strong U.S. economic data.
- The next major data item for the USD is the Thursday release of Core PCE. If this comes in below-expectation, it would open the door for bears to make a larger push of USD-weakness as data would start to mirror the recent push from the Fed. At this point, structure on the daily chart of DXY remains bullish as price has held support (on a daily close basis) at the 200-day moving average, which was prior resistance. Shorter-term trends retain bearish trend tendencies, and the big question now is whether bulls defend that support at prior resistance.
- This is an archived webinar and if you'd like to join future webinars as they take place, the following link will allow for sign-up: Click here to register.
U.S. Dollar Tests Support at Prior Resistance
This webinar was largely centered on the U.S. Dollar and the currency has now seen a pullback for the past two weeks, since the release of CPI data that Core CPI staying very close to the 4% marker. It was the day after that displayed the drivers, however, as a comment from Chicago Fed President, Austan Goolsbee, urged market participants not to get ‘flipped out’ about the inflation report. That helped to start a USD pullback that remains in-effect today.
But – as I had looked at a couple of weeks ago as USD was breaking out – structure here is bullish and that 200-day moving average retains support potential as that was resistance for almost three full weeks before bulls pushed the breakout after the release of Non-farm Payrolls on February 2nd.
Bears tested below the 200-dma last week, finding a local low at the 50% mark of last year’s bullish trend that shows at 103.46. Bulls returned to push the daily close above that level and for the past few days, that support has remained.
This puts a lot of emphasis on the Core PCE report on Thursday. That’s the Fed’s preferred inflation gauge and unlike Core CPI, this has been sliding aggressively of late. It’s expected to print at 2.9% on Thursday, which would match last month’s number, but if this does come out below expectation it shows continued progress on inflation via the Fed’s preferred inflation meter, and this could give bears motivation to push a deeper bearish trend.
U.S. Core PCE YoY
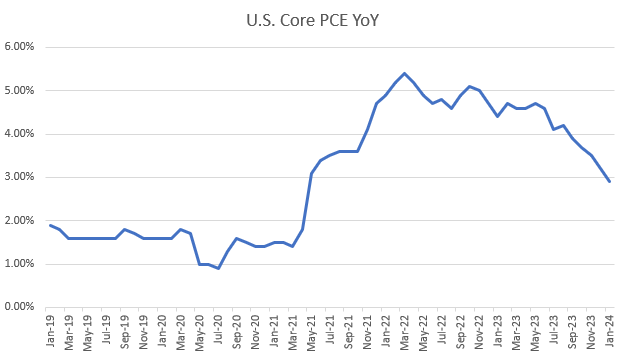
Chart prepared by James Stanley
U.S. Dollar Price Action
The intermediate-term trend retains a bullish lean as taken from a continued hold of support at prior resistance. This aligns right around the 200-day moving average, which was resistance for almost three full weeks until bulls finally made a push up towards the 105 zone. That test around 105 is around the time that comment from Austan Goolsbee came into play and since then, bears have driven a short-term bearish trend that’s allowed for pullback in the longer-term setup.
There are some notable levels on either side of this move: The low from last week appeared at the 50% mark of the bullish move from last summer. Just below that, the support that had held in January, when the 200-day was holding resistance, shows around 103 up to the Fibonacci level at 103.19. And below that, we have resistance from earlier in January around the 102.50 level.
Above current price is a short-term resistance level at 103.98, which had held as support leading into the CPI report a couple of weeks ago and, more recently, it’s come back in as short-term resistance. Above that there’s a swing level at 104.21, but it’s the Fibonacci level at 104.38 that sticks out, after which the same zone that led into the pullback comes into view at 104.78-105.00.
U.S. Dollar Daily Price Chart
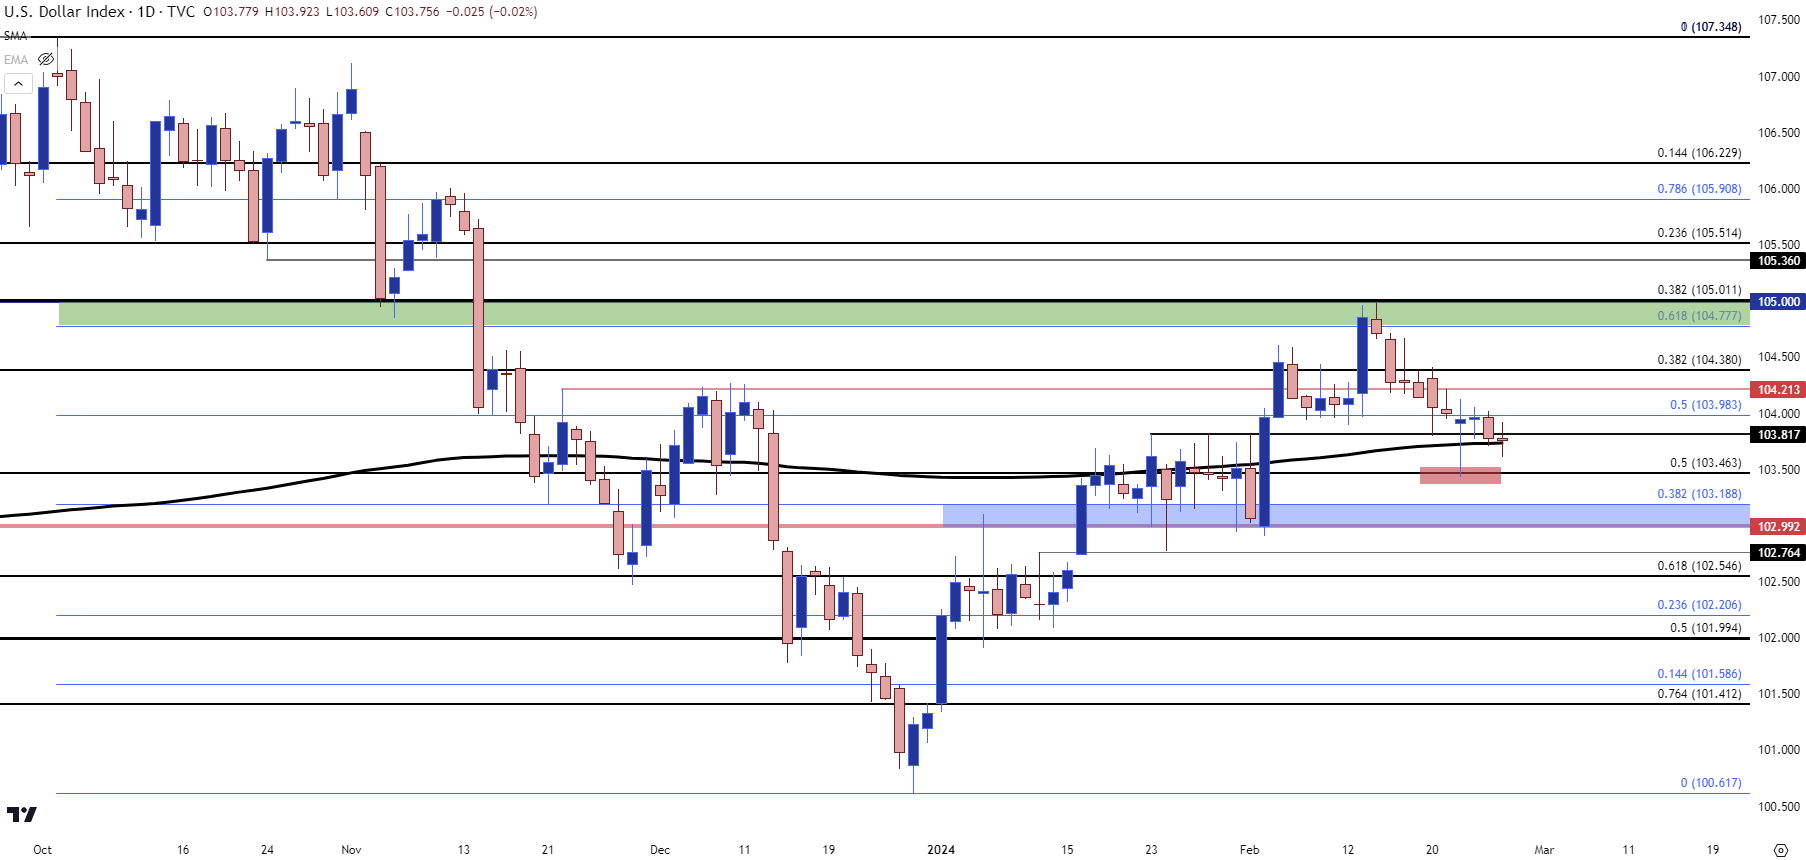 Chart prepared by James Stanley; data derived from Tradingview
EUR/USD
Last week when I looked at EUR/USD, the pair was still holding resistance at the 200-day moving average, but there was also a shorter-term build of bullish structure. Price had just found support at prior resistance and bulls were pushing for another re-test of the 200-dma. I had also highlighted resistance around the 1.0900 level, with that zone beginning at 1.0886 and that’s the level that caught the high the morning after.
Price pulled back and the daily bar closed inside of the 200-dma, but yesterday was the first instance of bulls forcing a daily close above that level and that keeps the shorter-term backdrop with a bullish lean. Resistance remains overhead at the 1.0886-1.0900 zone and the 1.0930 level looms just above that. On a longer-term basis, it’s the 1.1000 mark that’s had a tendency to elicit resistance as a range has built over the past year-plus, and that remains of importance in the event that bulls stretch the move into the end of this week.
EUR/USD Four Hour Price Chart
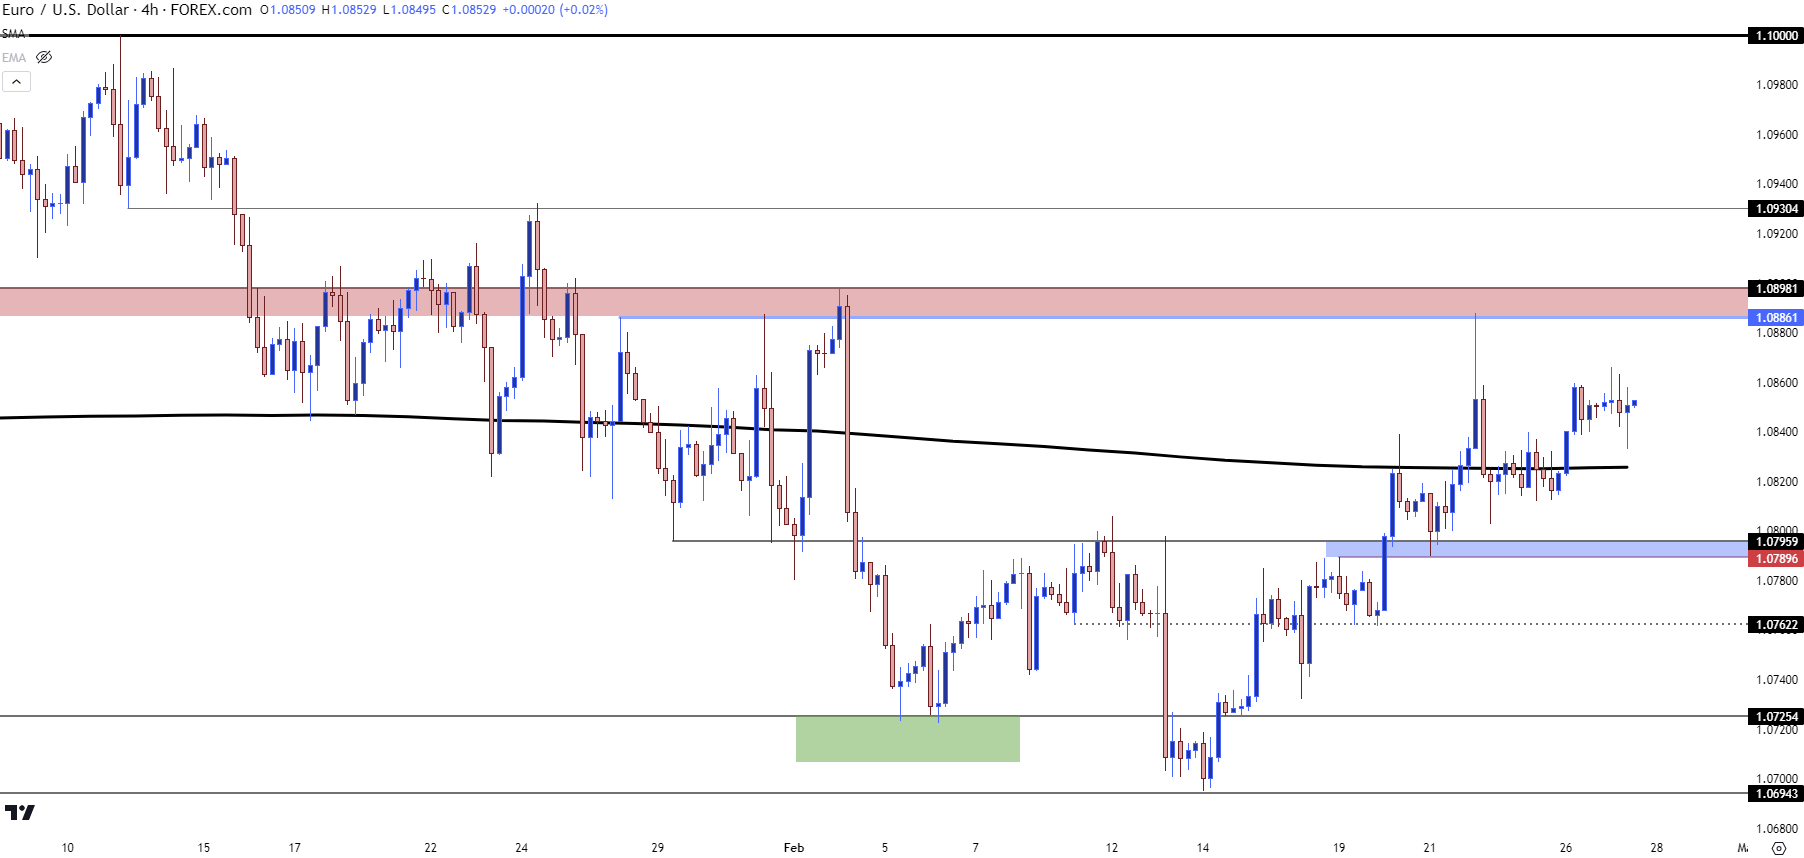 Chart prepared by James Stanley, EUR/USD on Tradingview
GBP/USD Pushing Towards Range Resistance
The 200-day moving average test in Cable showed a few items of interest earlier this month. When I was looking around the USD in the webinar a couple of weeks ago, as I had shared then, this remained presented an interesting dichotomy from EUR/USD or other major pairs, as GBP/USD had retained strength through the early-portion of this year, even as USD was trending higher. At the time, the prospect of a higher-low remained, with an assist at the 200-dma. That led into a hold of higher-low support and bulls pushed price back into the prior range in the pair.
At this point, there’s some imposing resistance sitting overhead at the same 1.2720-1.2758 zone that’s been resistance for three months. For that resistance to give way, the USD would likely need to breach below the 103 level in DXY and this can remain as one of the more enticing bearish-USD setups.
GBP/USD Daily Price Chart
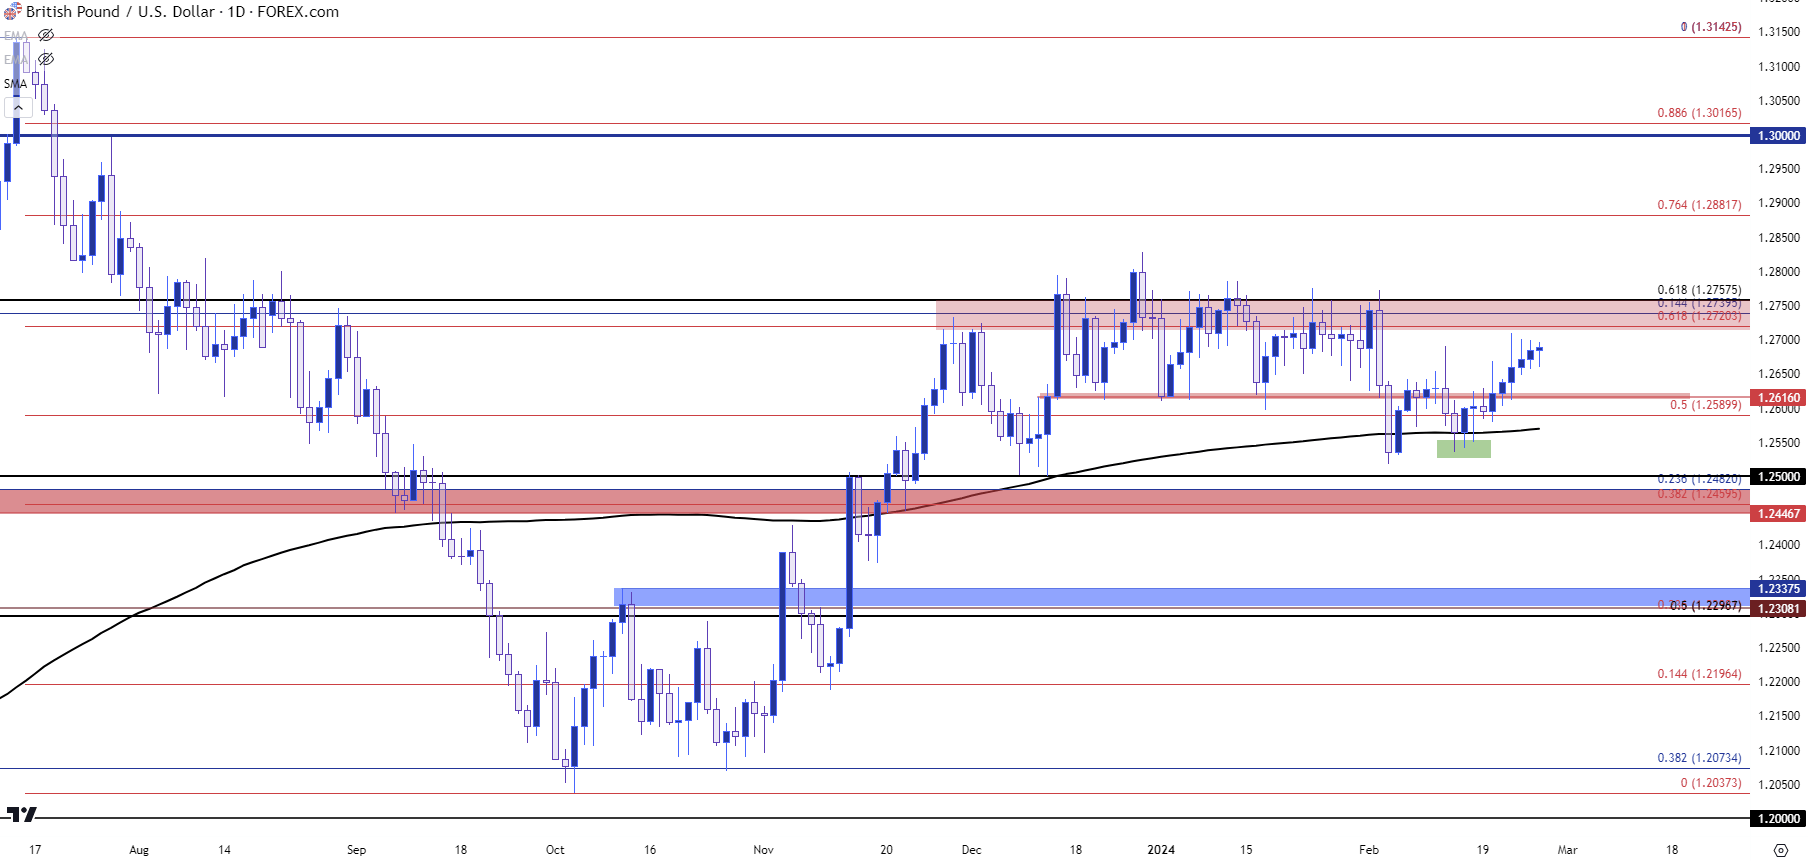 Chart prepared by James Stanley, GBP/USD on Tradingview
USD/JPY
Also of interest for bearish USD scenarios is USD/JPY. The pair remains in the 150-152 resistance zone and with inflation softening in Japan, along with the fact that the Japanese economy has recently went back into recession, there may be even more motivation for the Bank of Japan to do nothing with policy here.
But – there’s two sides to that pair and the USD has been a forceful agent of change over the past two years with this same resistance zone playing a role. In both of those cases, it was a broader move of USD-weakness that shook out carry traders.
If Core PCE prints to well-below expectations on Thursday, this can drive bears to get more aggressive in the pair but similar to the above in GBP/USD, we would likely need to see a continued effort from USD bears to make that theme come to life. As looked at in the webinar, for those seeking out Yen-weakness, there may be more amenable backdrops to search for such in GBP/JPY or EUR/JPY.
USD/JPY Daily Price Chart
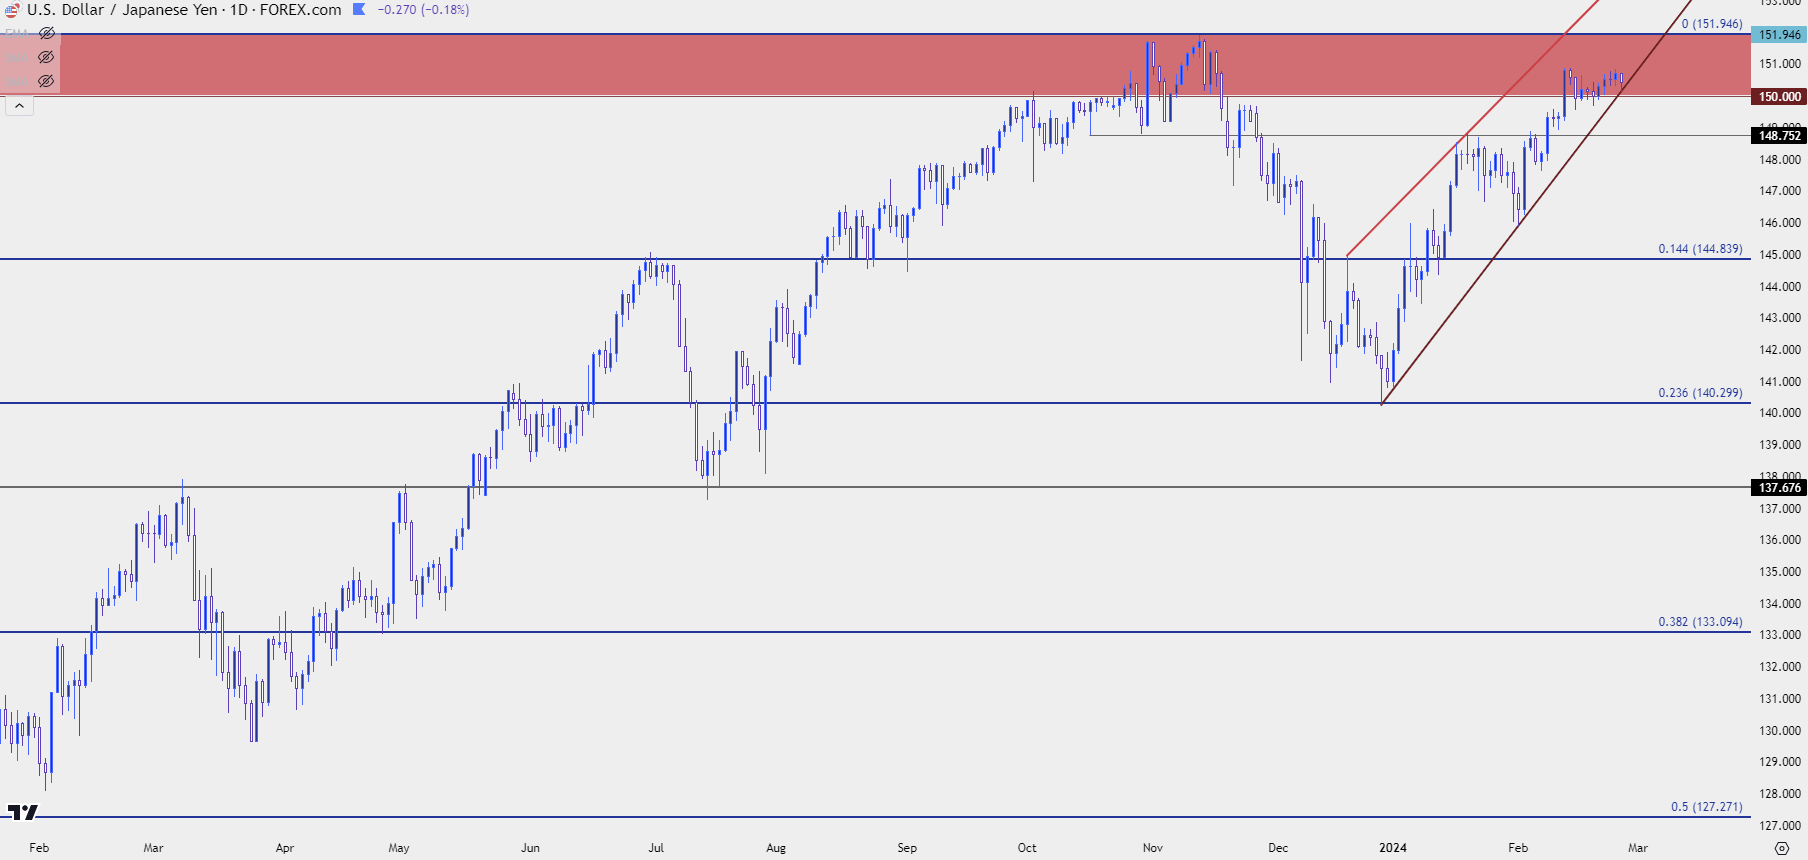
Chart prepared by James Stanley, USD/JPY on Tradingview
Bitcoin (BTC/USD)
Bitcoin is in the midst of another parabolic breakout move. I had looked into this in the webinar two weeks ago, just as resistance was starting to set at the 52,099 level. That resistance ended up holding for eight days until the more recent breakout and bulls put up a good showing there as they did not even allow for a pullback to test below the 50k level, or even the 50,333 level that I had looked at in that webinar as taken from prior resistance.
The next major resistance on my chart runs from 59,618 up to 60k and the move is quite extended at this point. There’s aggressive higher-low support potential at the Fibonacci level of 56,369, and below that around 55k followed by the 53,501-53,625 zone.
In the webinar I looked at both Gold and Bitcoin, highlighting that shift in late-2020 trade. That was notable as the Fed was aggressively dovish at the time with both QE and low rates but, notably, Gold pulled back and traded within a range as Bitcoin started to the ‘anti-dollar’ flows.
With gold ranging and sticking close to $2k at this point, we may have a similar scenario as we move towards the next Bitcoin halving event in mid-April.
Bitcoin (BTC/USD) Four-Hour Price Chart
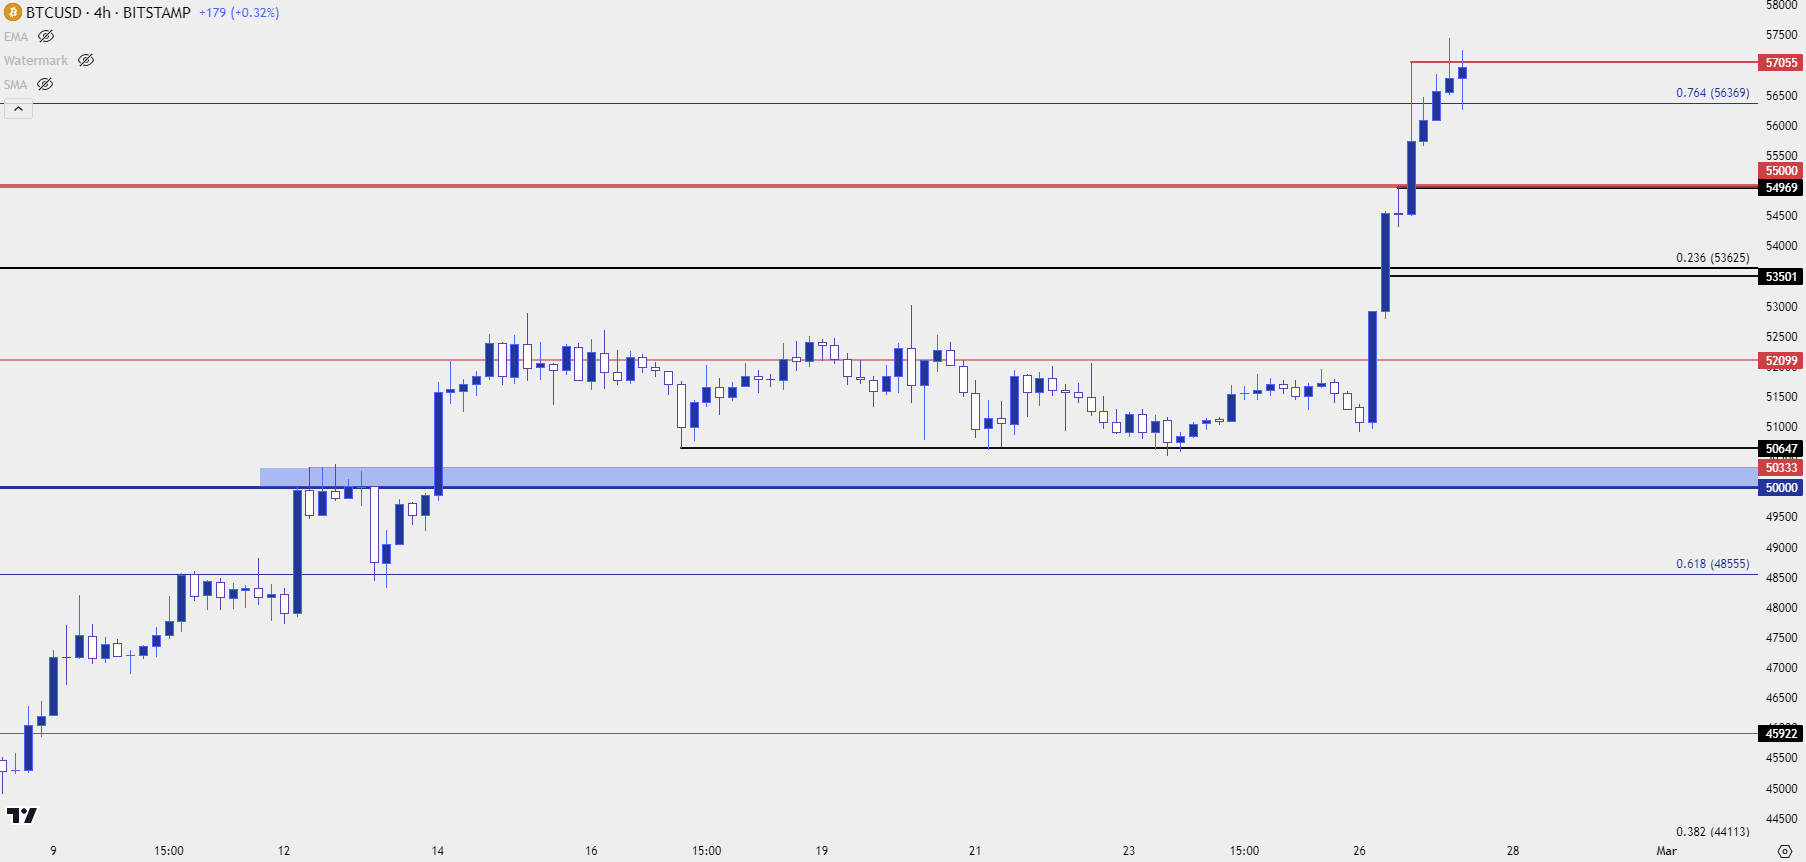 Chart prepared by James Stanley; data derived from Tradingview
Gold (XAU/USD)
Gold remains very near longer-term range resistance. The CPI report two weeks ago allowed for the first bearish break of $2k in 2024 but that was quickly retraced after the Austan Goolsbee comment a day later. As a matter of fact, this year’s low syncs in well with when that comment hit the wires, as I had looked at in the forecast a couple of weeks ago.
I remain of the mid that gold’s ability to build bullish trends above 2k will show after the Fed has formally flipped, and with economic data remaining fairly strong of late, that theme has taken a step back. If the Core PCE release on Thursday prints below expectations and we get a continued run of USD-weakness, that could put gold bulls back in the driver’s seat to allow for a re-test of $2,050, $2,075 or perhaps even $2,082.
At this point, gold is testing a higher-low around the 2030.69 level that was resistance last week, and this keeps the door open for bulls to push for a test of the 2042-2043 resistance zone. For support, the 2018-2020 area remains of interest and if bears push through that it would exhibit a greater element of control that could potentially turn the trend; but in reality, bears are probably going to want to see a breach of the 2k level to drive hopes for a larger reversal type of move.
Gold (XAU/USD) Four-Hour Price Chart
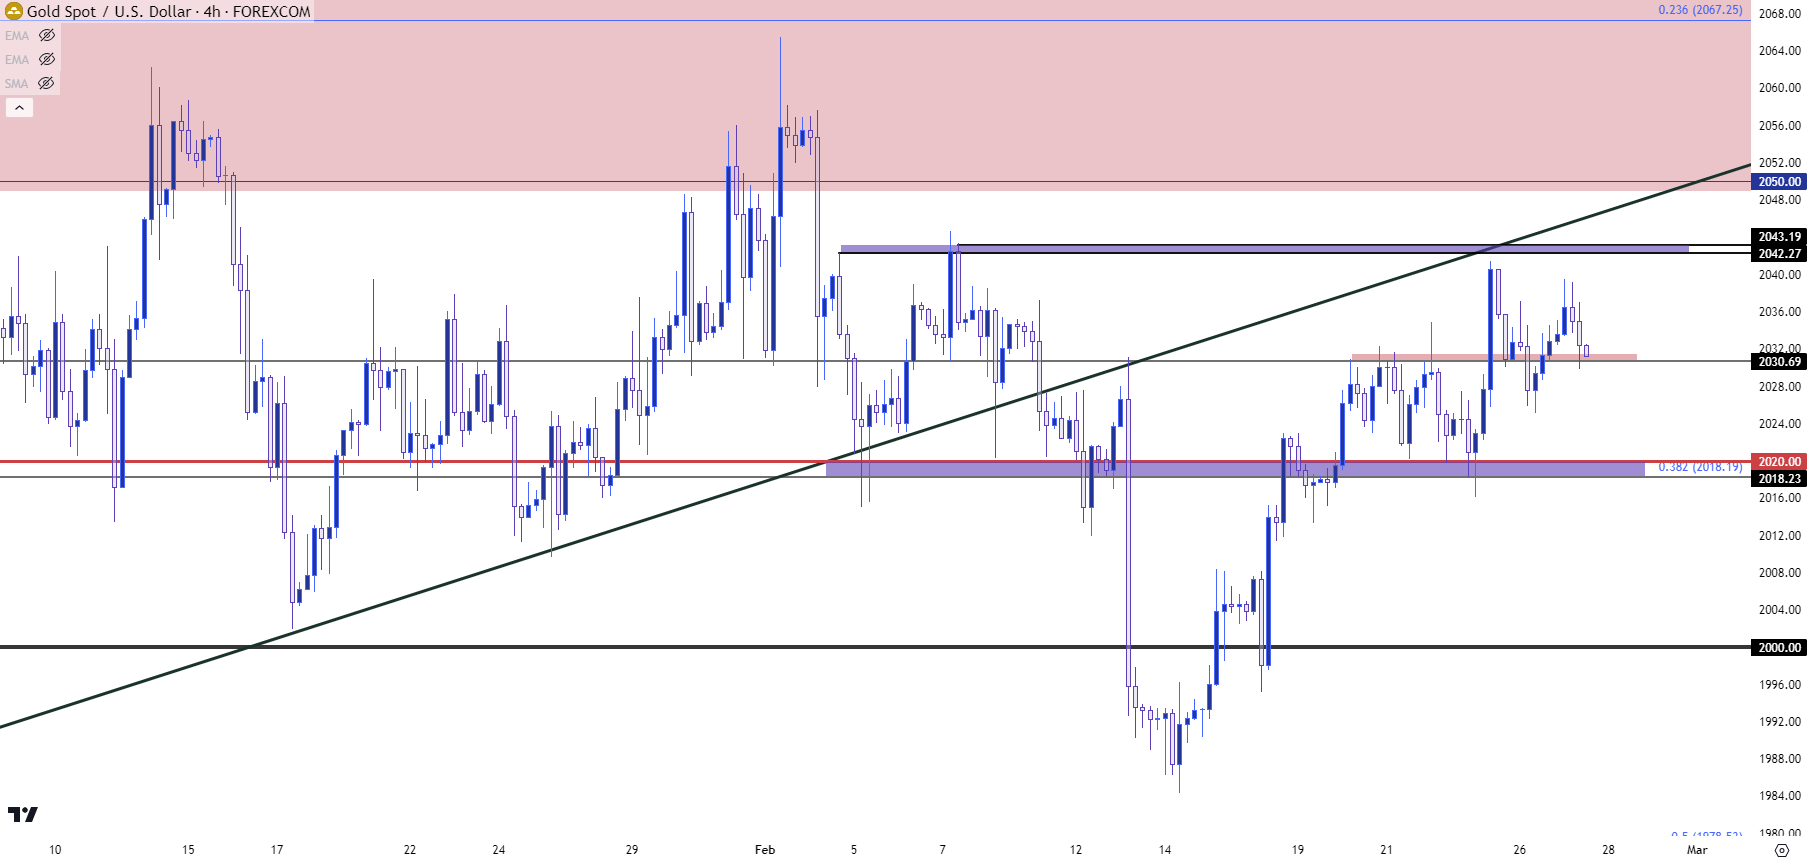 Chart prepared by James Stanley, Gold on Tradingview
--- written by James Stanley, Senior Strategist


