Weekly Technical Trade Levels on USD Majors, Commodities & Stocks
- Technical setups we are tracking into the weekly open – US PCE on tap
- Next Weekly Strategy Webinar: Monday, April 29 at 8:30am EST
- Review the latest Weekly Strategy Webinars or Stream Live on my YouTube playlist.
In this webinar we take an in-depth look at the technical trade levels for the US Dollar (DXY), Euro (EUR/USD), British Pound (GBP/USD), Australian Dollar (AUD/USD), Canadian Dollar (USD/CAD), US Treasury Yields, Japanese Yen (USD/JPY), Swiss Franc (USD/CHF), Gold (XAU/USD), Silver (XAG/USD), Crude Oil (WTI), S&P 500 (SPX500), Nasdaq (NDX), and Dow Jones (DJI). These are the levels that matter on the technical charts heading into the weekly open.
Euro Price Chart – EUR/USD Daily

Chart Prepared by Michael Boutros, Sr. Technical Strategist; EUR/USD on TradingView
A newly-identified slope in EUR/USD has price rebounding off the 25% parallel with key lateral support seen just lower at the 2023 low-week close (LWC) / 78.6% retracement of the October advance at 1.0587/96. Look for initial support at the low-day close (LDC) near 1.0619 with a close above the median-line needed to suggest a larger bear-market recovery is underway. Initial resistance stands with the 2023 yearly open / 61.8% retracement at 1.0704/12 with bearish invalidation now set 1.0792-1.0817- a region defined by the objective monthly open, the 38.2% retracement of the December decline and the 200-day moving average.
A break below this key pivot zone would threaten another bout of accelerated losses towards subsequent support objectives at the 100% extension at 1.0537 and the 2023 LDC near 1.0466. For now, the focus is on a breakout of this multi-day consolidation pattern just above support.
S&P 500 Price Chart – SPX500 Weekly

Chart Prepared by Michael Boutros, Sr. Technical Strategist; S&P 500 on TradingView
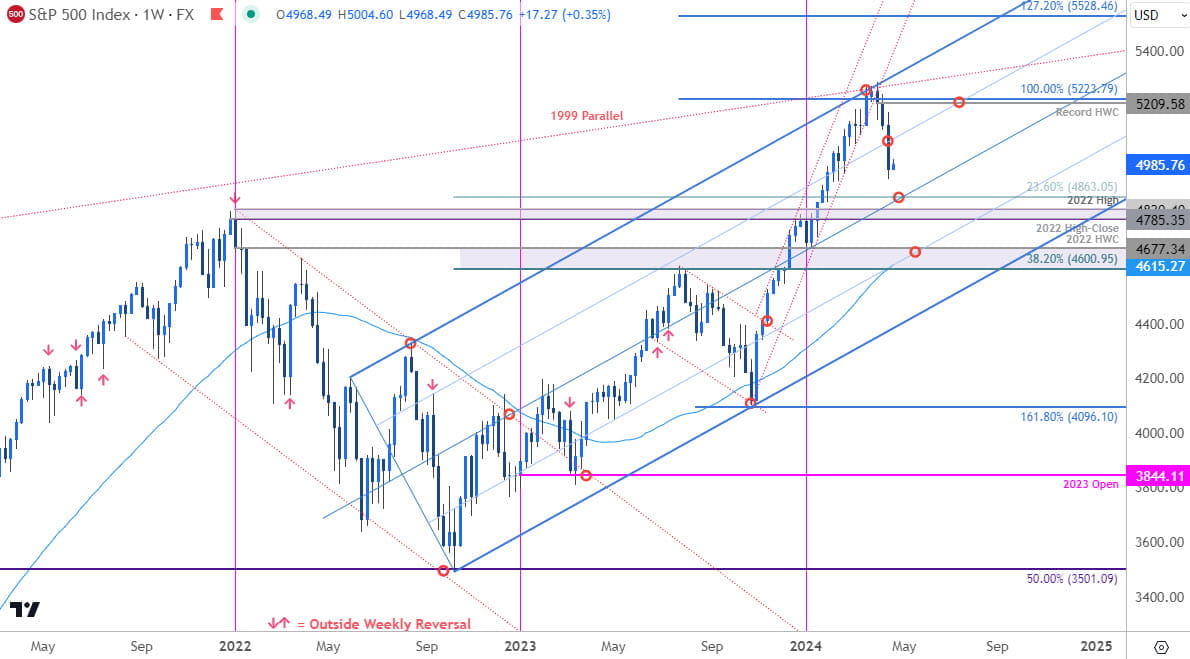
In last month’s S&P 500 Technical Forecast we noted that rally was approaching a major resistance confluence, “Major technical resistance is eyed just higher around the 100% extension of the 2022 advance near 5223/50 – note that longer-term uptrend resistance slopes also converge on this region and highlight its technical significance over the next few weeks.” The index briefly registered an intraweek high at 5286 (high-close at 5258) in the following weeks before turning over sharply with a three-week decline plunging 6.75% off the record highs.
The break below slope support suggests the threat remains for a deeper setback here with initial weekly support seen at the 23.6% retracement of the 2022 advance at 4863 and the 2022 high-close / swing high at 4785-4820- both levels of interest for possible downside exhaustion / price inflection IF reached. Broader bullish invalidation now raised to the 38.2% retracement / 52-week moving average / 2022 high-week close (HWC) at 4600/77.
Look for initial resistance along the 75% parallel (currently near ~5090s) with key resistance steady at the record HWC / 100% extension at 5209/23- a breach / weekly-close above this threshold is needed to mark uptrend resumption.
Bottom line: The S&P 500 has turned from uptrend resistance and we’re looking for a possible test of uptrend support. Note that the immediate three-week decline may be a tad stretched here– that said, from a technical standpoint the risk remains lower while sub-5100.
Gold Price Chart – XAU/USD Weekly

Chart Prepared by Michael Boutros, Sr. Technical Strategist; XAU/USD on TradingView
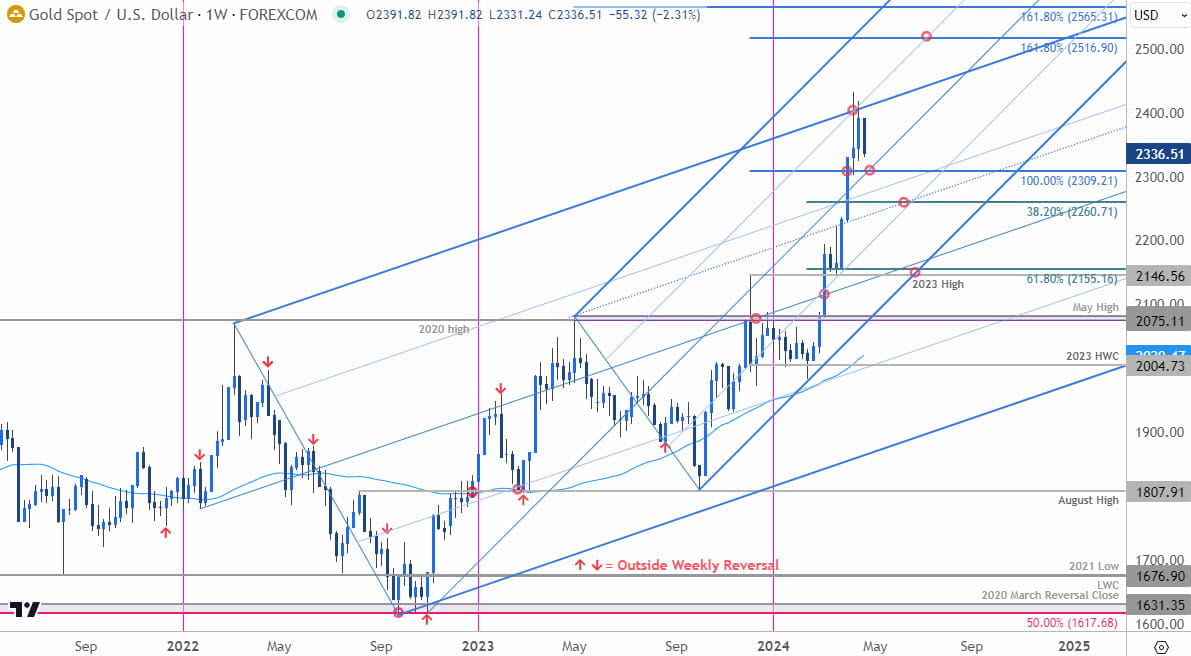
The gold price breakout has exhausted into confluent uptrend resistance for the past two-weeks – the threat remains for a deeper setback within the broader uptrend. This chart may seem a tad complex, but for now the focus is on initial support near 2309- a close below this threshold would suggest a larger correction is underway with subsequent support eyed at 2260. Broader bullish invalidation now raised to the 2023 swing high / 61.8% Fibonacci retracement of the yearly range at 2146/55.
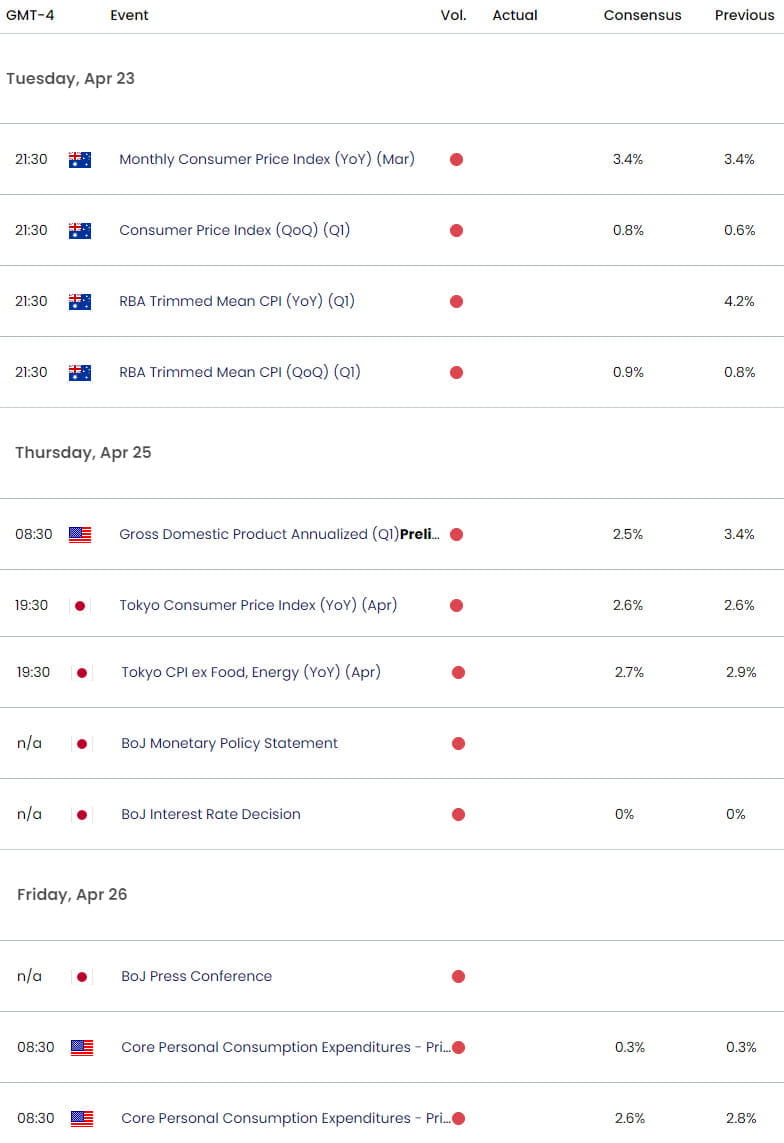
The trade remains constructive while within the late-2022 uptrend with a breach / weekly close above the upper parallel / record high at 2431 ultimately needed to mark trend resumption towards subsequent resistance objectives at 2516 and 2565. Use caution heading into key inflation data on Friday (US Core-PCE) / the monthly crossover and watch the weekly closes for guidance.
Economic Calendar – Key USD Data Releases

Economic Calendar - latest economic developments and upcoming event risk.
--- Written by Michael Boutros, Sr Technical Strategist with FOREX.com
Follow Michael on X @MBForex


