Weekly Technical Trade Levels on USD Majors, Commodities & Stocks
- Technical setups we’re tracking into the weekly open
- Next Weekly Strategy Webinar: Monday, January 8 at 8:30am EST
- Review the latest Weekly Strategy Webinars on my YouTube playlist.
In this webinar we take an in-depth look at the technical trade levels for the US Dollar (DXY), Euro (EUR/USD), British Pound (GBP/USD), Canadian Dollar (USD/CAD), Japanese Yen (USD/JPY), Australian Dollar (AUD/USD), Swiss Franc (USD/CHF), Gold (XAU/USD), Crude Oil (WTI), Silver (XAG/USD), S&P 500 (SPX500), Nasdaq (NDX), and the Dow Jones (DJI). These are the levels that matter on the technical charts heading into the weekly open and the close of the year.
US Dollar Index Price Chart – USD Weekly (DXY)

Chart Prepared by Michael Boutros, Sr. Technical Strategist; DXY on TradingView
The US Dollar continues to hold a major support confluence here at 102.54/99- the focus remains on possible inflection off this zone with a weekly close below needed to fuel the next major leg lower towards 101.08/24. Resistance steady at the yearly open / 52-week moving average at 103.50 and the focus is on a breakout of this range for guidance in the weeks ahead.
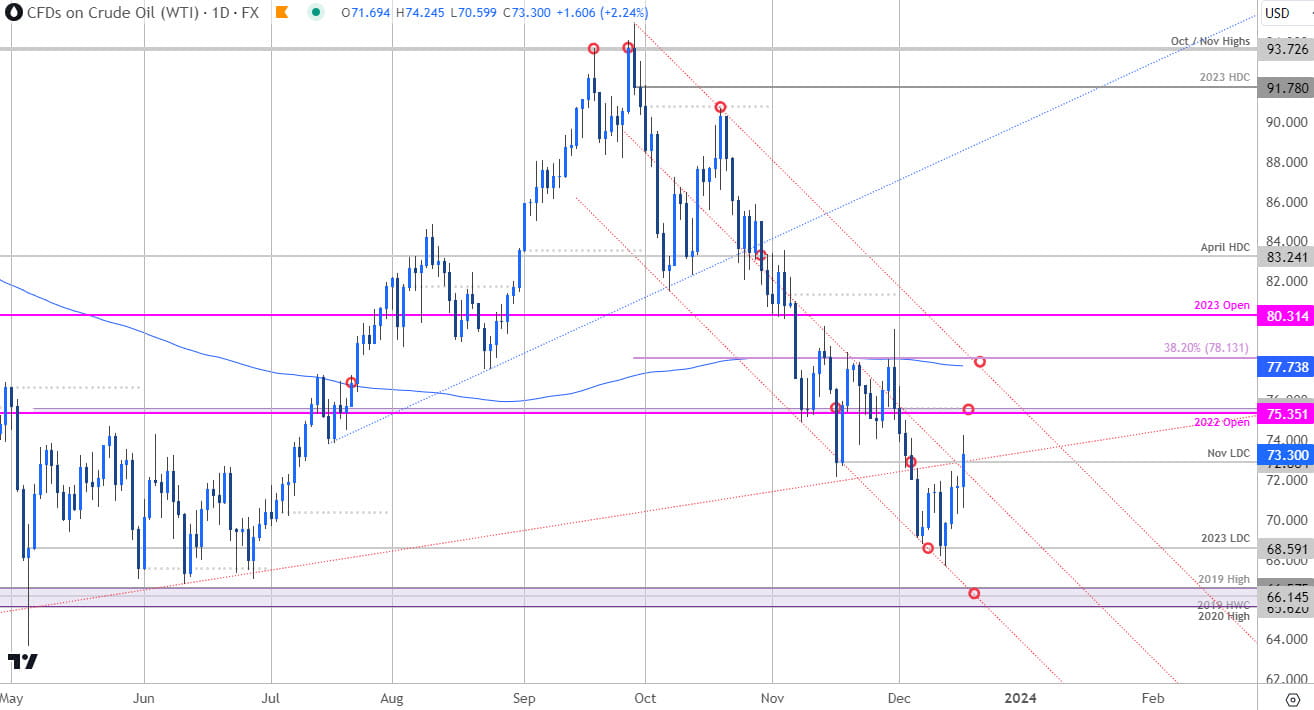
Oil Price Chart – Crude Daily (WTI)

Chart Prepared by Michael Boutros, Technical Strategist; WTI on TradingView
Keeping a close eye on oil prices this week as WTI attempts to rebound off confluent downtrend support on building momentum divergence. Initial resistance eyed at the 2022 yearly open / December-open at 75.35/60 with bearish invalidation now lowered to the 200-day moving average / 38.2% Fibonacci retracement of the September decline at 77.73-78.13.
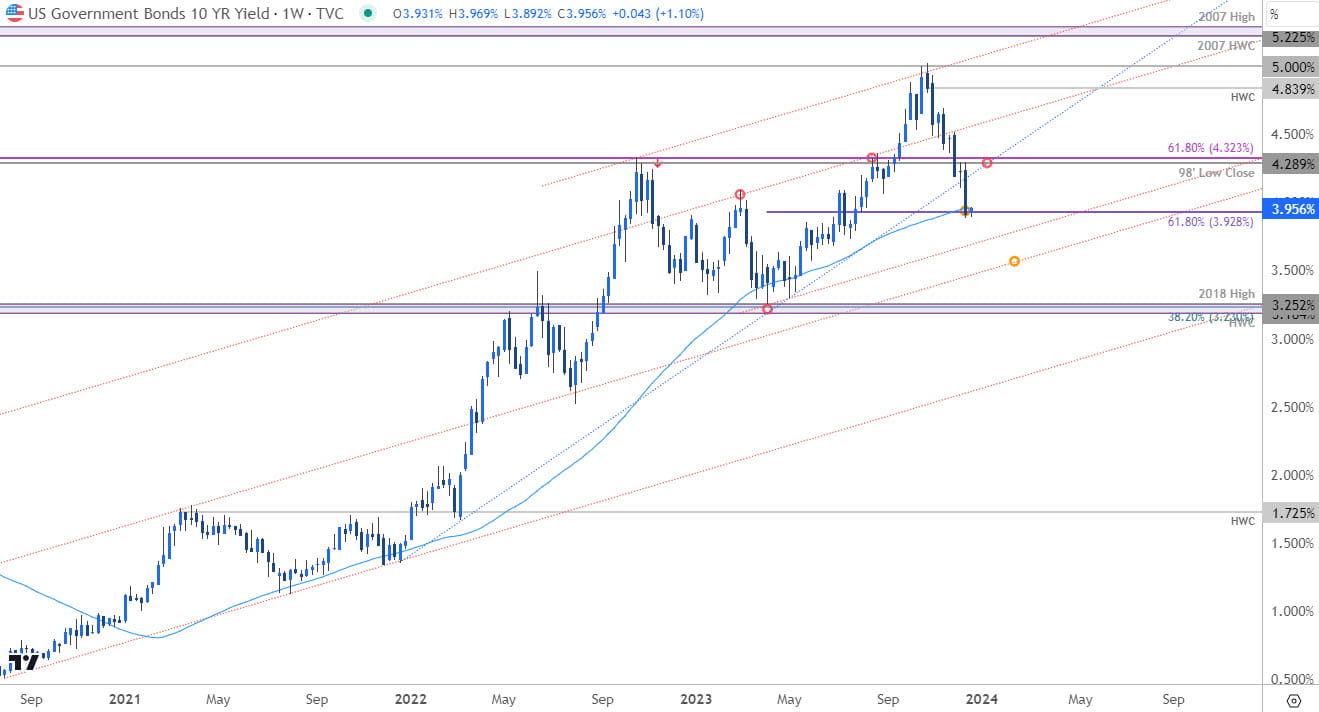
US 10-Year Treasury Yield - US10Y Weekly

Chart Prepared by Michael Boutros, Technical Strategist; US10Y on TradingView
Yields on the 10-year are struggling here at the confluence of the 61.8% retracement of the yearly range and the 52-week moving average- looking for possible inflection here. Resistance / medium-term bearish invalidation now lowered to 4.29/32. A break / close below this zone keeps the focus on the lower parallels, currently near 3.70 and 3.50- look for a larger reaction there IF reached. Obviously, implications here for USD/JPY as well.
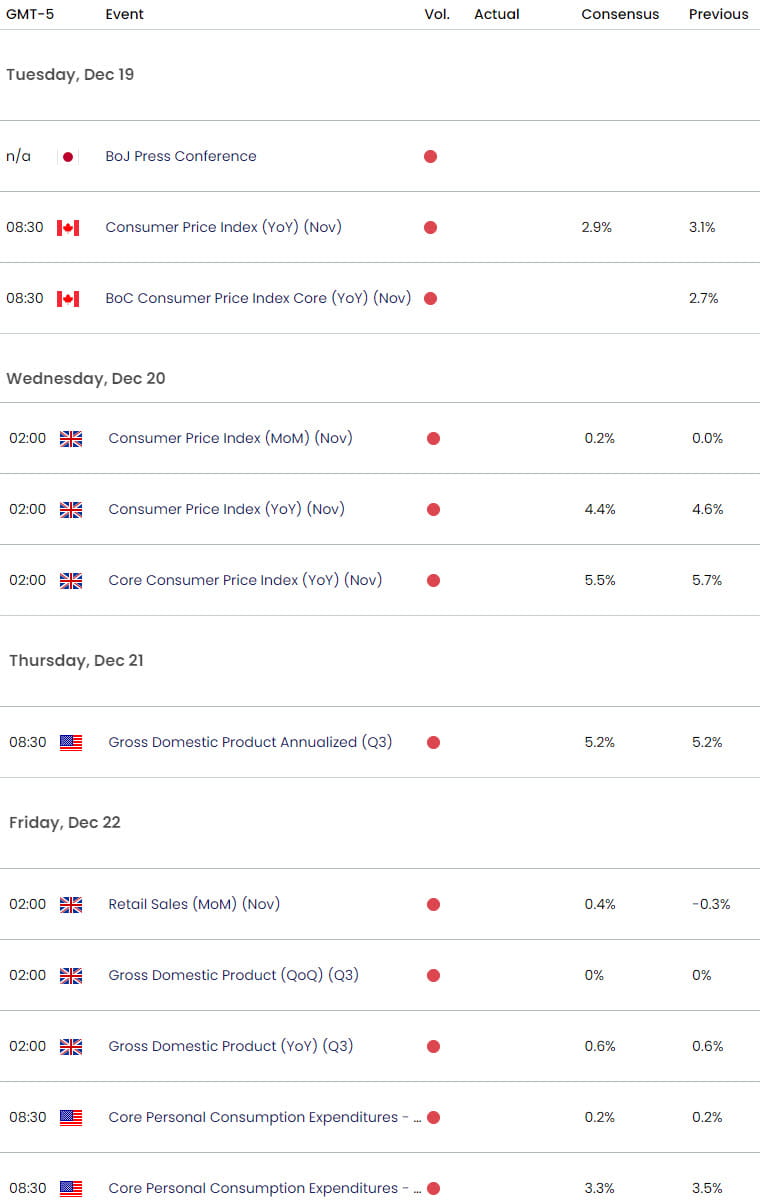
Economic Calendar – Key USD Data Releases

--- Written by Michael Boutros, Sr Technical Strategist with FOREX.com
Follow Michael on X @MBForex


