Weekly Technical Trade Levels on USD Majors, Commodities & Stocks
- Technical setups we are tracking into the weekly open
- Next Weekly Strategy Webinar: Monday, September 16 at 8:30am EST
- Review the latest Video Updates or Stream Live on my YouTube playlist.
In this webinar we take an in-depth look at the technical trade levels for the US Dollar (DXY), 10yr Treasury Yields, Euro (EUR/USD), British Pound (GBP/USD), Australian Dollar (AUD/USD), Canadian Dollar (USD/CAD), Japanese Yen (USD/JPY), EUR/JPY, Swiss Franc (USD/CHF), CAD/CHF, Gold (XAU/USD), Crude Oil (WTI), Silver, (XAG/USD), S&P 500 (SPX500), Nasdaq (NDX) and the Dow Jones (DJI). These are the levels that matter on the technical charts heading into the weekly open.
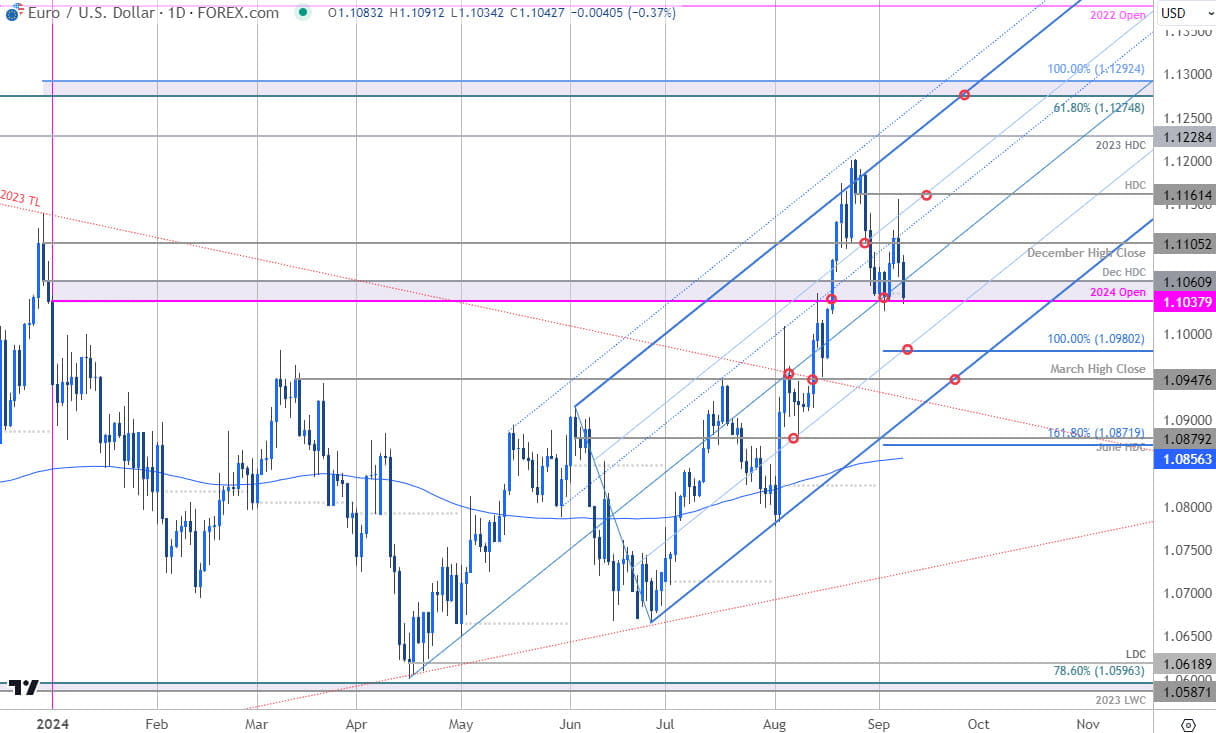
Euro Price Chart – EUR/USD Weekly

Chart Prepared by Michael Boutros, Sr. Technical Strategist; EUR/USD on TradingView
Euro is testing yearly-open support at 1.1038 into the start of the week with this key support zone also defining the September opening-rang low. A break / close below this threshold would suggest a larger bull-market correction is underway with subsequent support objectives eyed at the 100% extension at 1.0980 and the March high-close at 1.0947- both levels of interest for possible downside exhaustion IF reached. Losses would need to be limited to the lower parallel (blue) for the June uptrend to remain viable.
Initial resistance is eyed with the December high-close at 1.1105 with a breach / close above the yearly high-day close (HDC) at 1.1161 needed to mark uptrend resumption. Keep in mind the European Central Bank (ECB) interest rate decision is on tap Thursday- stay nimble into the releases and watch the weekly close here.
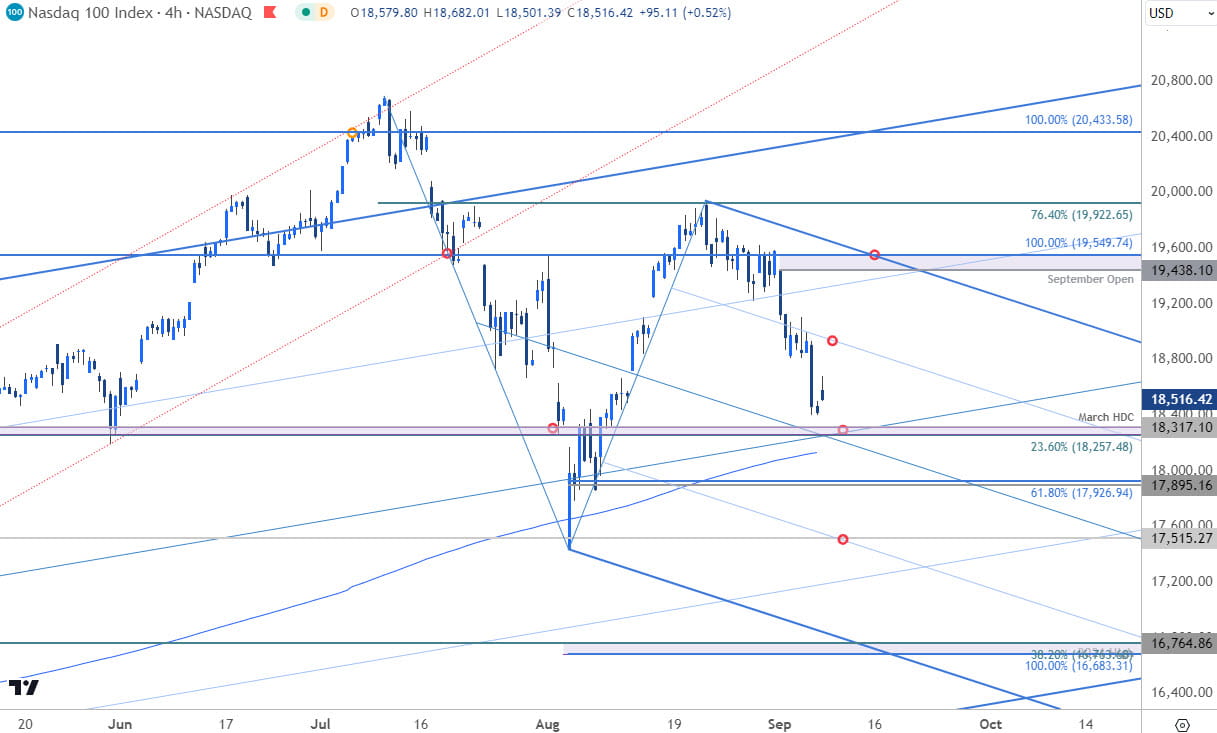
Nasdaq Price Chart – NDX 240min

Chart Prepared by Michael Boutros, Technical Strategist; Nasdaq on TradingView
Nasdaq is trading just above support into the open of the week at 18257/317- a region defined by the 23.6% retracement of the 2022 advance and the March High-day close (HDC). Note that the 200-DMA rests just lower and we’re looking for possible price inflection into this region IF reached.
Initial resistance stands with the 75% parallel (currently ~18950s) with bearish invalidation set to the objective monthly open / 100% extension of the 2020 rally at 19438/549. A break lower from here exposes subsequent support objectives at 17895/926 and the August low at 17435. Next major technical confluence is seen at 16683/764. Keep in mind the first and only presidential election is on tap tomorrow with key US inflation data on Wednesday.
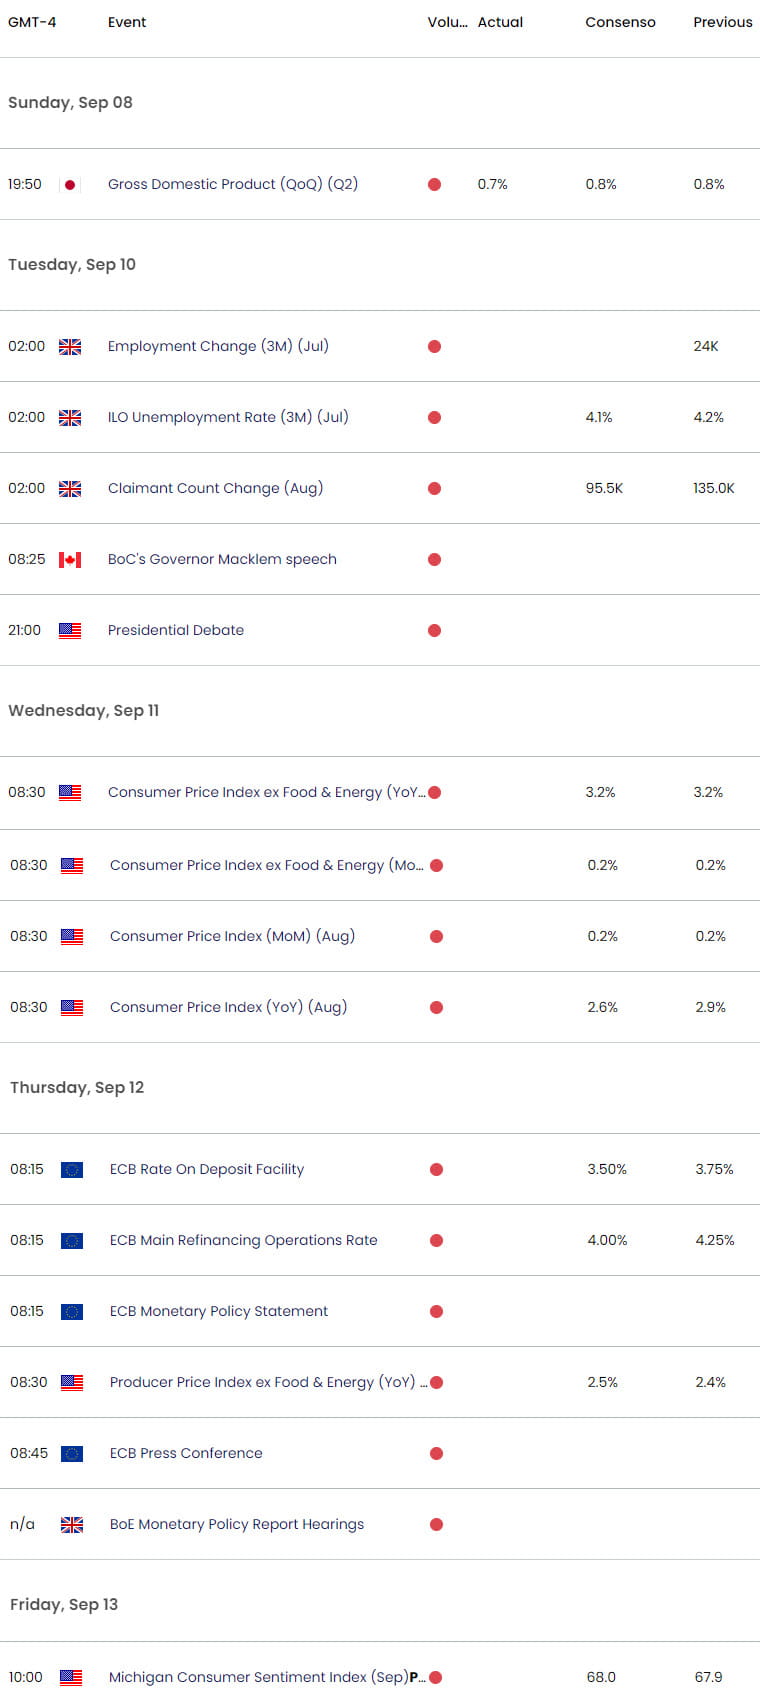
Economic Calendar – Key USD Data Releases

Economic Calendar - latest economic developments and upcoming event risk.
--- Written by Michael Boutros, Sr Technical Strategist with FOREX.com
Follow Michael on X @MBForex


