Weekly Technical Trade Levels on USD Majors, Commodities & Stocks
- Technical setups we’re tracking into the open of the week
- Next Weekly Strategy Webinar: Monday, July 17 at 8:30am EST
- Review the latest Weekly Strategy Webinars on my YouTube playlist.
In this webinar we take an in-depth look at the technical trade levels for US Dollar (DXY), Euro (EUR/USD), British Pound (GBP/USD), Australian Dollar (AUD/USD), Canadian Dollar (USD/CAD), Japanese Yen (USD/JPY), Gold (XAU/USD), Silver (XAG/USD), Crude Oil (WTI), S&P 500 (SPX500), Nasdaq (NDX) and Dow Jones (DJI). These are the levels that matter in the week ahead.
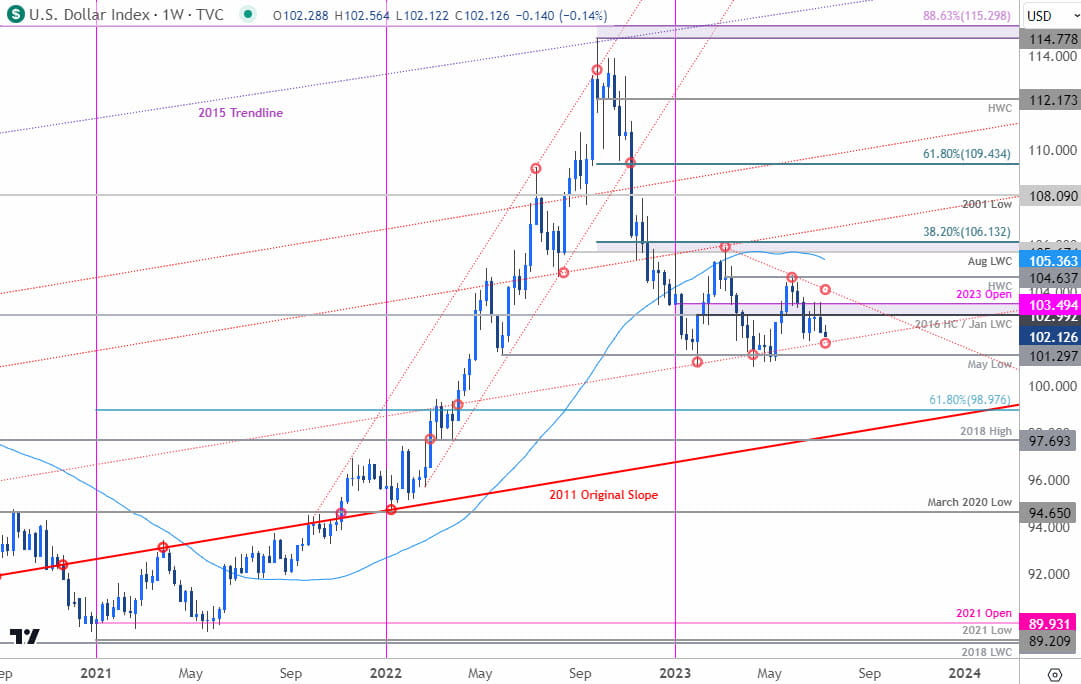
US Dollar Index Price Chart – DXY Weekly

Chart Prepared by Michael Boutros, Sr. Technical Strategist; DXY on TradingView
We’ve been tracking this consolidation in the US Dollar Index for some time now with DXY threatening a breakout in the weeks ahead as the price contraction approaches the apex. Multi-year slope support rests near 101.90s with a weekly close below the 2022 May lows at 101.30 needed to fuel a test of the objective yearly opening-range lows (100.79).
Weekly resistance steady at the yearly open (103.49) and is backed by yearly slope resistance near ~104. Broader bearish invalidation steady at the yearly high-week close at 104.63. The battle-lines are drawn here- sit tight and mind the weekly closes. Review my latest US Dollar Weekly Forecast for a closer look at these DXY technical trade levels.
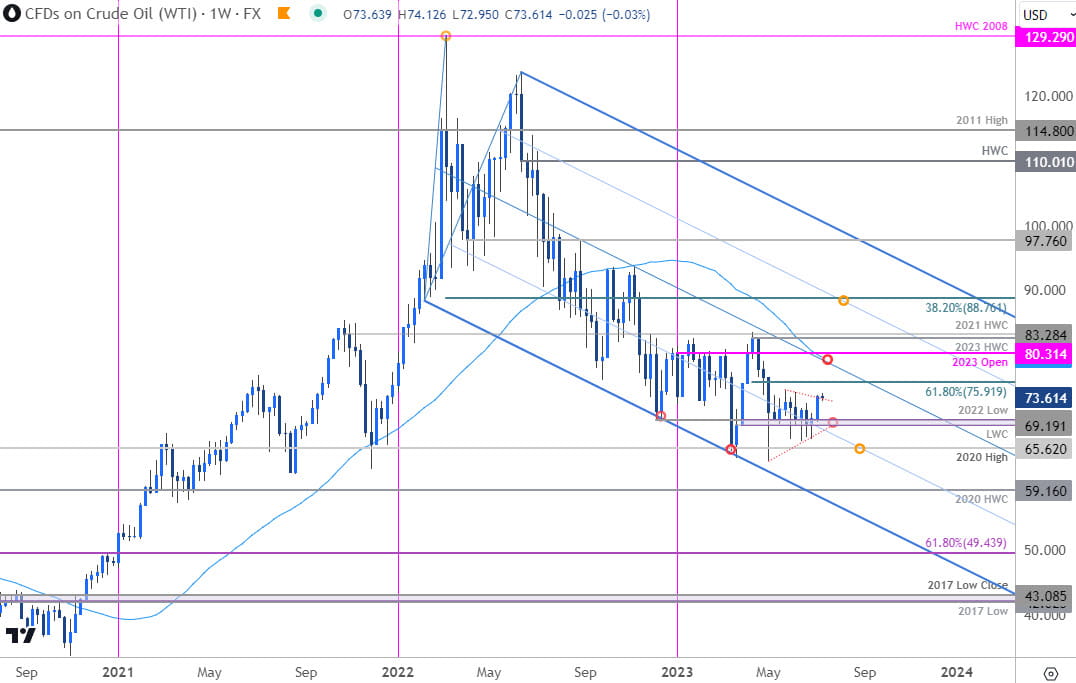
Crude Oil Price Chart – WTI Weekly

Chart Prepared by Michael Boutros, Technical Strategist; WTI on TradingView
It’s a critical week for oil prices with WTI threatening a breakout of a multi-month consolidation pattern above key support at 69.19-70.06- a region defined by the yearly low-week close and the 2022 swing low. A two-week rally off the late-June lows is now probing the upper-bounds of the range and we’re on the lookout for possible price inflection here.
Losses should be limited to the monthly open at 70.39 IF price is heading higher here with a pivot above the 61.8% retracement at 75.91 needed to expose a larger rally towards more significant downtrend resistance near the yearly open. Note that a close below 69.19 would threaten an accelerated washout here– watch the weekly close. Review my latest Crude Oil Weekly Forecast for a closer look at the WTI technical trade levels.
--- Written by Michael Boutros, Sr Technical Strategist with FOREX.com
Follow Michael on Twitter @MBForex


