Weekly Technical Trade Levels on USD Majors, Commodities & Stocks
- Technical setups we are tracking into the weekly open as the carry trade unwinds / equities plunge
- Next Weekly Strategy Webinar: Monday, August 12 at 8:30am EST
- Review the latest Video Updates or Stream Live on my YouTube playlist.
A massive market route is underway with global equities plunging early in the week. In this webinar we take an in-depth look at the technical trade levels for the US Dollar (DXY), 10yr Treasury Yields, Euro (EUR/USD), British Pound (GBP/USD), Australian Dollar (AUD/USD), Canadian Dollar (USD/CAD), Japanese Yen (USD/JPY), AUD/JPY, Swiss Franc (USD/CHF), Gold (XAU/USD), Bitcoin (BTC/USD), Silver (XAG/USD), Crude Oil (WTI), S&P 500 (SPX500), VIX, Nasdaq (NDX) and the Dow Jones (DJI). These are the levels that matter on the technical charts heading into the weekly open.
Japanese Yen Price Chart – USD/JPY Weekly

Chart Prepared by Michael Boutros, Sr. Technical Strategist; USD/JPY on TradingView
USD/JPY has plunged more than 12.5% off the July/yearly high with a sixth consecutive weekly-decline breaking below the 2023 uptrend. The sell-off exhausted into multi-year uptrend support today (red) and the immediate focus is on a reaction off this mark.
Ultimately, a break / close below the 2024 objective yearly open at 141.02 would be needed to validate a break of the yearly opening-range lows and exposes the March 2023 swing high at 137.91 and the original 2021 slope (currently ~136)- both areas of interest for possible downside exhaustion IF reached.
Look for initial resistance at the yearly low-week close (144.63) backed by 148.73-149.60- rallies should be limited to this threshold IF price is heading lower here with broader bearish invalidation now lowered to the 152-handle.
US 10yr Treasury Yield – US10YR Weekly

Chart Prepared by Michael Boutros, Technical Strategist; US10Y on TradingView
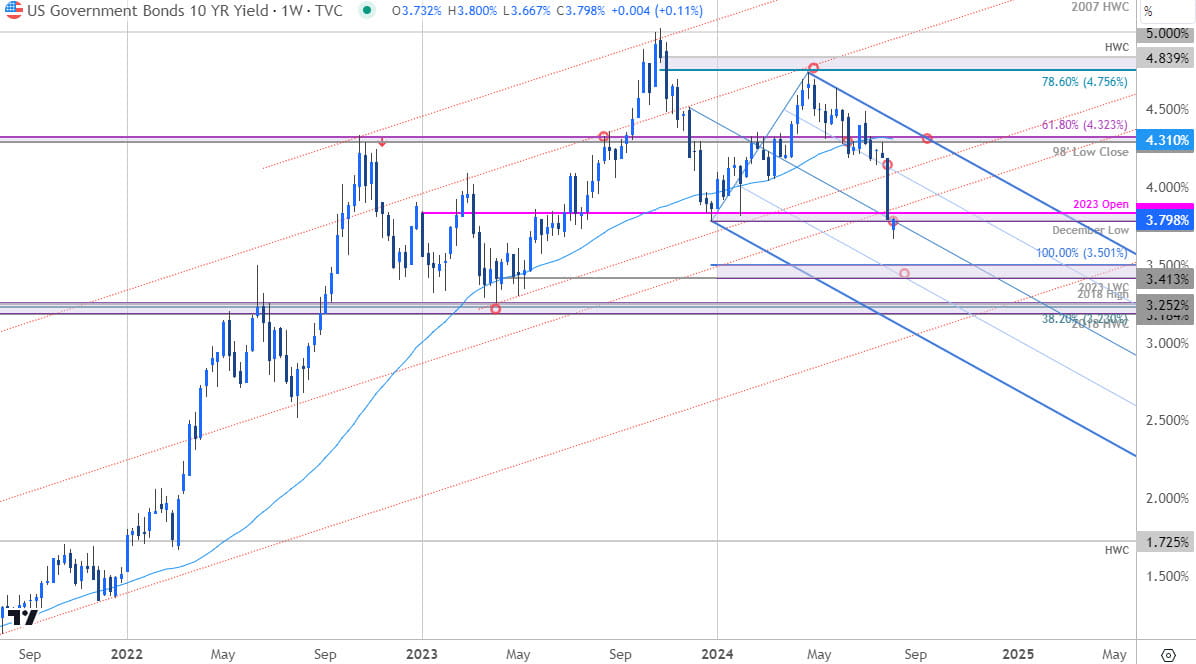
Yields on the US 10-year broke to fresh yearly lows today with the decline taking rates below a technical pivot zone at the December low / 2023 yearly open at 3.78/83- looking for inflection off this mark with the risk weighted to the downside while below. Next key support zones are eyed at 3.41/50 and 3.18/25- both levels of interest for possible exhaustion IF reached. Slope resistance eyed at the 75% parallel (currently near ~4.10) with bearish invalidation now lowered to 4.29/32.
S&P 500 Price Chart – SPX500 Weekly

Chart Prepared by Michael Boutros, Sr. Technical Strategist; S&P 500 on TradingView
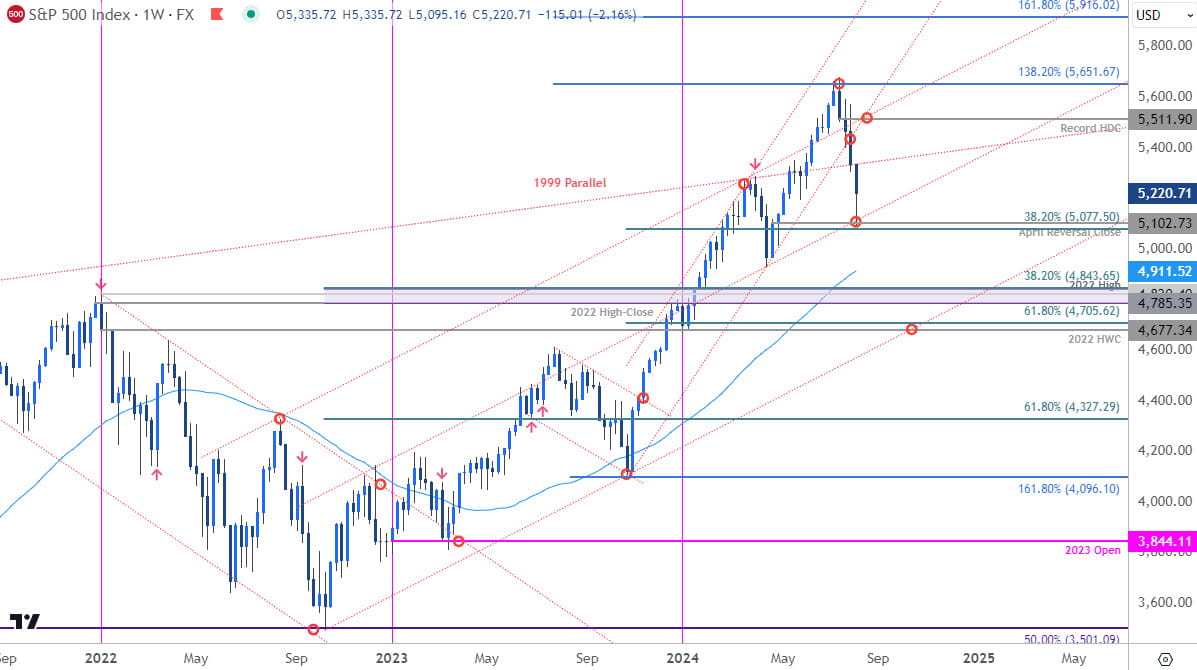
The S&P 500 is poised to mark a fourth consecutive weekly decline with today’s low registering at key near-term support around the 38.2% retracement of the October rally / April reversal close at 5077-5102- risk for near-term support bounce while above this threshold with the broader threat still lower while below the record high-day close at 5511. Next major support zones in the event of a break are eyed at 4785-4843 and 4677-4705.
Economic Calendar – Key USD Data Releases

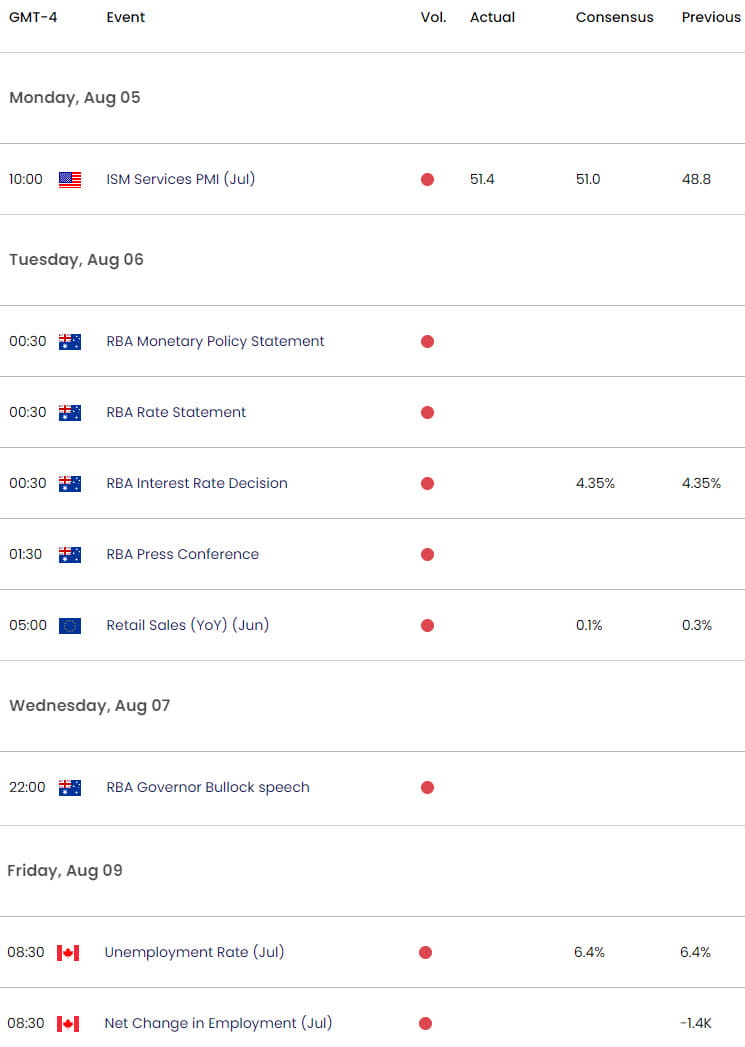
Economic Calendar - latest economic developments and upcoming event risk.
--- Written by Michael Boutros, Sr Technical Strategist with FOREX.com
Follow Michael on X @MBForex


