USD/JPY Outlook
USD/JPY tumbles to a fresh weekly low (151.87) following a weaker-than-expected US Non-Farm Payrolls (NFP) report, but the exchange rate may continue to hold above the April low (150.81) should it track the positive slope in the 50-Day SMA (151.91).
US Dollar Forecast: USD/JPY Tests 50-Day SMA Following Soft NFP Report
USD/JPY extends the decline following the Federal Reserve interest rate decision as the US NFP report shows a 175K rise in April versus forecasts for a 243K print, and it remains to be seen if Japanese authorities will continue to intervene in foreign exchange markets as the exchange rate marks the largest three-day decline since January 2023.
Join David Song for the Weekly Fundamental Market Outlook webinar. David provides a market overview and takes questions in real-time. Register Here
Meanwhile, it seems as though the Federal Open Market Committee (FOMC) is in no rush to change gears as Governor Michelle Bowman expects ‘inflation to remain elevated for some time,’ with the permanent voting-member on the FOMC going onto say that ‘monetary policy is not on a preset course’ while speaking at the Massachusetts Bankers Association Annual Convention.
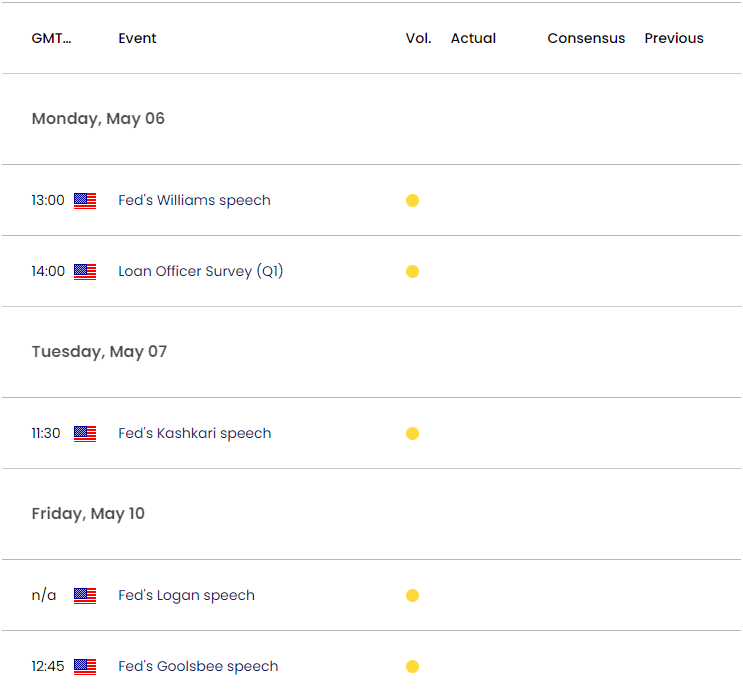
US Economic Calendar

The comments from Governor Bowman suggest the Fed will continue to endorse a data-dependent approach in managing monetary policy as she remains ‘willing to raise the federal funds rate at a future meeting should the incoming data indicate that progress on inflation has stalled or reversed,’ and the upcoming speeches from Fed officials may sway USD/JPY as the central bank struggles to achieve the 2% target for inflation.
In turn, fresh remarks coming out of the Fed may curb the recent selloff in USD/JPY if central bank officials show a greater willingness to keep US interest rates higher for longer, but indications of a looming change in regime may produce headwinds for the Greenback as the FOMC plans to ‘slow the pace of decline in our securities holdings.’
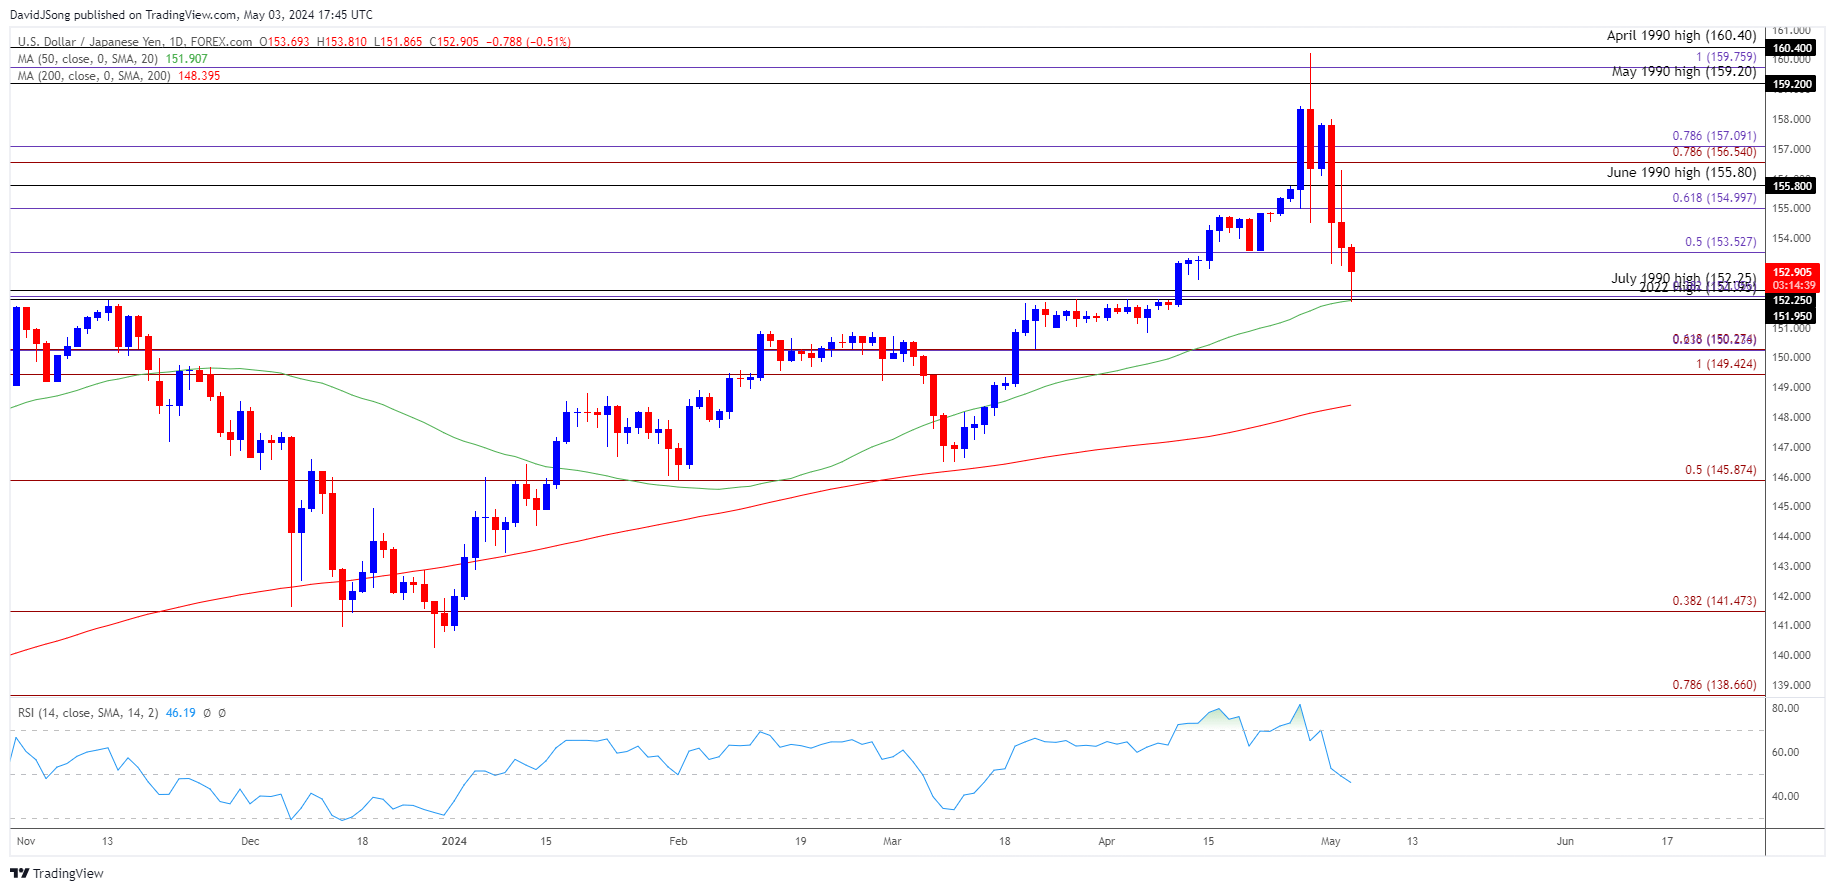
With that said, USD/JPY may continue to give back the advance from the April low (150.81) as it carves a series of lower highs and lows, but the exchange rate may track the positive slope in the 50-Day SMA (151.91) if it struggles to close back below the former-resistance zone around the July 1990 high (152.25) offer support.
USD/JPY Price Chart – Daily

Chart Prepared by David Song, Strategist; USD/JPY on TradingView
- USD/JPY has come up against the 50-Day SMA (151.91) after failing to test the April 1990 high (160.40), with a breach below the April low (150.81) raising the scope for a move towards the 149.40 (100% Fibonacci extension) to 150.30 (61.8% Fibonacci extension) region.
- Next area of interest comes in around the March low (146.48), but USD/JPY may track the positive slope in the 50-Day SMA (151.91) if it struggles to close back below the former-resistance zone around the July 1990 high (152.25) offer support.
- A move back above 153.50 (50% Fibonacci extension) may push USD/JPY towards 155.00 (61.8% Fibonacci extension), with the next region of interest coming in around 156.50 (78.6% Fibonacci extension) to 157.10 (78.6% Fibonacci extension).
Additional Market Outlooks
US Dollar Forecast: GBP/USD Recovery Stalls Ahead of 50-Day SMA
US Dollar Forecast: EUR/USD Bear Flag Formation Remains Intact
--- Written by David Song, Strategist
Follow on Twitter at @DavidJSong


