US Dollar Outlook: USD/JPY
USD/JPY struggles to trade back above the 50-Day SMA (149.64) after taking out the October low (147.29), and the US Personal Consumption Expenditure (PCE) Price Index may keep the exchange rate under pressure as the update is anticipated to show slowing inflation.
US Dollar Forecast: USD/JPY Struggles to Trade Back Above 50-Day SMA
It seems as though USD/JPY will no longer track the positive slope in the moving average following the failed attempt to July 1990 high (152.25), and the exchange rate may continue to give back the rebound from the monthly low (147.15) even though the Bank of Japan (BoJ) sticks to Quantitative and Qualitative Easing (QQE) with Yield Curve Control (YCC).
Join David Song for the Weekly Fundamental Market Outlook webinar. David provides a market overview and takes questions in real-time. Register Here
Speculation surrounding US monetary policy may sway USD/JPY ahead of the Federal Reserve interest rate decision on December 13 as the central bank appears to be at or nearing the end of its hiking-cycle, and it remains to be seen if Chairman Jerome Powell and Co. will adjust the forward guidance as the central bank is scheduled to update the Summary of Economic Projections (SEP).
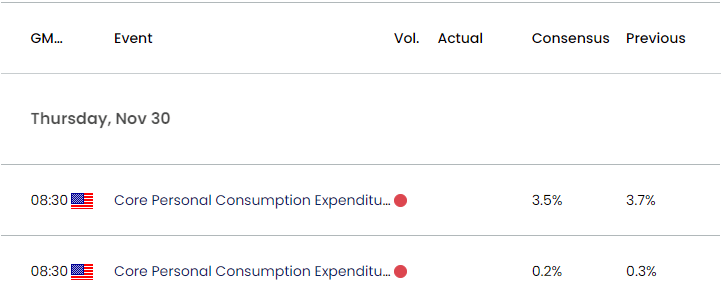
US Economic Calendar

Until then, data prints coming out of the US may sway USD/JPY as the core PCE, the Fed’s preferred gauge for inflation, is seen narrowing to 3.5% in October from 3.7% per annum the month prior, and evidence of easing price growth may generate a bearish reaction in the Greenback as it encourages the Federal Open Market Committee (FOMC) to keep US interest rates on hold.
At the same time, a higher-than-expected core PCE print may curb the recent weakness in USD/JPY as it raises the Fed’s scope to further combat inflation, and the central bank may keep US interest rates higher for longer as ‘all participants judged that it would be appropriate for policy to remain at a restrictive stance for some time until inflation is clearly moving down sustainably toward the Committee's objective.’
With that said, USD/JPY may face increased volatility over the remainder of the month amid speculation for looming change in US monetary policy, and the exchange rate may no longer track the positive slope in the 50-Day SMA (149.64) as it struggles to trade back above the moving average.
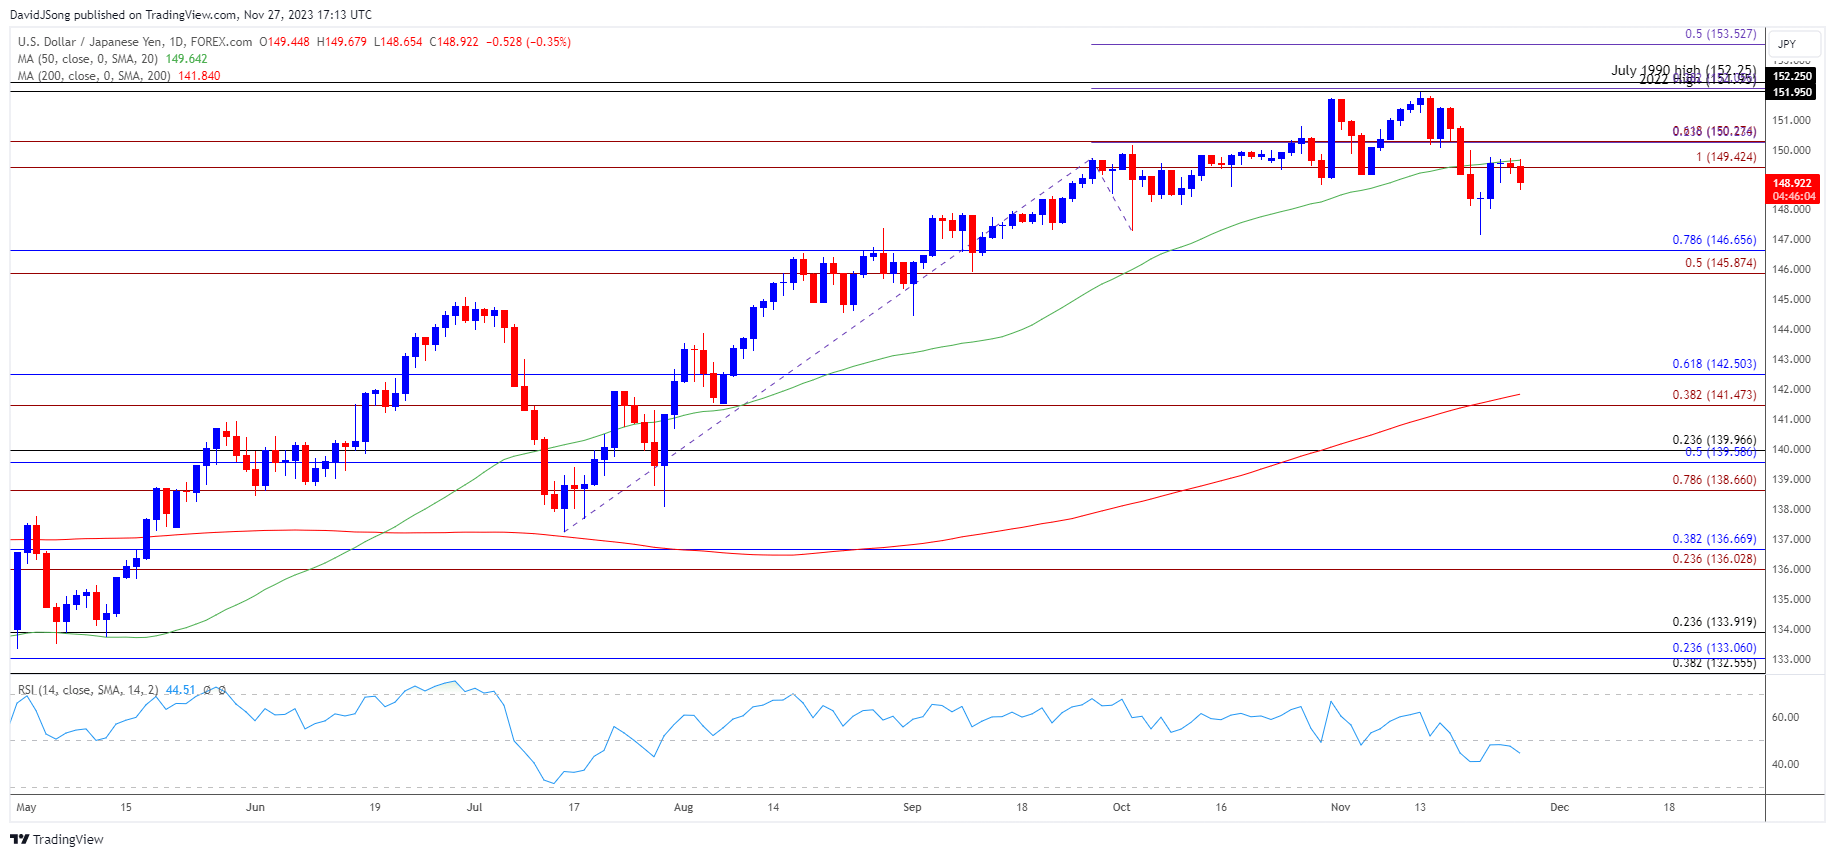
USD/JPY Price Chart – Daily

Chart Prepared by David Song, Strategist; USD/JPY on TradingView
- USD/JPY failed to defend the October low (147.29) after struggling to test the July 1990 high (152.25), and it seems as though the exchange rate will no longer track the positive slope in the 50-Day SMA (149.64) amid the lack of momentum to trade back above the moving average.
- Failure to push back above the 149.40 (100% Fibonacci extension) to 150.30 (61.8% Fibonacci extension) region may push USD/JPY towards the 145.90 (50% Fibonacci extension) to 146.70 (78.6% Fibonacci retracement) zone, with the next area of interest coming in around the September low (144.45).
- Nevertheless, USD/JPY may face range-bound conditions over the remainder of the month as long as it holds above the 145.90 (50% Fibonacci extension) to 146.70 (78.6% Fibonacci retracement) zone, with a move above the 149.40 (100% Fibonacci extension) to 150.30 (61.8% Fibonacci extension) region bringing the November high (151.91) on the radar.
Additional Market Outlooks:
AUD/USD Rate Climbs Above 200-Day SMA for First Time Since July
British Pound Forecast: GBP/USD Pulls Back from Channel Resistance
--- Written by David Song, Strategist
Follow on Twitter at @DavidJSong


