US Dollar Outlook: USD/JPY
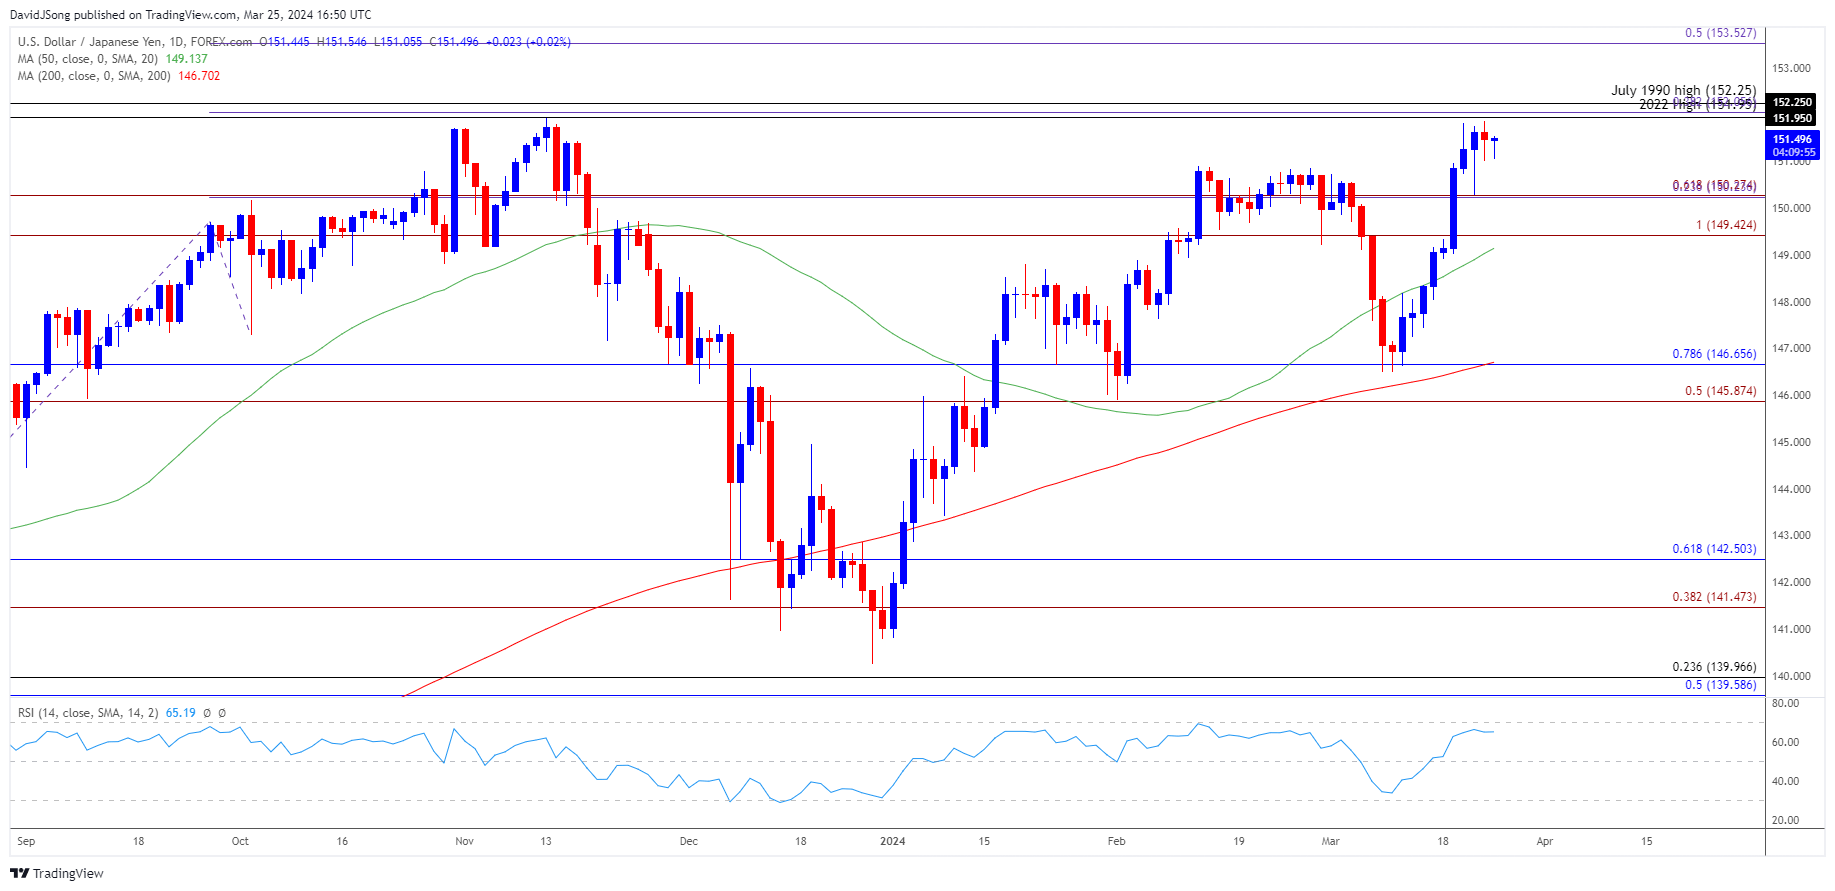
USD/JPY struggles to test the November high (151.91) as it gives back the rebound following the Federal Reserve interest rate decision, and the exchange rate may consolidate over the remainder of the month as the Relative Strength Index (RSI) appears to be reversing ahead of overbought territory.
US Dollar Forecast: USD/JPY Struggles to Test November High
USD/JPY seems to be under pressure as Japan’s Vice Minister of Finance for International Affairs, Masato Kanda, argues that ‘the current weakening of the yen is not in line with fundamentals,’ with the official going onto say that the Ministry of Finance ‘will take appropriate action against excessive fluctuations, without ruling out any options.’
Join David Song for the Weekly Fundamental Market Outlook webinar. David provides a market overview and takes questions in real-time. Register Here
It remains to be seen if Japanese authorities will intervene in foreign exchange markets as the Bank of Japan (BoJ) shows no interest in pursuing a rate-hike cycle, and developments coming out of the US may continue influence USD/JPY as the Federal Open Market Committee (FOMC) prepares to alter the course for monetary policy.
US Economic Calendar

However, the update to the Personal Consumption Expenditure (PCE) Price Index, the Fed’s preferred gauge for inflation, may limit the central bank’s scope to unwind its restrictive policy as both the headline and core rate of inflation are expected to hold steady in February.
Evidence of sticky inflation may curb the recent weakness in USD/JPY as it puts pressure on the FOMC to keep US Interest rate higher for longer, but an unexpected slowdown in the PCE may lead to a larger pullback in the exchange rate as it fuels speculation for an imminent Fed rate cut.
With that said, USD/JPY may consolidate over the remainder of the month as it struggles to test the November high (151.91), but the recent decline in the exchange rate may end up short lived if it tracks the positive slope in the 50-Day SMA (149.13).
USD/JPY Price Chart – Daily

Chart Prepared by David Song, Strategist; USD/JPY on TradingView
- USD/JPY pulls back ahead of the November high (151.91) to keep the Relative Strength Index (RSI) below 70, and the oscillator may show the bullish momentum abating should it continue to move away from overbought territory.
- Failure to hold above the 149.40 (100% Fibonacci extension) to 150.30 (61.8% Fibonacci extension) region may push USD/JPY towards the 145.90 (50% Fibonacci extension) to 146.70 (78.6% Fibonacci retracement) area, which incorporates the monthly low (146.48).
- Nevertheless, USD/JPY may track the positive slope in the 50-Day SMA (149.13) if it continues to hold above the 149.40 (100% Fibonacci extension) to 150.30 (61.8% Fibonacci extension) region, with a breach above the 151.95 (2022 high) to 152.25 (July 1990 high) zone opening up 153.50 (50% Fibonacci extension).
Additional Market Outlooks
GBP/USD Forecast: Pound Susceptible to Test of Monthly Low After BoE
US Dollar Forecast: EUR/USD Bounces Along 50-Day SMA with Fed on Tap
--- Written by David Song, Strategist
Follow on Twitter at @DavidJSong


