US Dollar Outlook: USD/JPY
USD/JPY appears to be bouncing back ahead of the monthly low (144.45) as it retraces the decline from the start of the week, and the exchange rate may stage further attempts to test the November 2022 high (148.83) should the US Consumer Price Index (CPI) show sticky inflation.
US Dollar Forecast: USD/JPY Rebounds with US CPI on Tap
USD/JPY consolidates after registering a fresh yearly high (147.88) during the previous week, and developments coming out of the US may sway the exchange rate as the Bank of Japan (BoJ) sticks to Quantitative and Qualitative Easing (QQE) with Yield Curve Control (YCC).
Recent remarks by BoJ board member Junko Nakagawa suggest the central bank is in no rush to switch gears as ‘the Policy Board members' forecasts for the year-on-year rate of change in the CPI (all items excluding fresh food) are 2.5 percent for fiscal 2023, 1.9 percent for fiscal 2024, and 1.6 percent for fiscal 2025.’
It seems as though the BoJ will continue to carry out its easing cycle as the board pledges to ‘achieve the price stability target of 2 percent in a sustainable and stable manner,’ and it remains to be seen if the Federal Reserve will retain the current course for US monetary policy as the headline CPI is anticipated to increase to 3.6% in August from 3.2% per annum the month prior.
Join David Song for the Weekly Fundamental Market Outlook webinar. David provides a market overview and takes questions in real-time. Register Here
US Economic Calendar

Although the core CPI is expected to narrow to 4.3% from 4.7% during the same period, both measures of inflation remain above the Fed’s 2% target, and signs of persistent price growth may generate a bullish reaction in the Greenback it fuels speculation for higher US interest rates.
However, a softer-than-expected CPI print may drag on USD/JPY as it puts pressure on the Federal Open Market Committee (FOMC) to conclude its hiking-cycle, and failure to defend the opening range for September may lead to a near-term correction in the exchange rate as the Relative Strength Index (RSI) seems to be diverging with price.
With that said, the update to the US CPI may sway USD/JPY as the Fed keeps the door open to implement a more restrictive policy, and the exchange rate may stage further attempts to test the November 2022 high (148.83) as it bounces back ahead of the monthly low (144.45).
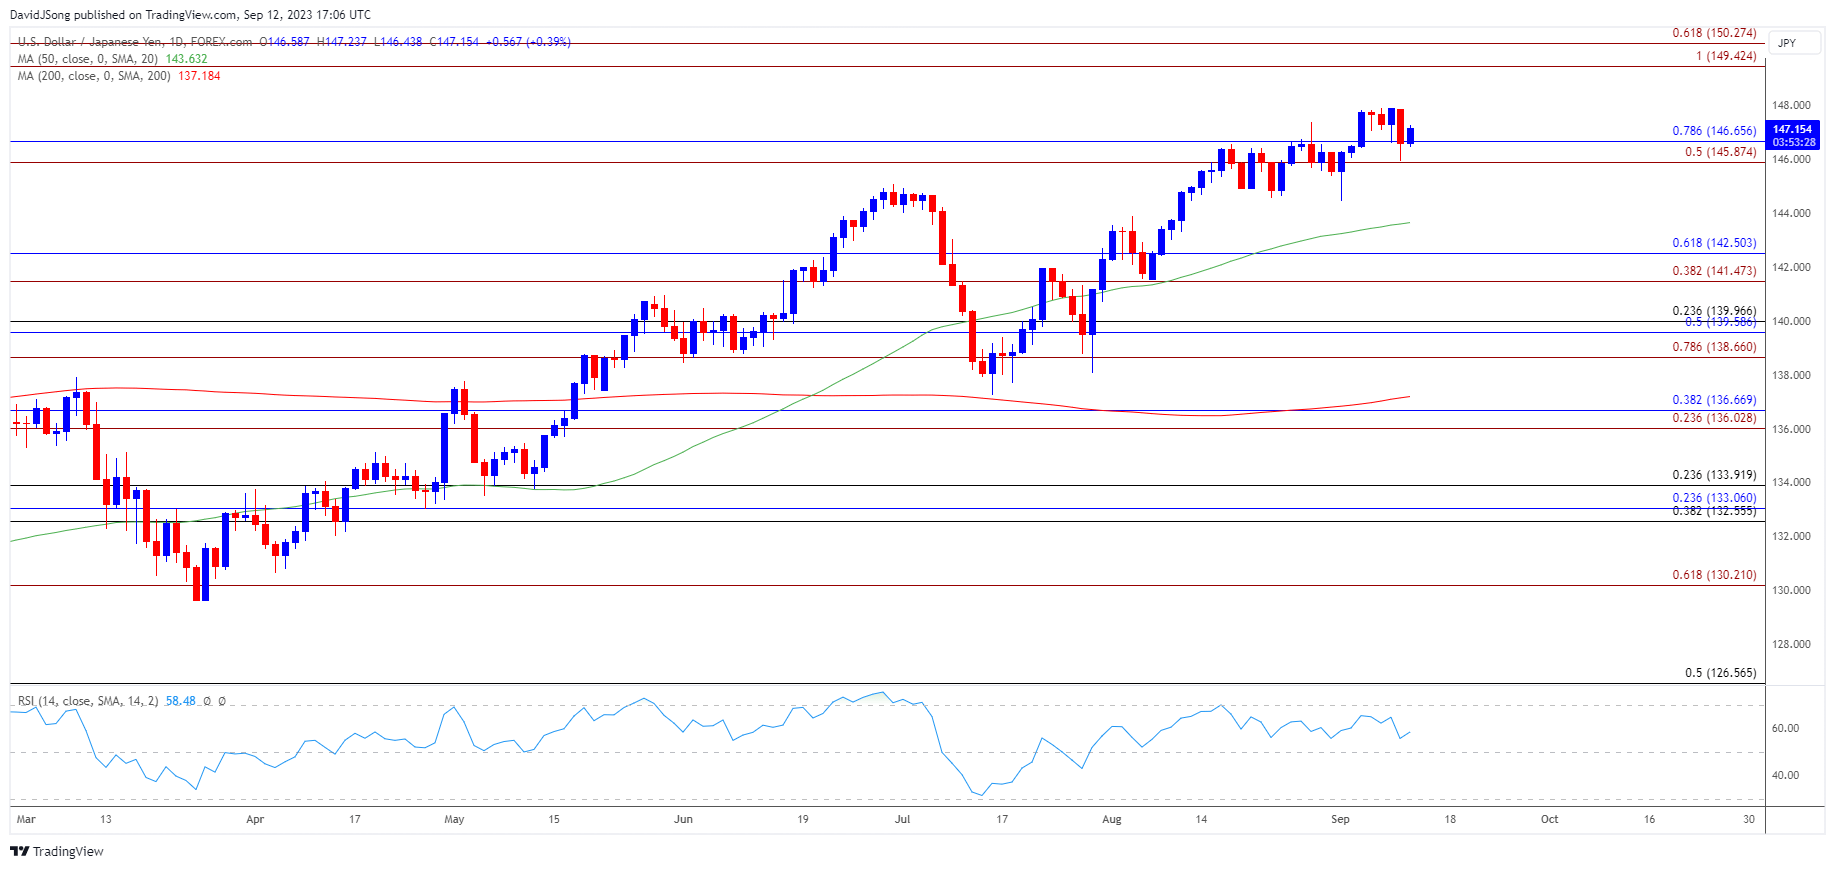
USD/JPY Price Chart – Daily

Chart Prepared by David Song, Strategist; USD/JPY on TradingView
- USD/JPY registered a fresh yearly high (147.88) during the previous week as it extended the advance from the start of the month, but the Relative Strength Index (RSI) seems to be diverging with price as it fails to reflect the extreme readings from earlier this year.
- Nevertheless, USD/JPY may track the positive slope in the 50-Day SMA (143.63) as it bounces back ahead of the monthly low (144.45), and the exchange rate may stage further attempts to test the November 2022 high (148.83) as it holds above the 145.90 (50% Fibonacci extension) to 146.70 (78.6% Fibonacci retracement) region.
- Next area of interest comes in around 149.40 (100% Fibonacci extension) to 150.30 (61.8% Fibonacci extension), but failure to defend the opening range for September may push USD/JPY towards the 50-Day SMA (143.63).
Additional Market Outlooks:
British Pound Forecast: GBP/USD Head-and-Shoulders Pattern Unfolds
USD/CAD Post-BoC Rise Pushes RSI Towards Overbought Zone
--- Written by David Song, Strategist
Follow on Twitter at @DavidJSong


