US Dollar Outlook: USD/JPY
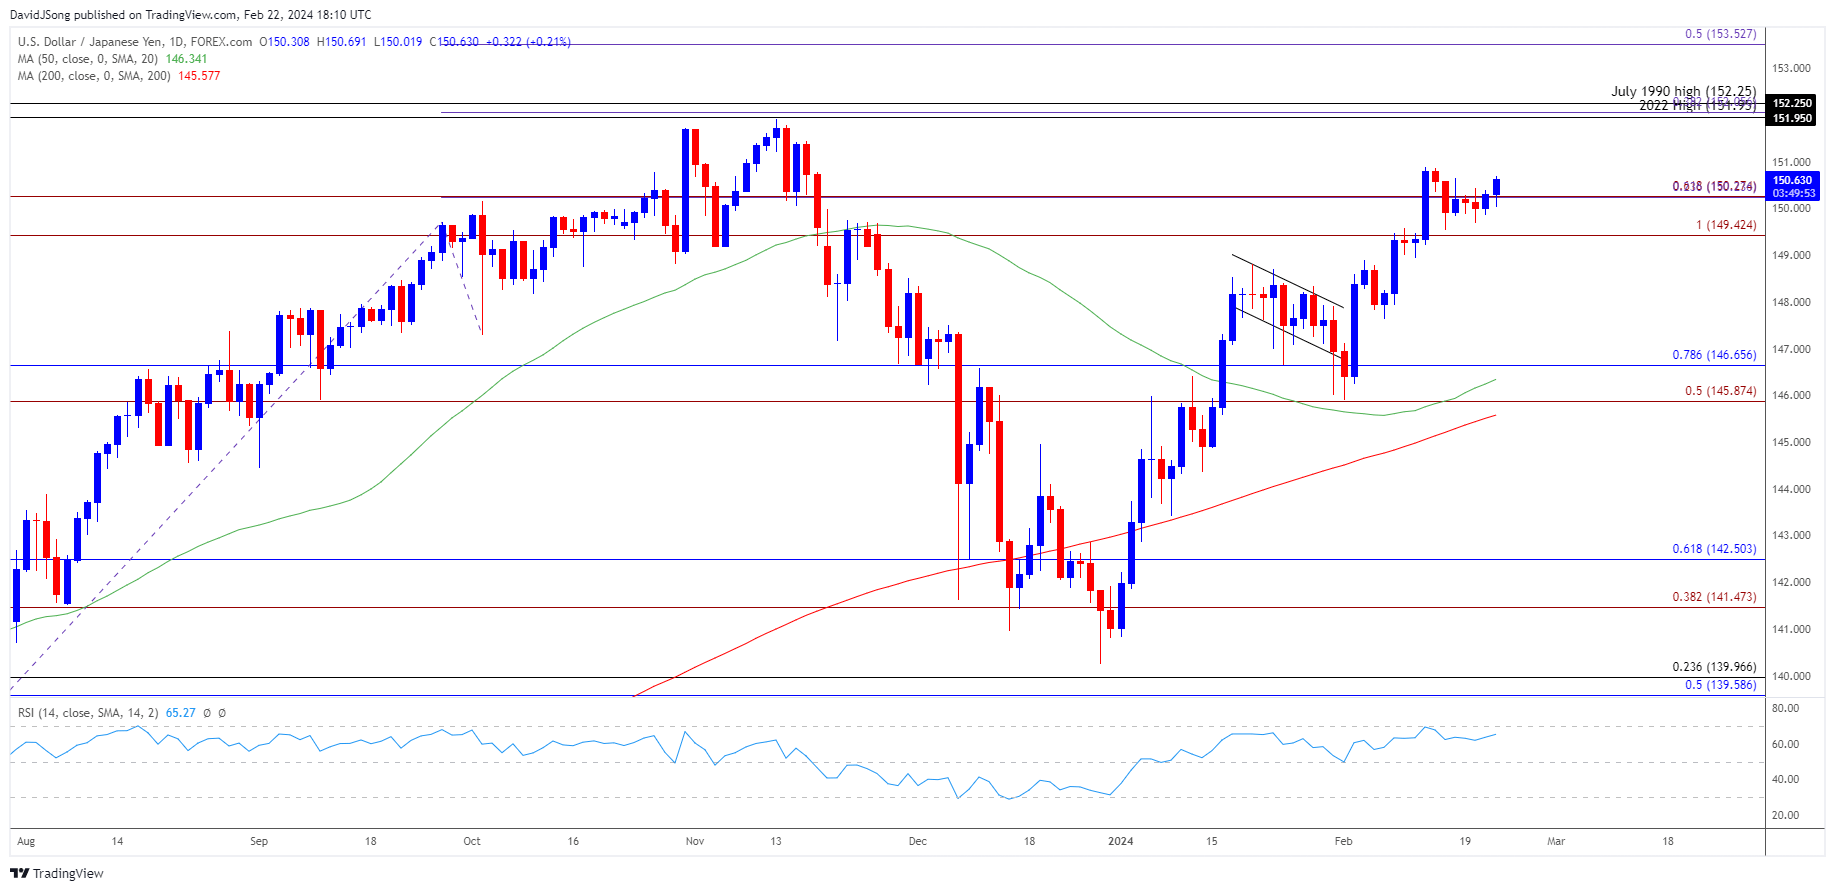
USD/JPY may continue to retrace the decline from the monthly high (150.89) as it breaks out of the range bound price action from earlier this week, and the exchange rate may attempt to test the 2023 high (151.91) should it track the positive slope in the 50-Day SMA (146.34).
US Dollar Forecast: USD/JPY Rate Eyes Monthly High
USD/JPY trades to a fresh weekly high (150.65) after showing a limited reaction to the Federal Open Market Committee (FOMC) Minutes, but the diverging paths between the Fed and Bank of Japan (BoJ) may keep the exchange rate afloat as Governor Kazuo Ueda and Co. plan to ‘patiently continue with monetary easing.’
Join David Song for the Weekly Fundamental Market Outlook webinar. David provides a market overview and takes questions in real-time. Register Here
In contrast, the FOMC suggests the central bank is in no rush to switch gears as ‘most participants noted the risks of moving too quickly to ease the stance of policy,’ and the Fed may keep US interest rates higher for longer as the Consumer Price Index (CPI) points to sticky inflation.
US Economic Calendar

However, the update to the Personal Consumption Expenditure (PCE) Price Index may sway the FOMC if the core rate, the Fed’s preferred gauge for inflation, continues to narrow in January, and evidence of easing price growth may drag on the US Dollar as it puts pressure on the central bank to unwind its restrictive policy sooner rather than later.
At the same time, a higher-than-expected core PCE print may fuel the recent advance in USD/JPY as Chairman Jerome Powell tames speculation for an imminent rate cut, and the exchange rate may stage a further advance ahead of the next Fed rate decision on March 20 should it track the positive slope in the 50-Day SMA (146.34).
With that said, it remains to be seen if authorities in Japan will intervene in foreign exchange markets as USD/JPY retraces the decline from the monthly high (150.89), but the exchange rate may attempt to test the 2023 high (151.91) as it breaks out of the range bound price action from earlier this week.
USD/JPY Price Chart – Daily

Chart Prepared by David Song, Strategist; USD/JPY on TradingView
- Keep in mind, USD/JPY broke out of a bull-flag formation to register a fresh yearly high (150.89), but the rally may have stalled ahead of the 2023 high (151.91) as it failed to push the Relative Strength Index (RSI) into overbought territory.
- Failure to hold above the 149.40 (100% Fibonacci extension) to 150.30 (61.8% Fibonacci extension) region may push USD/JPY towards the 145.90 (50% Fibonacci extension) to 146.70 (78.6% Fibonacci retracement) area, which includes the monthly low (145.90), with the next area of interest comes in around 141.50 (38.2% Fibonacci extension) to 142.50 (61.8% Fibonacci retracement).
- Nevertheless, USD/JPY may track the positive slope in the 50-Day SMA (146.34) if it continues to hold above the 149.40 (100% Fibonacci extension) to 150.30 (61.8% Fibonacci extension) region, with a break above the high (150.89) bringing the 2023 high (151.91) back on the radar.
Additional Market Outlooks
US Dollar Forecast: EUR/USD Recovery Fizzles Ahead of Monthly High
US Dollar Forecast: AUD/USD on Cusp of Testing Monthly High
--- Written by David Song, Strategist
Follow on Twitter at @DavidJSong


