US Dollar Outlook: USD/JPY
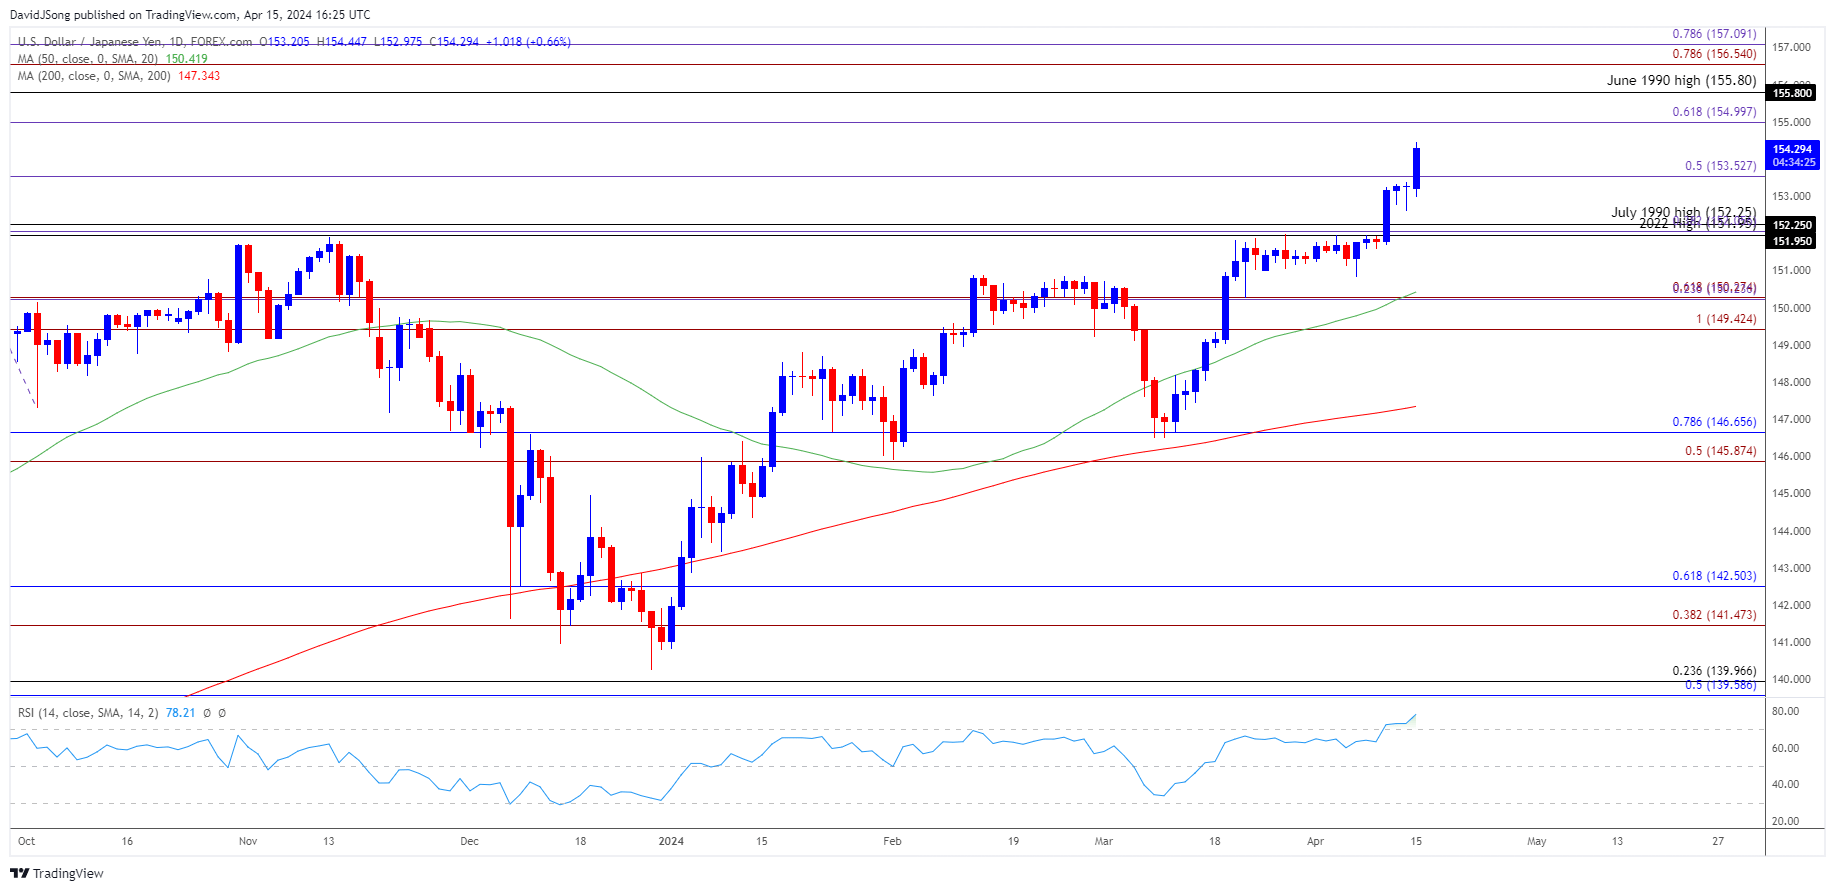
USD/JPY trades to a fresh yearly high (154.45) as US Retail Sales climbs 0.7% in March versus forecasts for a 0.3% rise, and the exchange rate may test the June 1990 high (155.80) as the Relative Strength Index (RSI) holds in overbought territory.
US Dollar Forecast: USD/JPY Rally Eyes June 1990 High
Keep in mind, USD/JPY cleared the July 1990 high (152.25) during the previous week to push the RSI above 70 for the first time this year, and the exchange rate now appears to be tracking the rise in long-term US Treasury yields as the ongoing expansion in private sector consumption raises the Federal Reserve’s scope to further combat inflation.
Join David Song for the Weekly Fundamental Market Outlook webinar. David provides a market overview and takes questions in real-time. Register Here
In turn, developments coming out of the US may sway USD/JPY ahead of the Federal Open Market Committee (FOMC) rate decision on May 1 as the Bank of Japan (BoJ) shows little interest in pursuing a rate-hike cycle, and it remains to be seen if Fed officials will continue to forecast a less restrictive policy as the Consumer Price Index (CPI) reflects persistent price growth.
US Economic Calendar

As a result, fresh remarks from Fed Chairman Jerome Powell may influence USD/JPY as the central bank continues to discuss a less restrictive policy in 2024, and hints of a looming change in regime may curb the recent advance in the exchange rate as market participants brace for a rate cut.
However, USD/JPY may extend the advance from the start of the week if Chairman Powell shows a greater willingness to keep US interest rates higher for longer, and the exchange rate may continue to appreciate over the remainder of the month as it seems to be tracking the positive slope in the 50-Day SMA (150.42).
With that said, USD/JPY may test the June 1990 high (155.80) as the Relative Strength Index (RSI) pushes into overbought territory for the first time in 2024, but the exchange rate may face a near-term pullback once the oscillator falls below 70 to indicate a textbook sell signal.
USD/JPY Price Chart – Daily

Chart Prepared by David Song, Strategist; USD/JPY on TradingView
- USD/JPY continues to trade to a fresh yearly high (154.45) after clearing the July 1990 high (152.25), and the exchange rate may test the June 1990 high (155.80) as long as the Relative Strength Index (RSI) holds above 70.
- The overbought reading in the RSI is likely to be accompanied by a further advance in USD/JPY like the price action from last year, with a break/close above the 155.00 (61.8% Fibonacci extension) to 155.80 (June 1990 high) region opening up the 156.50 (78.6% Fibonacci extension) to 157.10 (78.6% Fibonacci extension) area.
- However, lack of momentum to test the June 1990 high (155.80) may pull the RSI back from overbought territory, with a move below 153.50 (50% Fibonacci extension) bringing the 151.95 (2022 high) to 152.10 (38.2% Fibonacci extension) area back on the radar, which lines up with the former resistance zone around the November high (151.91).
Additional Market Outlooks
US Dollar Forecast: USD/CAD Rallies Within Ascending Channel
US Dollar Forecast: GBP/USD Pushes Above Opening Range for April
--- Written by David Song, Strategist
Follow on Twitter at @DavidJSong


