US Dollar Outlook: USD/JPY
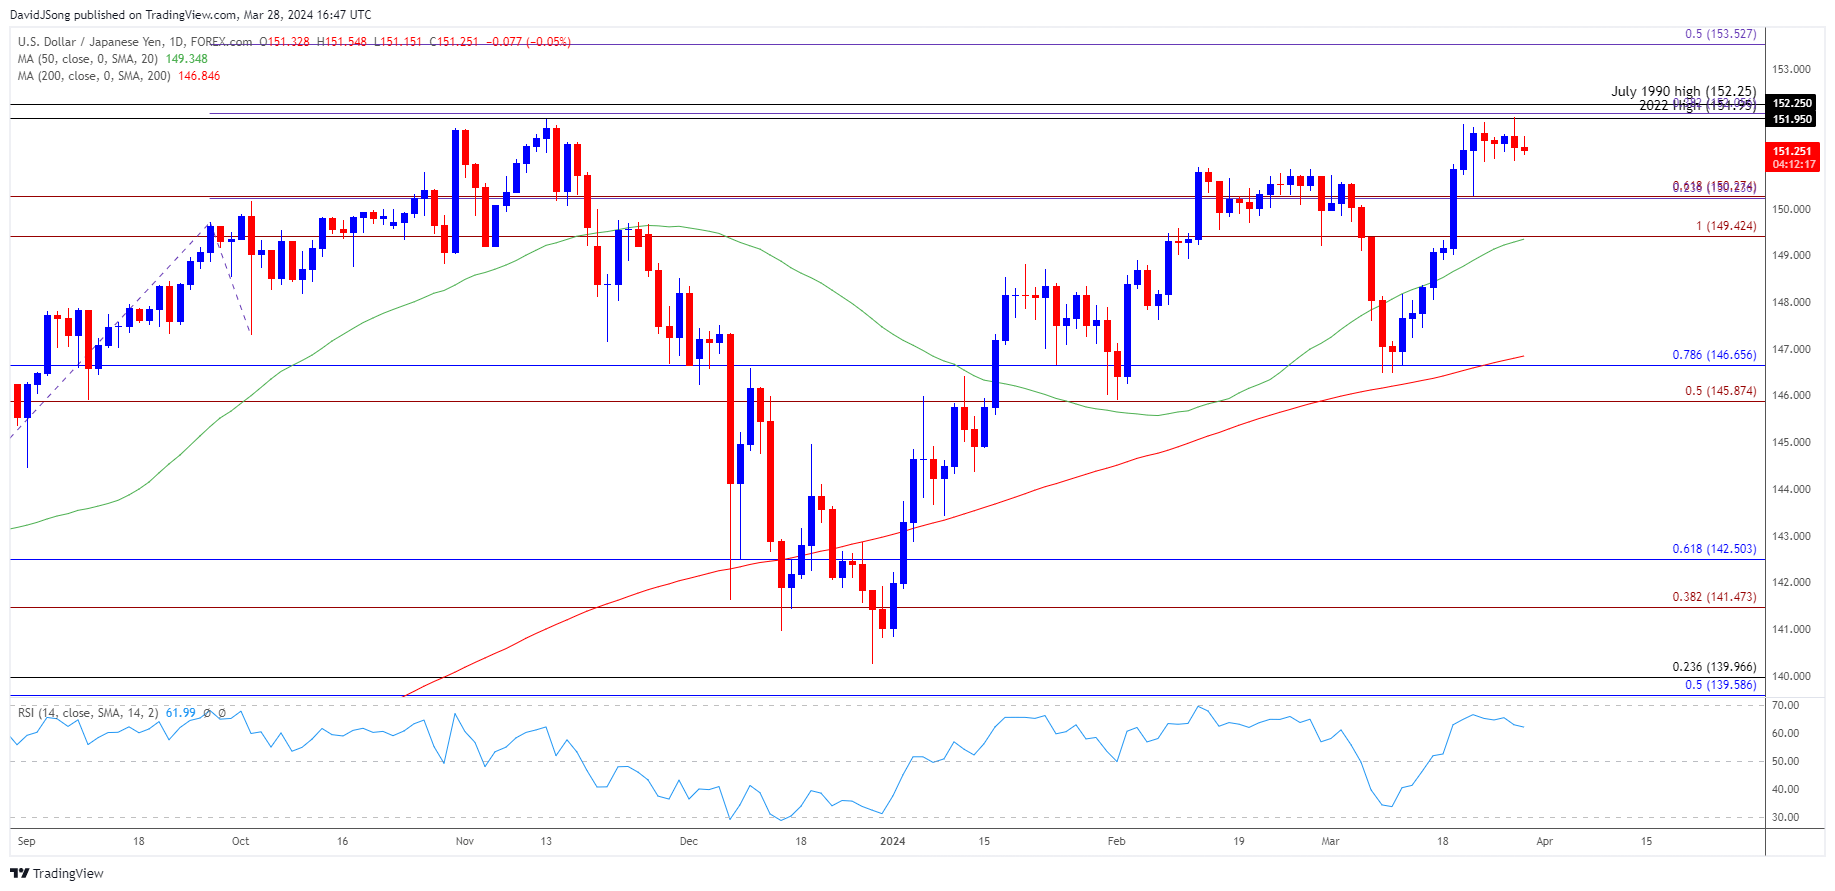
USD/JPY consolidates after clearing the 2022 high (151.95), but the exchange rate may attempt to break out of the range bound price action if it responds to the positive slope in the 50-Day SMA (149.35).
US Dollar Forecast: USD/JPY Struggles to Test November High
USD/JPY seems to be unfazed by the warning shots by Japanese authorities as it trades near the yearly high (151.97), and the threat of a currency intervention may persist as the Bank of Japan (BoJ) shows no interest in carrying out a hiking-cycle.
Join David Song for the Weekly Fundamental Market Outlook webinar. David provides a market overview and takes questions in real-time. Register Here
In turn, the opening range for April in focus for USD/JPY as market participation is likely to pick up following the Easter holiday, and it remains to be seen if the exchange rate will mirror seasonal tendencies as the Federal Reserve appears to be on track to unwind its restrictive policy this year.
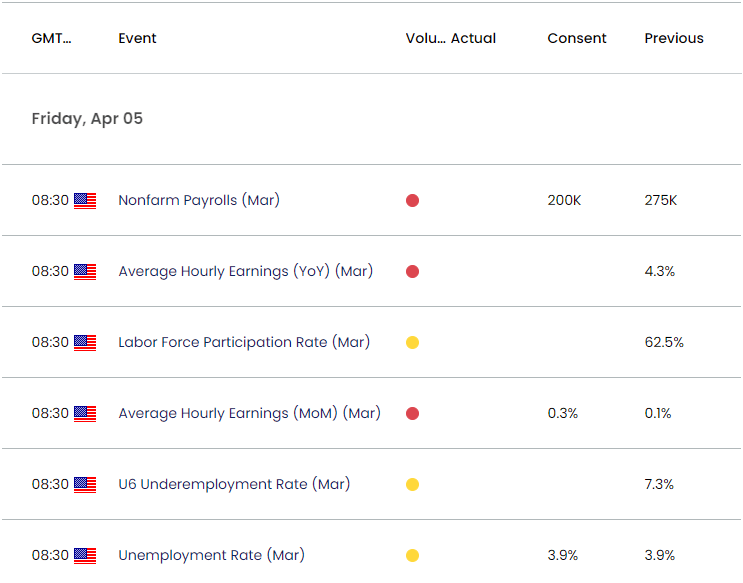
US Economic Calendar

However, the update to the US Non-Farm Payrolls (NFP) report may force the Federal Open Market Committee (FOMC) to keep interest rates higher for longer as the economy is anticipated to add 200K jobs in March while the Unemployment Rate is expected to hold steady at 3.9% during the same period.
As a result, the Fed may further combat inflation amid the ongoing rise in employment, and a positive development may keep USD/JPY afloat as the BoJ remains reluctant to implement higher interest rates.
However, a weaker-than-expected NFP report may produce headwinds for the Greenback as it puts pressure on the FOMC to deliver a rate cut sooner rather than later, and USD/JPY may struggle to retain the advance from the monthly low (146.49) if it shows a limited response to the positive slope in the 50-Day SMA (149.35).
With that said, the opening range for April is in focus as USD/JPY is little changed from the start of the week, but the exchange rate may stage further attempts to test the July 1990 high (152.25) if it continues to hold above the moving average.
USD/JPY Price Chart – Daily

Chart Prepared by David Song, Strategist; USD/JPY on TradingView
- USD/JPY appears to be stuck in a narrow range after clearing the 2022 high (151.95), but lack of momentum to test the July 1990 high (152.25) may lead to a near-term pullback in the exchange rate as the Relative Strength Index (RSI) seems to be reversing ahead of overbought territory.
- A break/close below the 149.40 (100% Fibonacci extension) to 150.30 (61.8% Fibonacci extension) region may push USD/JPY towards the 145.90 (50% Fibonacci extension) to 146.70 (78.6% Fibonacci retracement) area, with a breach below the February low (145.90) opening up the 141.50 (38.2% Fibonacci extension) to 142.50 (61.8% Fibonacci retracement) zone.
- Nevertheless, USD/JPY may stage further attempts to test the July 1990 high (152.25) should it respond to the positive slope in the 50-Day SMA (149.35), with the next area of interest coming in around 153.50 (50% Fibonacci extension).
Additional Market Outlooks
US Dollar Forecast: EUR/USD Defends March Opening Range for Now
US Dollar Forecast: USD/CAD Pulls Back Ahead of December High
--- Written by David Song, Strategist
Follow on Twitter at @DavidJSong


