US Dollar Outlook: USD/JPY
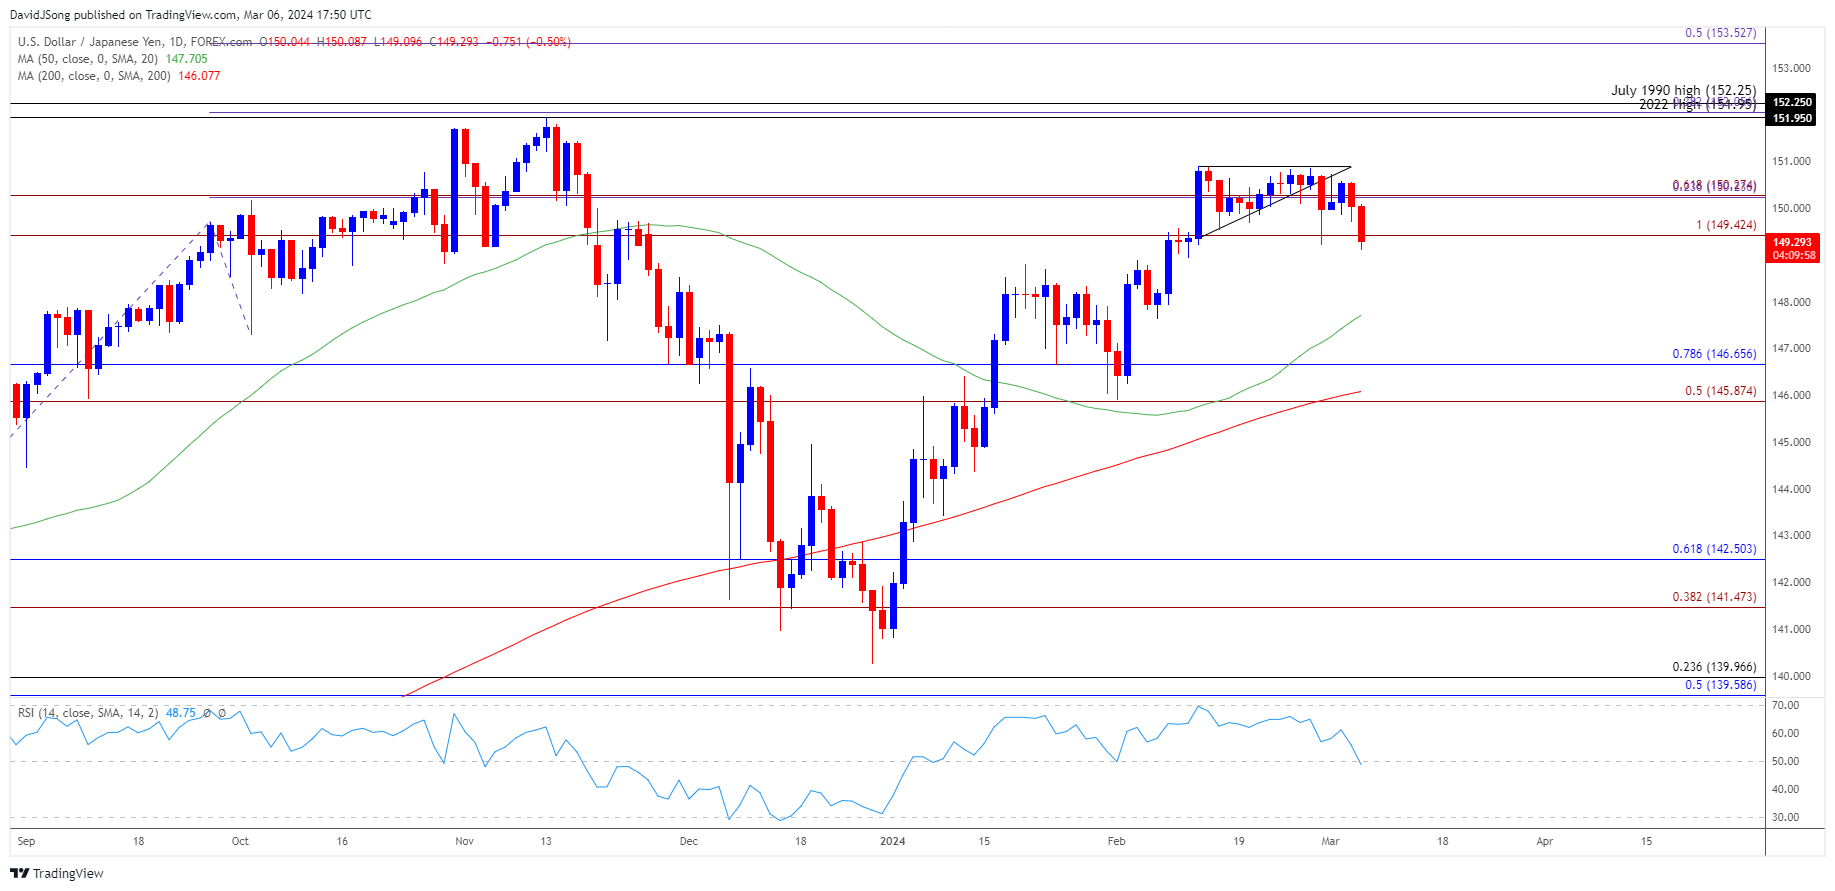
USD/JPY continues to trade within last month’s range as it negates an ascending triangle formation, but the exchange rate may stage further attempts to test the February high (150.89) if it responds to the positive slope in the 50-Day SMA (147.71).
US Dollar Forecast: USD/JPY Negates Ascending Triangle
USD/JPY trades to a fresh weekly low (149.10) as Federal Reserve Chairman Jerome Powell tells US lawmakers that ‘our policy rate is likely at its peak for this tightening cycle,’ and developments in the Relative Strength Index (RSI) may continue to show the bullish momentum unraveling as it moves away from overbought territory.
Join David Song for the Weekly Fundamental Market Outlook webinar. David provides a market overview and takes questions in real-time. Register Here
As a result, USD/JPY may face a larger pullback ahead of the Federal Open Market Committee (FOMC) interest rate decision on March 20 as Chairman Powell acknowledges that ‘it will likely be appropriate to begin dialing back policy restraint at some point this year,’ and it remains to be seen when the central bank will further adjust the forward guidance for monetary policy as ‘the Committee does not expect that it will be appropriate to reduce the target range until it has gained greater confidence that inflation is moving sustainably toward 2 percent.’
US Economic Calendar

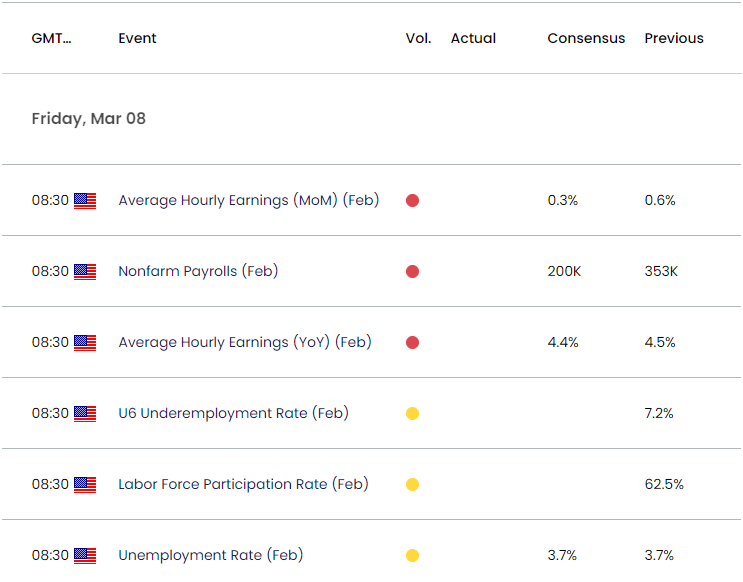
Until then, data prints coming out of the US may sway USD/JPY as the Non-Farm Payrolls (NFP) report is anticipated to show the economy adding 200K jobs in February, and ongoing signs of a robust labor market may generate a bullish reaction in the US Dollar as it widens the Fed’s scope to keep US interest rates higher for longer.
However, a lower-than-expected NFP print may drag on USD/JPY as it puts pressure on the FOMC to switch gears sooner rather than later, and the exchange rate may face a larger pullback over the coming days as it negates an ascending triangle formation.
With that said, USD/CAD may continue to trade within the last month’s range as it negates an ascending triangle formation, but the exchange rate may stage further attempts to test the February high (150.89) should it track the positive slope in the 50-Day SMA (147.71).
USD/JPY Price Chart – Daily

Chart Prepared by David Song, Strategist; USD/JPY on TradingView
- The opening range for March is in focus as USD/JPY negates an ascending triangle formation, with a close below the 149.40 (100% Fibonacci extension) to 150.30 (61.8% Fibonacci extension) region raising the scope for a move towards the 50-Day SMA (147.71).
- The Relative Strength Index (RSI) may continue to show the bullish momentum abating as it moves away from overbought territory, with a breach below the moving average opening up the February low (145.90).
- Nevertheless, USD/JPY may track last month’s range should it respond to the positive slope in the moving average, but a breach above the February high (150.89) brings the 2023 high (151.91) on the radar.
Additional Market Outlooks
US Dollar Forecast: AUD/USD Faces Negative Slope in 50-Day SMA
US Dollar Forecast: USD/CAD Trades in Ascending Channel Ahead of BoC
--- Written by David Song, Strategist
Follow on Twitter at @DavidJSong


