US Dollar Outlook: USD/JPY
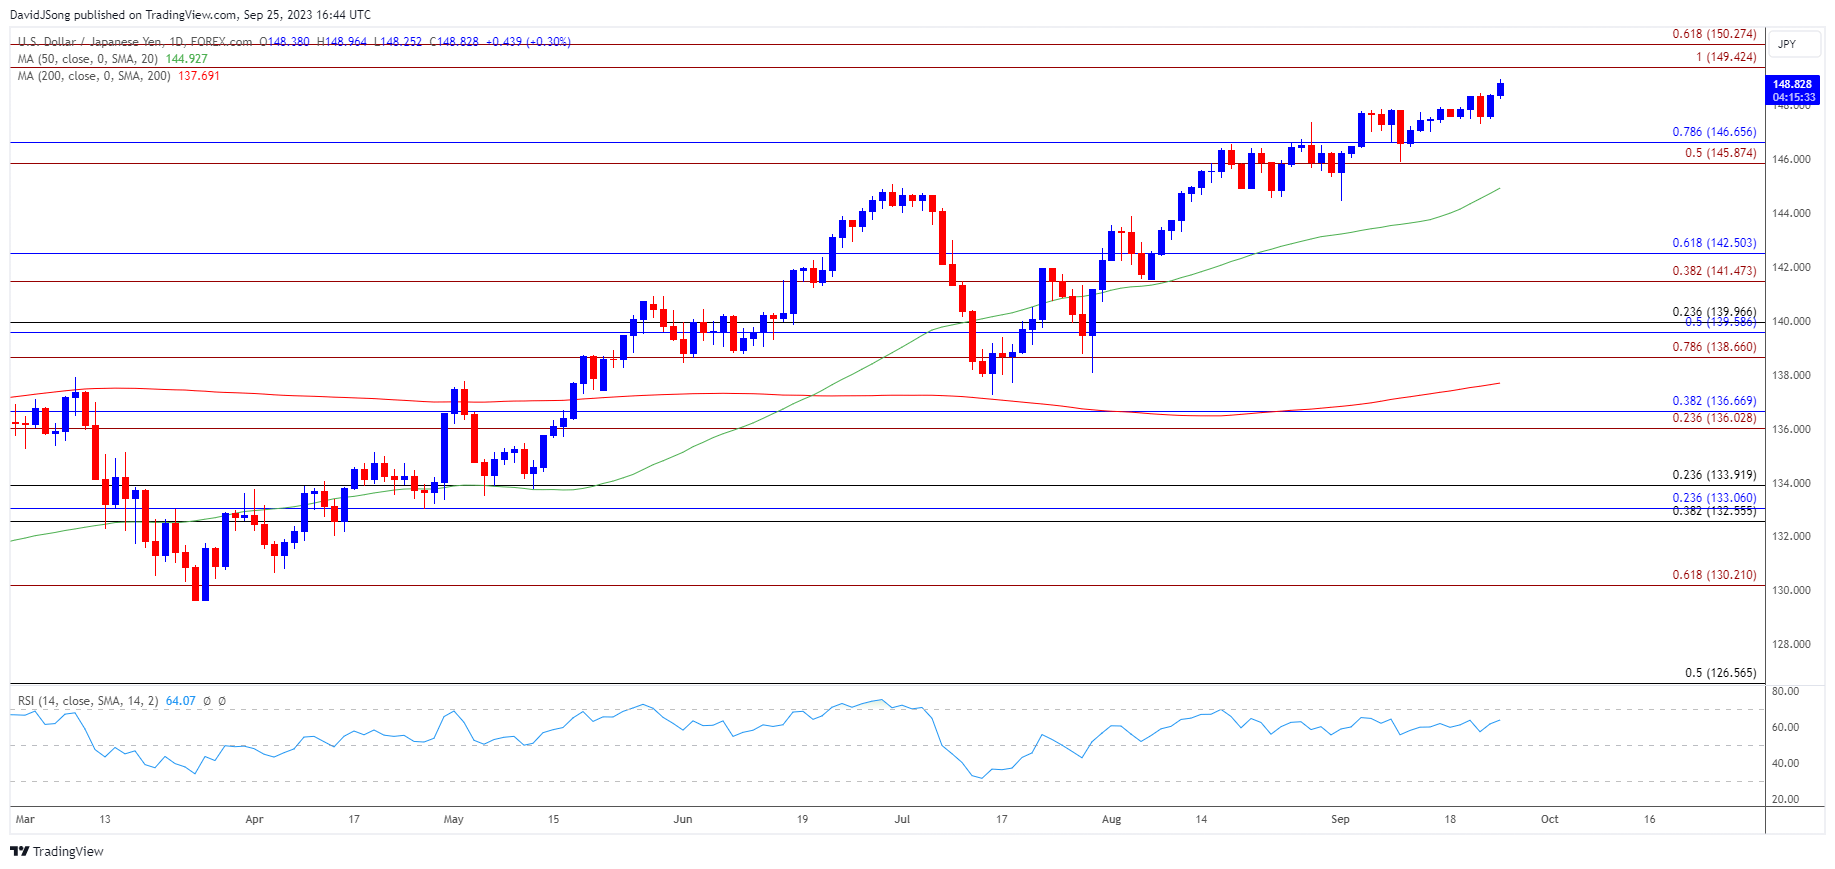
USD/JPY clears the November 2022 high (148.83) as it extends the advance following the Federal Reserve interest rate decision, and the exchange rate may attempt to test the 2022 high (151.95) as it appears to be tracking the positive slope in the 50-Day SMA (144.93).
US Dollar Forecast: USD/JPY Mirrors Rise in Long-Term US Yields
USD/JPY mirrors the rise in long-term Treasury yields as it trades to a fresh yearly high (148.96), and developments coming out of the US may continue to sway the exchange rate as Fed Governor Michelle Bowman insists that ‘further rate hikes will likely be needed to return inflation to 2 percent in a timely way.’
Join David Song for the Weekly Fundamental Market Outlook webinar. David provides a market overview and takes questions in real-time. Register Here
In a recent speech, Governor Bowman warns that ‘energy prices could rise further and reverse some of the progress we have seen on inflation in recent months, and the Federal Open Market Committee (FOMC) may continue to strike a hawkish forward guidance as the central bank remains ‘willing to raise the federal funds rate at a future meeting if the incoming data indicates that progress on inflation has stalled or is too slow to bring inflation to 2 percent in a timely way.’
US Economic Calendar

As a result, the update to the US Personal Consumption Expenditure (PCE) Price Index, the Fed’s preferred gauge for inflation, may produce headwinds for the Greenback as the core reading is expected to narrow to 3.9% in August from 4.2% per annum the month prior, but a stronger-than-expected print may keep USD/JPY afloat as it fuels speculation for a more restrictive policy.
Until then, USD/JPY may continue to mirror long-term Treasury yields as the Bank of Japan (BoJ) sticks to Quantitative and Qualitative Easing (QQE) with Yield Curve Control (YCC), and it remains to be seen if Japanese officials will intervene in FX markets as the exchange rate takes out the November 2022 high (148.83).
With that said, the diverging path between the Fed and BoJ may keep USD/JPY afloat, and the exchange rate may attempt to test the 2022 high (151.95) as it appears to be tracking the positive slope in the 50-Day SMA (144.93).
USD/JPY Price Chart – Daily

Chart Prepared by David Song, Strategist; USD/JPY on TradingView
- USD/JPY appears to be tracking the positive slope in the 50-Day SMA (144.93) as it clears the November 2022 high (148.83), with a break/close above the 149.40 (100% Fibonacci extension) to 150.30 (61.8% Fibonacci extension) region raising the scope for a test of the 2022 high (151.95).
- Next area of interest comes in around the July 1990 high (152.25) followed by the June 1990 high (155.80), but the Relative Strength Index (RSI) continues to diverge with price as the oscillator holds below overbought territory.
- Failure to break/close above the 149.40 (100% Fibonacci extension) to 150.30 (61.8% Fibonacci extension) region may keep RSI below 70, with a move below the 145.90 (50% Fibonacci extension) to 146.70 (78.6% Fibonacci retracement) area bringing the monthly low (144.45) on the radar.
Additional Market Outlooks:
US Dollar Forecast: USD/CAD Continues to Bounce Along 50-Day SMA
GBP/USD Falls After BoE Rate Decision to Push RSI Into Oversold Zone
--- Written by David Song, Strategist
Follow on Twitter at @DavidJSong


