US Dollar Outlook: USD/JPY
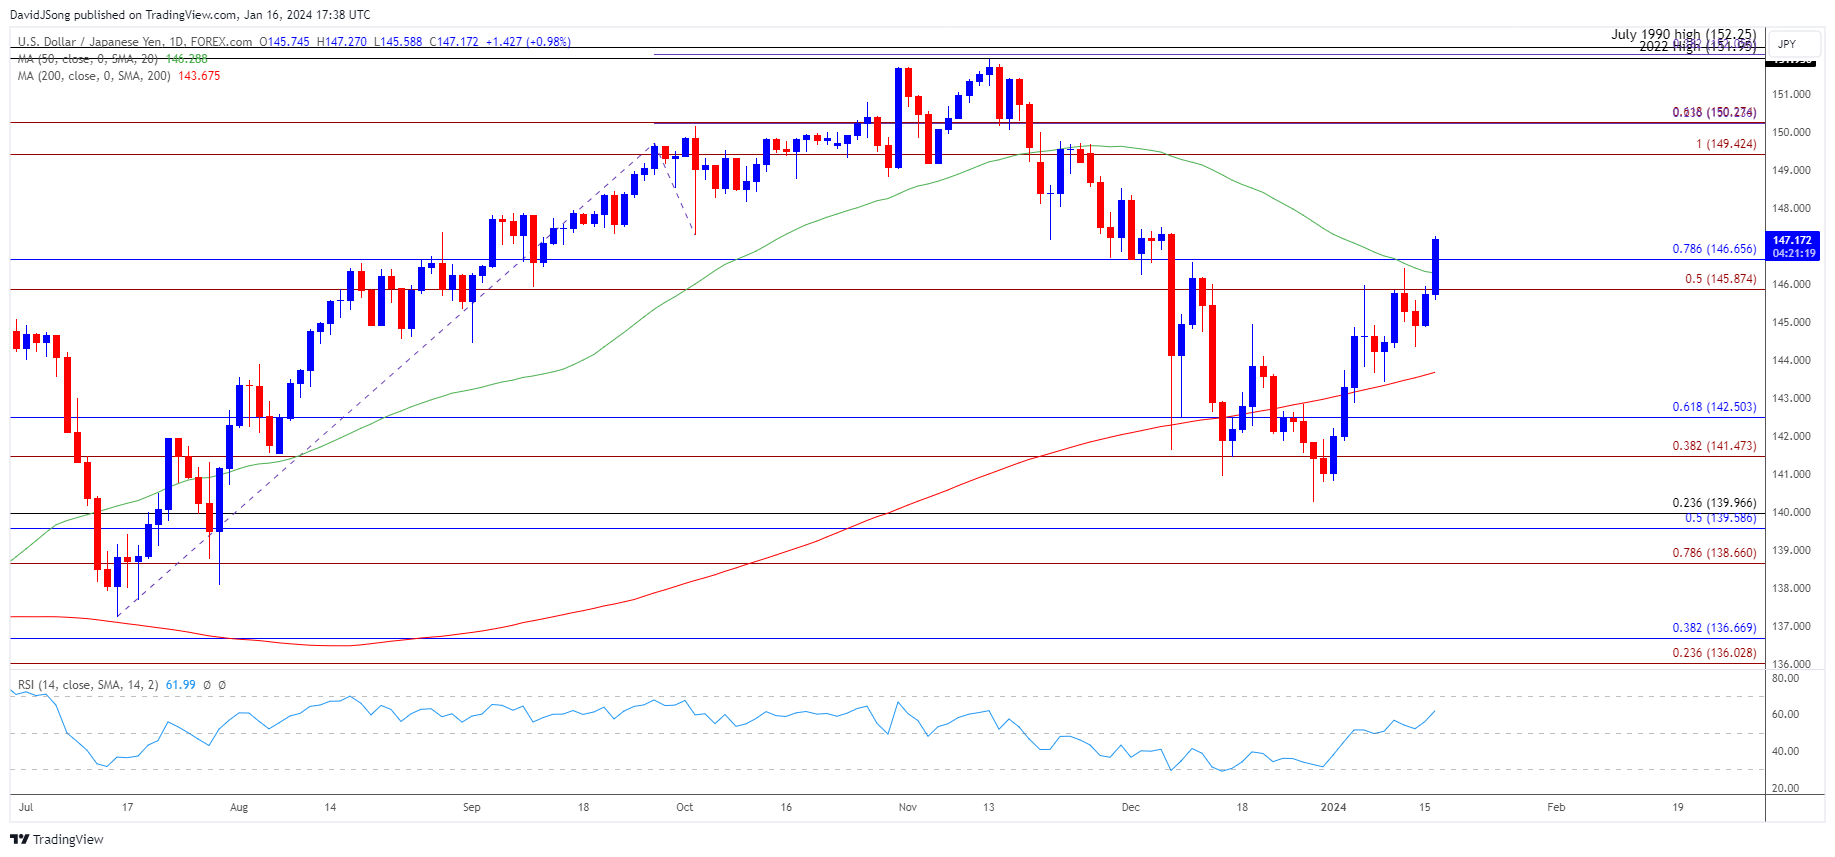
USD/JPY trades above the 50-Day SMA (146.29) for the first time since November as it climbs to a fresh monthly high (147.27), and the exchange rate may extend the advance from the start of the month amid the lack of response to the negative slope in the moving average.
US Dollar Forecast: USD/JPY Ignores Negative Slope in 50-Day SMA
USD/JPY struggled to retain the advance following the higher-than-expected print for the US Consumer Price Index (CPI), but the exchange rate may continue to retrace the decline from the December high (148.35) as it carves a series of higher highs and lows.
Join David Song for the Weekly Fundamental Market Outlook webinar. David provides a market overview and takes questions in real-time. Register Here
US Economic Calendar

At the same time, the update to the Retail Sales report may keep USD/JPY afloat as household spending is projected to increase 0.4% in December following the 0.3% expansion the month prior, and signs of resilient economy may force the Federal Reserve to keep US interest rates higher for longer in an effort to further combat inflation.
However, a weaker-than-expected Retail Sales report may produce headwinds for the US Dollar as it puts pressure on the Federal Open Market Committee (FOMC) to implement a rate cut sooner rather than later, and it remains to be seen the central bank will further adjust the forward guidance at its next interest rate decision on January 31 as Fed Governor Christopher Waller insists that ‘the timing and number of rate cuts will be driven by the incoming data’ while speaking at the Brookings Institution.
Until then, speculation surrounding Fed policy may sway USD/JPY as the Bank of Japan (BoJ) sticks to Quantitative and Qualitative Easing (QQE) with Yield Curve Control (YCC), but recent price action raises the scope for a move towards the December high (148.35) as it carves a series of higher highs and lows.
With that said, USD/JPY may continue to register fresh monthly highs as it ignores the negative slope in the 50-Day SMA (146.29), and the Relative Strength Index (RSI) may show the bullish momentum gathering pace as it climbs towards overbought territory.
USD/JPY Price Chart – Daily

Chart Prepared by David Song, Strategist; USD/JPY on TradingView
- USD/JPY climbs above the 50-Day SMA (146.29) for the first time since November as it trades to a fresh monthly high (147.27), with a close above the 145.90 (50% Fibonacci extension) to 146.70 (78.6% Fibonacci retracement) region bringing the December high (148.35) on the radar amid the lack of response to the negative slope in the moving average.
- Next area of interest comes in around 149.40 (100% Fibonacci extension) to 150.30 (61.8% Fibonacci extension), but failure to hold above the moving average may curb the bullish price action in USD/JPY.
- A move below the 145.90 (50% Fibonacci extension) to 146.70 (78.6% Fibonacci retracement) region may push USD/JPY back towards last week’s low (143.42), with a move below the 141.50 (38.2% Fibonacci extension) to 142.50 (61.8% Fibonacci retracement) area opening up the monthly low (140.82).
Additional Market Outlooks:
GBP/USD Forecast: Ascending Channel Remains Intact Ahead of UK CPI
US Dollar Forecast: EUR/USD 2024 Opening Range Break in Focus
--- Written by David Song, Strategist
Follow on Twitter at @DavidJSong


