US Dollar Outlook: USD/JPY
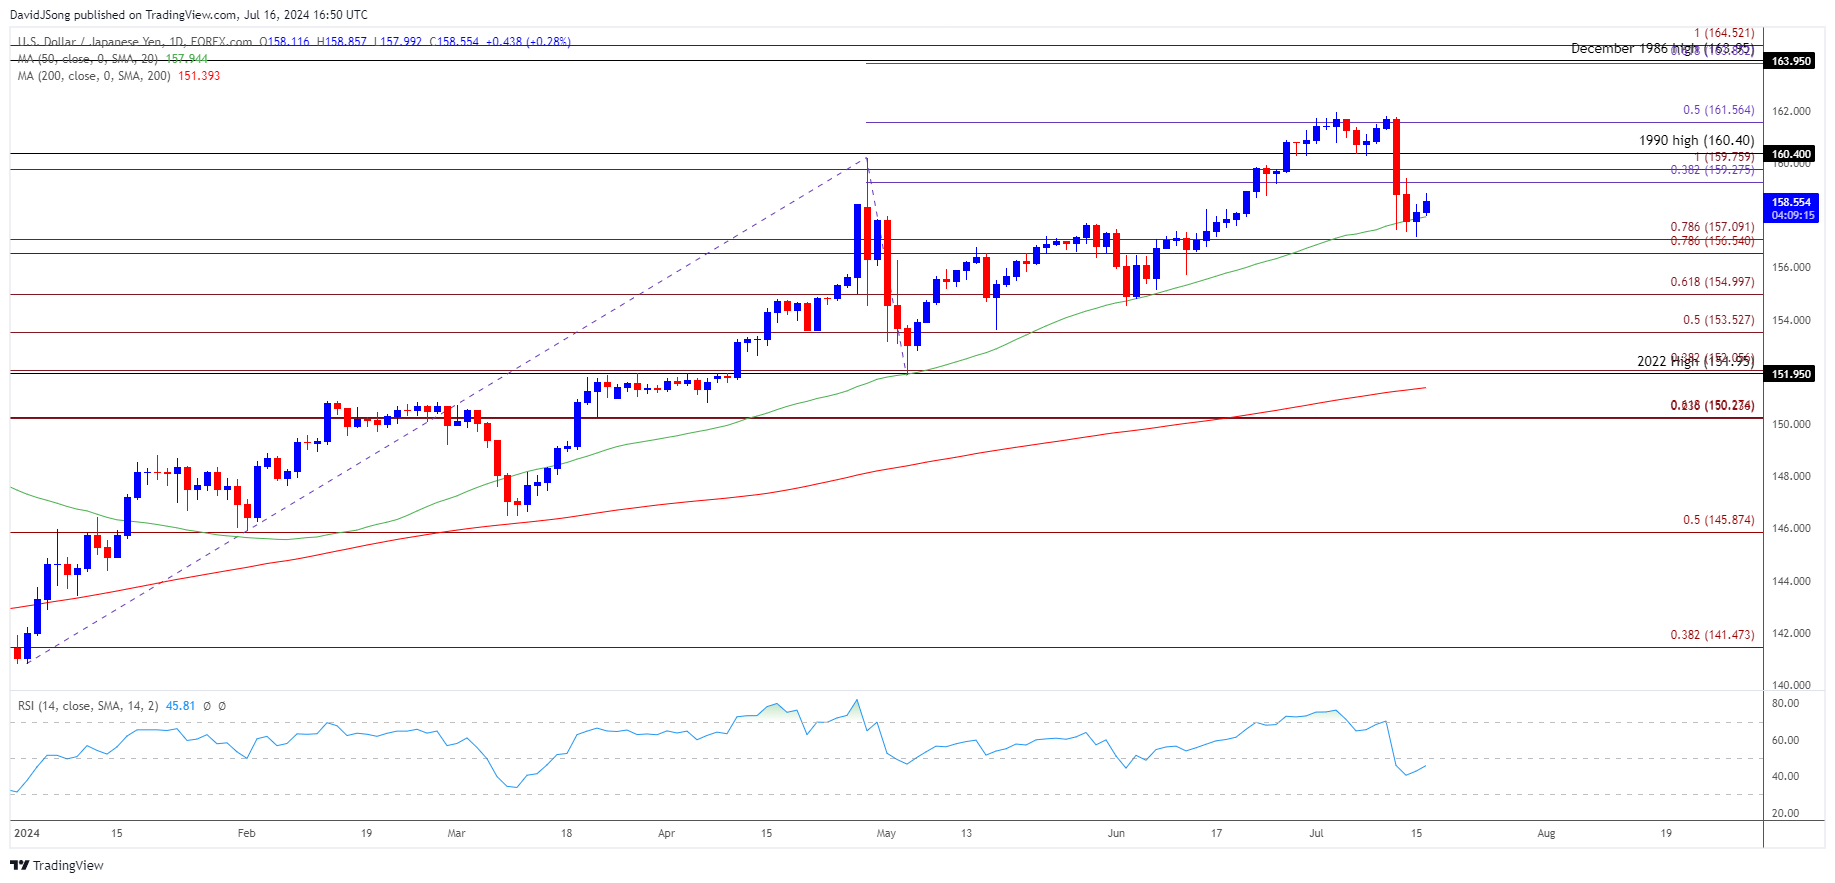
USD/JPY extends the advance from the start of the week even as US Retail Sales holds flat in June, and the exchange rate may track the positive slope in the 50-Day SMA (157.95) amid the failed attempts to close below the moving average.
US Dollar Forecast: USD/JPY Fails to Close Below 50-Day SMA
USD/JPY may further retrace the decline from the monthly high (161.95) as it snaps the series of lower highs and lows carried over from last week, and it remains to be seen if the Federal Reserve will respond to the recent data prints as the update from the US Census Bureau shows Retail Sales excluding Autos increasing 0.4% versus forecasts for a 0.1% rise.
Join David Song for the Weekly Fundamental Market Outlook webinar. David provides a market overview and takes questions in real-time. Register Here
The expansion in core retail sales may encourage the Federal Open Market Committee (FOMC) to further combat inflation as the central bank needs to ‘see more good data to bolster our confidence that inflation is moving sustainably toward 2 percent,’ and fresh remarks from Fed officials may sway USD/JPY especially as the Bank of Japan (BoJ) shows little interest in pursuing a rate-hike cycle.
US Economic Calendar

At the same time, the FOMC seems to be in no rush to switch gears as Chairman Jerome Powell endorses a data-dependent approach in front of Congress, and USD/JPY may further retrace the decline from the monthly high (161.95) if Fed officials show a greater willingness to keep US interest rates higher for longer.
However, Fed officials may start to prepare US households and businesses for a less restrictive policy as ‘the median participant projects that the appropriate level of the federal funds rate will be 5.1 percent at the end of this year,’ and the upcoming speeches may drag on USD/JPY should the central bank talk up speculation for a change in regime.
With that said, expectations for a looming Fed rate-cut may drag on USD/JPY, but the exchange rate exchange rate may track the positive slope in the 50-Day SMA (157.95) amid the failed attempts to close below the moving average.
USD/JPY Price Chart – Daily

Chart Prepared by David Song, Strategist; USD/JPY on TradingView
- USD/JPY snaps the series of lower highs and lows from last week after struggling to close below the 50-Day SMA (157.95), and the exchange rate may extend the rebound from the monthly low (157.17) should it track the positive slope in the moving average.
- A breach above the 159.30 (38.2% Fibonacci extension) to 159.80 (100% Fibonacci extension) region may push USD/JPY back towards the 1990 high (160.40), with a move above 161.60 (50% Fibonacci extension) bringing the monthly high (161.95) on the radar.
- However, lack of momentum to hold above the 156.50 (78.6% Fibonacci extension) to 157.10 (78.6% Fibonacci extension) area may push USD/JPY towards 155.00 (61.8% Fibonacci extension), with the next region of interest coming in around the June low (154.54).
Additional Market Outlooks
Canadian Dollar Forecast: USD/CAD Rebound Emerges Ahead of Canada CPI
Euro Forecast: EUR/USD Eyes June High Ahead of ECB Rate Decision
--- Written by David Song, Strategist
Follow on Twitter at @DavidJSong


