US Dollar Outlook: USD/JPY
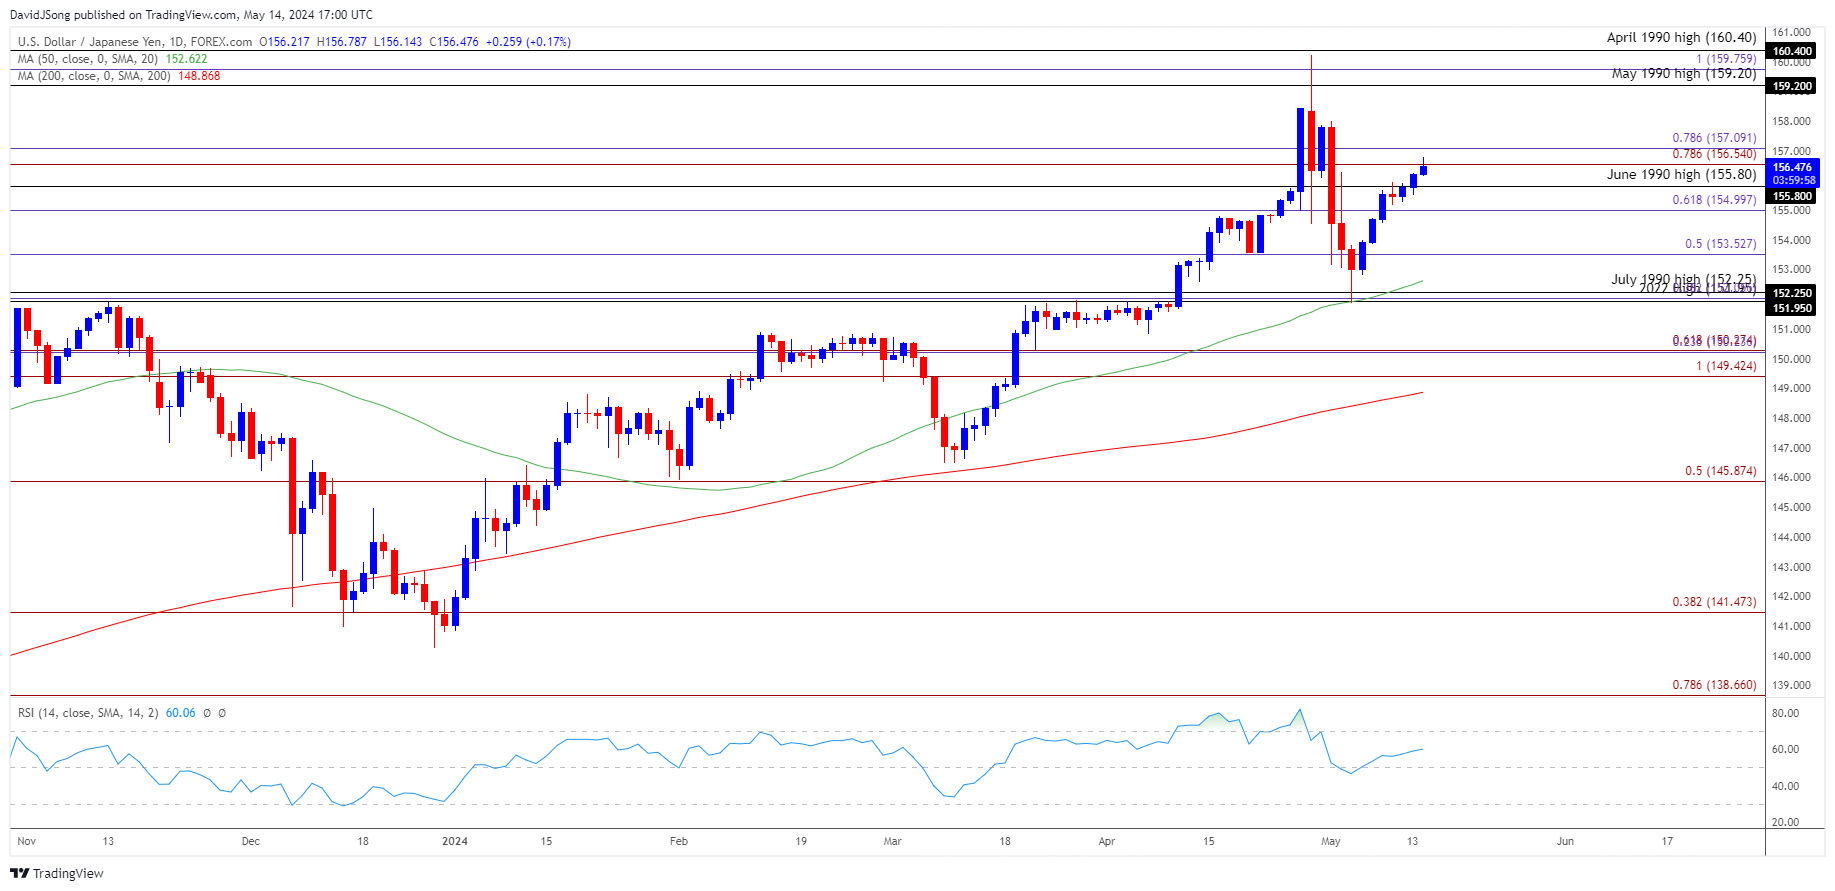
USD/JPY extends the rebound from the 50-Day SMA (152.62) to approach the monthly high (157.99), and the exchange rate may track the positive slope in the moving average as the former-resistance zone around the July 1990 high (152.25) seems to be acting as support.
US Dollar Forecast: USD/JPY Extends Rebound from 50-Day
USD/JPY may continue to retrace the decline following the Federal Reserve interest rate decision as it stages a three-day rally, and the diverging paths between the Fed and Bank of Japan (BoJ) may keep the exchange rate afloat as Governor Kazuo Ueda and Co. anticipate that ‘accommodative financial conditions will be maintained for the time being.’
Join David Song for the Weekly Fundamental Market Outlook webinar. David provides a market overview and takes questions in real-time. Register Here
As a result, developments coming out of the US may sway USD/JPY as the Federal Open Market Committee (FOMC) shows a greater willingness to keep US interest rates higher for longer, but the central bank may continue to prepare households and businesses for a less restrictive policy as the Chairman Jerome Powell and Co. plan to ‘slow the pace of decline in our securities holdings.’
US Economic Calendar

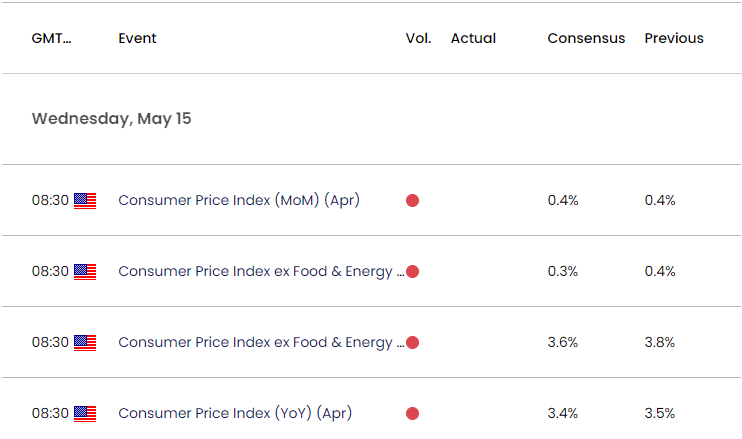
In turn, the update to the US Consumer Price Index (CPI) may encourage the FOMC to switch gears later this year as both the headline and core reading are expected to narrow in April, and evidence of slowing price growth may drag on the Greenback as raises the Fed’s scope to implement a rate-cut in 2024.
However, a higher-than-expected CPI print may fuel the recent recovery in USD/JPY as it puts pressure on the FOMC to further combat inflation, and the exchange rate may continue to retrace the decline from the monthly high (157.99) should it track the positive slope in the 50-Day SMA (152.62).
With that said, USD/JPY may extend the rebound from the moving average as the former-resistance zone around the July 1990 high (152.25) seems to be acting as support, but the exchange rate may hold within the opening range for May if it struggles to extend the recent series of higher highs and lows.
USD/JPY Price Chart – Daily

Chart Prepared by David Song, Strategist; USD/JPY on TradingView
- USD/JPY extends the rebound from the 50-Day SMA (152.62) to register a fresh weekly high (156.79), with a move above the 156.50 (78.6% Fibonacci extension) to 157.10 (78.6% Fibonacci extension) region bringing the monthly high (157.99) on the radar.
- Next area of interest comes in around 159.20 (May 1990 high) to 159.80 (100% Fibonacci extension), and USD/JPY may track the positive slope in the moving average as the former-resistance zone around the July 1990 high (152.25) seems to be acting as support.
- A breach above the April high (160.22) raises the scope for a test of the April 1990 high (160.40), but failure to push above the monthly opening range may curb the recent series of higher highs and lows in USD/JPY.
- A move below 155.00 (61.8% Fibonacci extension) may push USD/JPY back towards 153.50 (50% Fibonacci extension), with the next area of interest coming in around the monthly low (151.87).
Additional Market Outlooks
US Dollar Forecast: GBP/USD Eyes 50-Day SMA Ahead of US CPI
US Dollar Forecast: EUR/USD Negates Bear Flag Formation
--- Written by David Song, Strategist
Follow on Twitter at @DavidJSong


