US Dollar Outlook: USD/JPY
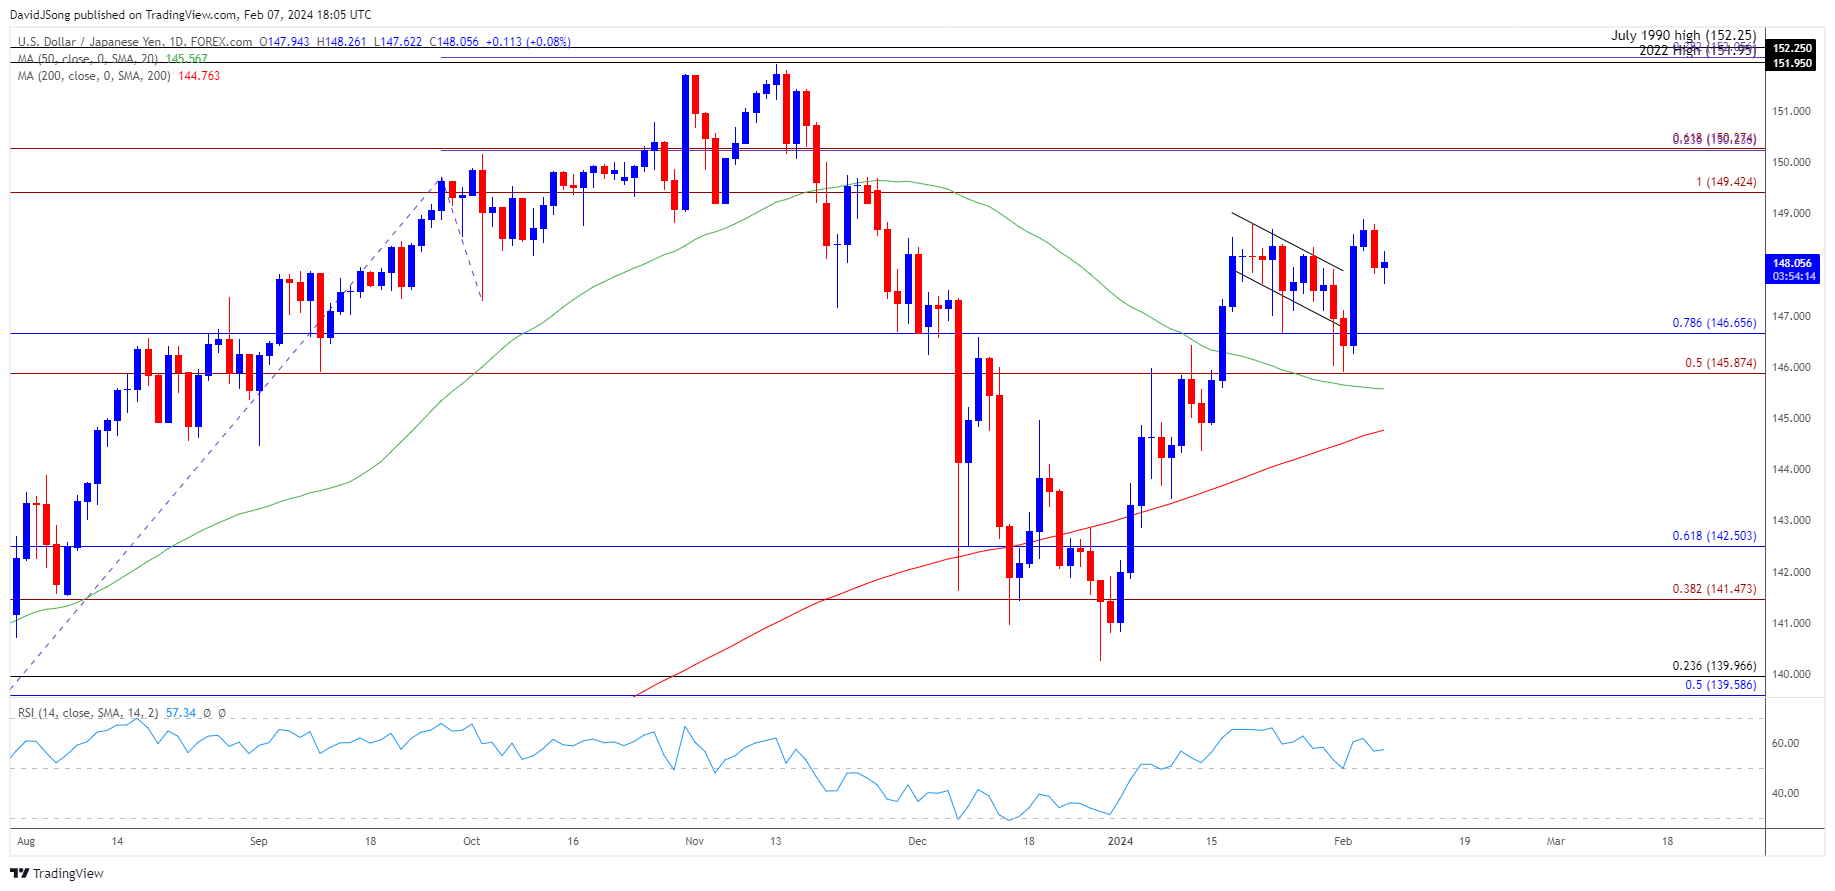
USD/JPY attempts to breakout out of a bull-flag formation following the stronger-than-expected US Non-Farm Payrolls (NFP) report, and the exchange rate may further retrace the decline from the 2023 high (151.91) as it holds above the 50-Day SMA (145.57).
US Dollar Forecast: USD/JPY Attempts to Breakout of Bull Flag Pattern
USD/JPY appears to be tracking the rebound in long-term US Treasury yields as it bounces back from a fresh weekly low (147.71), and the diverging paths between the Bank of Japan (BoJ) and Federal Reserve may keep the exchange rate afloat as Governor Kazuo Ueda and Co. stick to Quantitative and Qualitative Easing (QQE) with Yield Curve Control (YCC).
Join David Song for the Weekly Fundamental Market Outlook webinar. David provides a market overview and takes questions in real-time. Register Here
Meanwhile, the Federal Open Market Committee (FOMC) seems to be in no rush to switch gears as Chairman Jerome Powell rules out a rate cut in March, but the update to the US Consumer Price Index (CPI) may produce headwinds for the Greenback as the report is anticipated to show slowing inflation.
US Economic Calendar

Another downtick in both the headline and core CPI may drag on USD/JPY as it encourages the FOMC to pursue a less restrictive policy, and the central bank may gradually adjust its forward guidance over the coming months as Fed officials forecast lower interest rates in 2024.
However, a higher-than-expected CPI print may generate a bullish reaction in the Greenback as it puts pressure on the FOMC to further combat inflation, and the central bank may retain a wait-and-see approach at its next interest rate decision on March 20 as Chairman Powell and Co. are ‘prepared to maintain the current target range for the federal funds rate for longer, if appropriate.’
Until then, speculation surrounding Fed policy may sway USD/JPY as the central bank endorses a data dependent approach in managing monetary policy, and the exchange rate may largely mirror future developments in long-term US Treasury yields on the back of carry trade interest.
With that said, USD/JPY may consolidate ahead of the US CPI print as it registers a fresh weekly low (147.71), but the exchange rate may further retrace the decline from the 2023 high (151.91) as it attempts to breakout of a bull flag formation.
USD/JPY Price Chart – Daily

Chart Prepared by David Song, Strategist; USD/JPY on TradingView
- USD/JPY carves a series of lower highs and lows after clearing the January high (148.81), with a break/close below the 145.90 (50% Fibonacci extension) to 146.70 (78.6% Fibonacci retracement) area raising the scope for a move towards the 50-Day SMA (145.57).
- Next region of interest comes in around 141.50 (38.2% Fibonacci extension) to 142.50 (61.8% Fibonacci retracement), but USD/JPY may continue to hold above the moving average as it attempts to breakout of a bull flag formation.
- A breach above the monthly high (148.90) brings the 149.40 (100% Fibonacci extension) to 150.30 (61.8% Fibonacci extension) region on the radar, with the next area of interest coming in around the 2023 high (151.91).
Additional Market Outlooks
EUR/USD Post-NFP Selloff Brings Test of December Low
US Dollar Forecast: GBP/USD Vulnerable on Close Below 50-Day SMA
--- Written by David Song, Strategist
Follow on Twitter at @DavidJSong


