US Dollar Outlook: USD/JPY
USD/JPY consolidates after failing to clear the monthly high (150.89), but the exchange rate may attempt to break out of its recent range as an ascending triangle formation takes shape.
US Dollar Forecast: USD/JPY Ascending Triangle Takes Shape
USD/JPY seems to be unfazed by the downward revision in the US Gross Domestic Product (GDP) report, which showed the economy growing 3.2% in the fourth quarter of 2023 versus an initial forecast of 3.3%, and the exchange rate may track the positive slope in the 50-Day SMA (146.99) as the Bank of Japan (BoJ) pledges to ‘patiently continue with monetary easing.’
Join David Song for the Weekly Fundamental Market Outlook webinar. David provides a market overview and takes questions in real-time. Register Here
Meanwhile, the Federal Reserve appears to be in no rush to unwind its restrictive policy as Governor Michelle Bowman, a permanent voting-member on the Federal Open Market Committee (FOMC), insists that the central bank is ‘not yet at that point’ while speaking at the Florida Bankers Association.
Governor Bowman warns that ‘reducing our policy rate too soon could result in requiring further future policy rate increases to return inflation to 2 percent in the longer run,’ with the official going onto say that ‘I remain willing to raise the federal funds rate at a future meeting should the incoming data indicate that progress on inflation has stalled or reversed.’
As a result, the diverging paths between the FOMC and BoJ may keep USD/JPY afloat as Chairman Jerome Powell rules out a rate cut in March, but the update the US Personal Consumption Expenditure (PCE) Price Index may push the Fed to switch gears sooner rather than later as the report is anticipated to show slowing inflation.
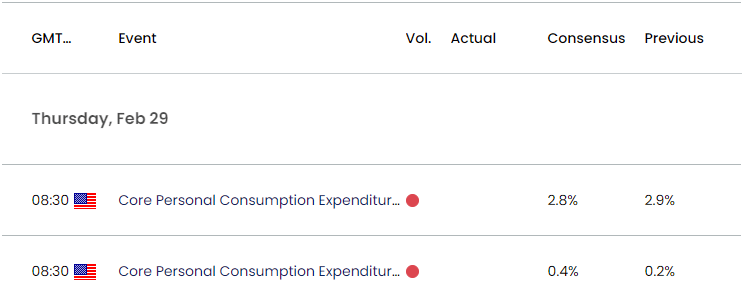
US Economic Calendar

The core PCE, the Fed’s preferred gauge for inflation, is seen narrowing to 2.8% in January from 2.9% per annum the month prior, and evidence of slowing inflation may drag on USD/JPY as it fuels speculation for a looming change in regime.
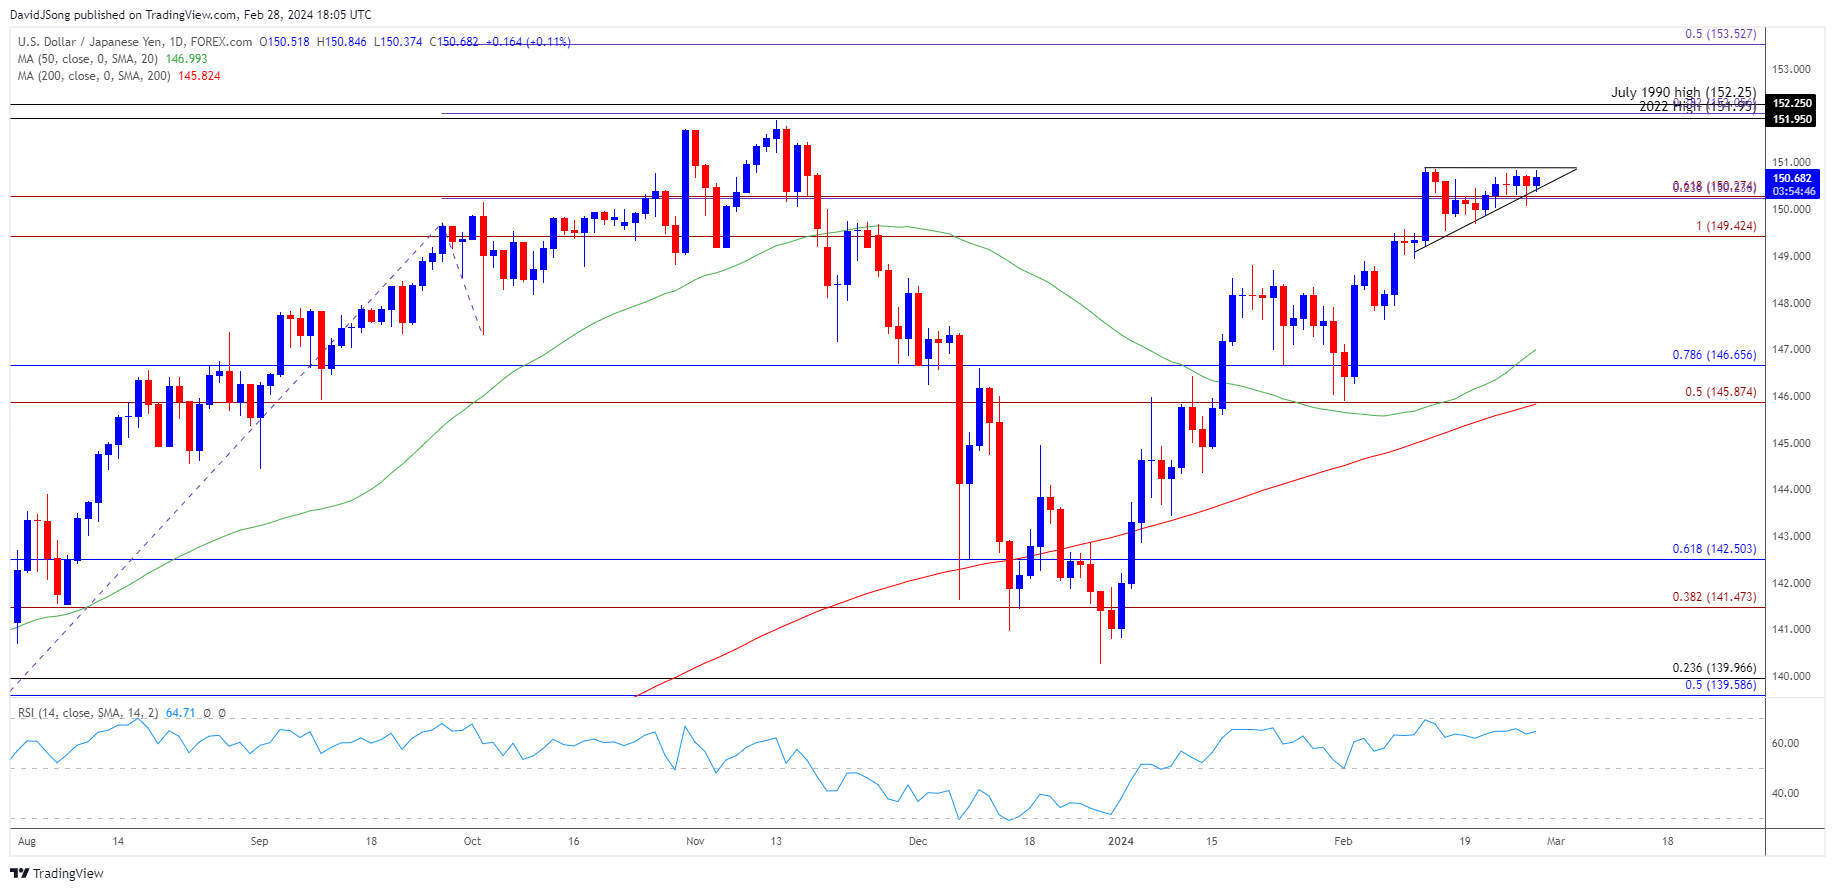
However, a higher-than-expected core PCE print may generate a bullish reaction in the Greenback as it puts pressure on the FOMC to keep US interest rates higher for longer, and USD/JPY may stage further attempts to clear the monthly high (150.89) as it appears to be trading within an ascending triangle formation.
With that said, USD/JPY may track the positive slope in the 50-Day SMA (146.99) should the continuation pattern unfold, but the Relative Strength Index (RSI) may diverge with price as it continues to hold below overbought territory.
USD/JPY Price Chart – Daily

Chart Prepared by David Song, Strategist; USD/JPY on TradingView
- USD/JPY seems to be stuck in a narrow range as it fails to clear the monthly high (150.89), and failure to defend the 149.40 (100% Fibonacci extension) to 150.30 (61.8% Fibonacci extension) region may push USD/JPY towards the 50-Day SMA (146.99) as the Relative Strength Index (RSI) continues to hold below overbought territory.
- At the same time, an ascending triangle formation has emerged as USD/JPY holds above the 149.40 (100% Fibonacci extension) to 150.30 (61.8% Fibonacci extension) region, with a break above the monthly high (150.89) bringing the 2023 high (151.91) back on the radar.
- Next area of interest comes in around 151.95 (2022 high) to 152.25 (July 1990 high), with a move above 70 in the RSI likely to be accompanied by a near-term rally in the exchange rate like the price action from last year.
Additional Market Outlooks
Australian Dollar Forecast: AUD/USD Reverses Ahead of Monthly High
US Dollar Forecast: GBP/USD Attempts to Trade Back Above 50-Day SMA
--- Written by David Song, Strategist
Follow on Twitter at @DavidJSong


